Climate for Station: St Margaret's Bay, Nova Scotia, Canada
Loading live weather...
Climate Analysis & Overview
St Margaret's Bay is experiencing a nuanced climate shift, with a slight all-time warming trend in both high and low temperatures, but a more pronounced warming trend in lows over the past decade. Precipitation patterns have become more evenly distributed, suggesting a shift towards more consistent rainfall events.
Maritime Climate Dynamics
St Margaret's Bay, located at 44.7°N, 63.9°W, is characterised by a humid continental climate, influenced heavily by its proximity to the Atlantic Ocean. This maritime influence moderates temperatures, resulting in milder winters and cooler summers compared to inland regions. The all-time temperature trends indicate a subtle warming, with high temperatures rising by 0.14°C (0.25°F) and low temperatures increasing by 0.32°C (0.58°F). This suggests a gradual warming over the long term, aligning with broader regional climate goals to monitor and adapt to climate change impacts.
Decadal Thermal Variations
The past decade has seen contrasting temperature trends in St Margaret's Bay. High temperatures have shown a cooling trend, decreasing by 0.77°C (1.39°F), while low temperatures have increased significantly by 2.00°C (3.60°F). This divergence may indicate more pronounced warming during the night or winter months, possibly linked to changes in atmospheric circulation patterns or increased cloud cover, which can trap heat during the night.
Precipitation Patterns and Distribution
The Precipitation Concentration Index (PCI) has decreased from a baseline of 11.24 to a current value of 9.64. This reduction indicates a more even distribution of precipitation throughout the year, moving away from concentrated heavy rainfall events. Such a shift could lead to more consistent water availability and reduced flood risk, benefiting both natural ecosystems and human activities in the region.
Extreme Weather Benchmarks
St Margaret's Bay has recorded extreme temperatures with a maximum of 36.0°C (96.8°F) and a minimum of -32.8°C (-27.0°F). These records highlight the potential for significant temperature variability in the region, which can pose challenges for local infrastructure and ecosystems. Understanding these extremes is crucial for planning and resilience strategies, particularly as climate change may increase the frequency of such events.
Geographical and Climatic Influences
The local geography, characterised by its coastal location and proximity to the Atlantic Ocean, plays a crucial role in shaping the climate of St Margaret's Bay. The ocean acts as a thermal buffer, mitigating extreme temperatures and contributing to the observed trends. This interplay between geography and climate underscores the importance of localised studies in understanding broader climatic shifts and their implications for regional climate adaptation strategies.
Station Statistics
10-Year Trend
High: -1.60 °F/decade
Low: +3.68 °F/decade
Rain: -0.010 in/decade
25-Year Trend
High: +0.68 °F/decade
Low: +1.88 °F/decade
Rain: +0.005 in/decade
50-Year Trend
High: +0.53 °F/decade
Low: +1.69 °F/decade
Rain: +0.009 in/decade
All-Time Trend
High: +0.24 °F/decade
Low: +0.58 °F/decade
Rain: +0.002 in/decade
Percentage Above-Average Days
Last 12 Months: 46.0%
This Year: 29.7%
Precipitation Concentration Index (PCI) ℹ️
Last 12 Months: 10.3
Historical Average: 10.1
Percentile Rank of Last 12 Months ℹ️
High: 54th percentile
Low: 90th percentile
Rain: 21st percentile
Change in Variance ℹ️
High: -0.1%
Low: -7.6%
Intraday: -30.7%
Data Coverage
85.8%
First Year of Data
1922
Station Location
Historical Weather Records
| Max High | Avg High | Min High | Max Avg | Avg Avg | Min Avg | Max Low | Avg Low | Min Low | Max Precipitation | Avg Precipitation | Max Snow | Avg Snow | |
|---|---|---|---|---|---|---|---|---|---|---|---|---|---|
| Record | 96.80 °F | — | -5.08 °F | 82.40 °F | — | -7.24 °F | 78.80 °F | — | -27.04 °F | 5.20 in | — | 23.23 in | — |
| January | 59.00 °F | 32.18 °F | -4.00 °F | 50.00 °F | 25.19 °F | -4.90 °F | 46.04 °F | 13.94 °F | -27.04 °F | 4.45 in | 0.15 in | 18.11 in | 0.52 in |
| February | 62.60 °F | 32.31 °F | 1.04 °F | 46.94 °F | 25.56 °F | -7.24 °F | 46.04 °F | 12.89 °F | -25.06 °F | 3.10 in | 0.15 in | 23.23 in | 0.60 in |
| March | 73.04 °F | 38.84 °F | 6.08 °F | 65.30 °F | 31.52 °F | 5.90 °F | 50.90 °F | 21.59 °F | -18.04 °F | 2.75 in | 0.13 in | 19.69 in | 0.36 in |
| April | 80.96 °F | 48.22 °F | 22.10 °F | 57.20 °F | 39.90 °F | 23.00 °F | 51.98 °F | 30.84 °F | 1.94 °F | 4.21 in | 0.13 in | 7.87 in | 0.10 in |
| May | 89.60 °F | 58.68 °F | 33.08 °F | 68.54 °F | 48.78 °F | 35.06 °F | 60.80 °F | 38.84 °F | 19.04 °F | 4.47 in | 0.13 in | 9.02 in | 0.01 in |
| June | 96.80 °F | 67.37 °F | 39.92 °F | 79.16 °F | 57.60 °F | 42.80 °F | 69.98 °F | 47.34 °F | 28.94 °F | 3.35 in | 0.12 in | 0.00 in | 0.00 in |
| July | 93.20 °F | 73.53 °F | 53.96 °F | 77.90 °F | 64.75 °F | 52.81 °F | 71.60 °F | 54.09 °F | 30.92 °F | 4.65 in | 0.11 in | 0.00 in | 0.00 in |
| August | 93.92 °F | 73.73 °F | 53.06 °F | 82.40 °F | 65.66 °F | 53.15 °F | 78.80 °F | 54.12 °F | 32.00 °F | 4.90 in | 0.12 in | 0.00 in | 0.00 in |
| September | 95.00 °F | 67.60 °F | 41.00 °F | 80.60 °F | 60.13 °F | 42.80 °F | 75.20 °F | 47.46 °F | 24.98 °F | 5.20 in | 0.13 in | 0.00 in | 0.00 in |
| October | 87.08 °F | 57.43 °F | 28.04 °F | 67.64 °F | 50.63 °F | 34.34 °F | 66.20 °F | 38.85 °F | 14.00 °F | 3.26 in | 0.15 in | 4.02 in | 0.01 in |
| November | 75.02 °F | 47.36 °F | 18.50 °F | 64.94 °F | 41.26 °F | 16.70 °F | 62.60 °F | 31.57 °F | 3.02 °F | 3.15 in | 0.16 in | 9.84 in | 0.06 in |
| December | 68.00 °F | 36.97 °F | -5.08 °F | 57.20 °F | 31.70 °F | 4.10 °F | 55.40 °F | 20.62 °F | -18.40 °F | 4.53 in | 0.17 in | 15.00 in | 0.35 in |
Data Visualisations
Remove WatermarksCurrent Year Climate Trends vs Historical


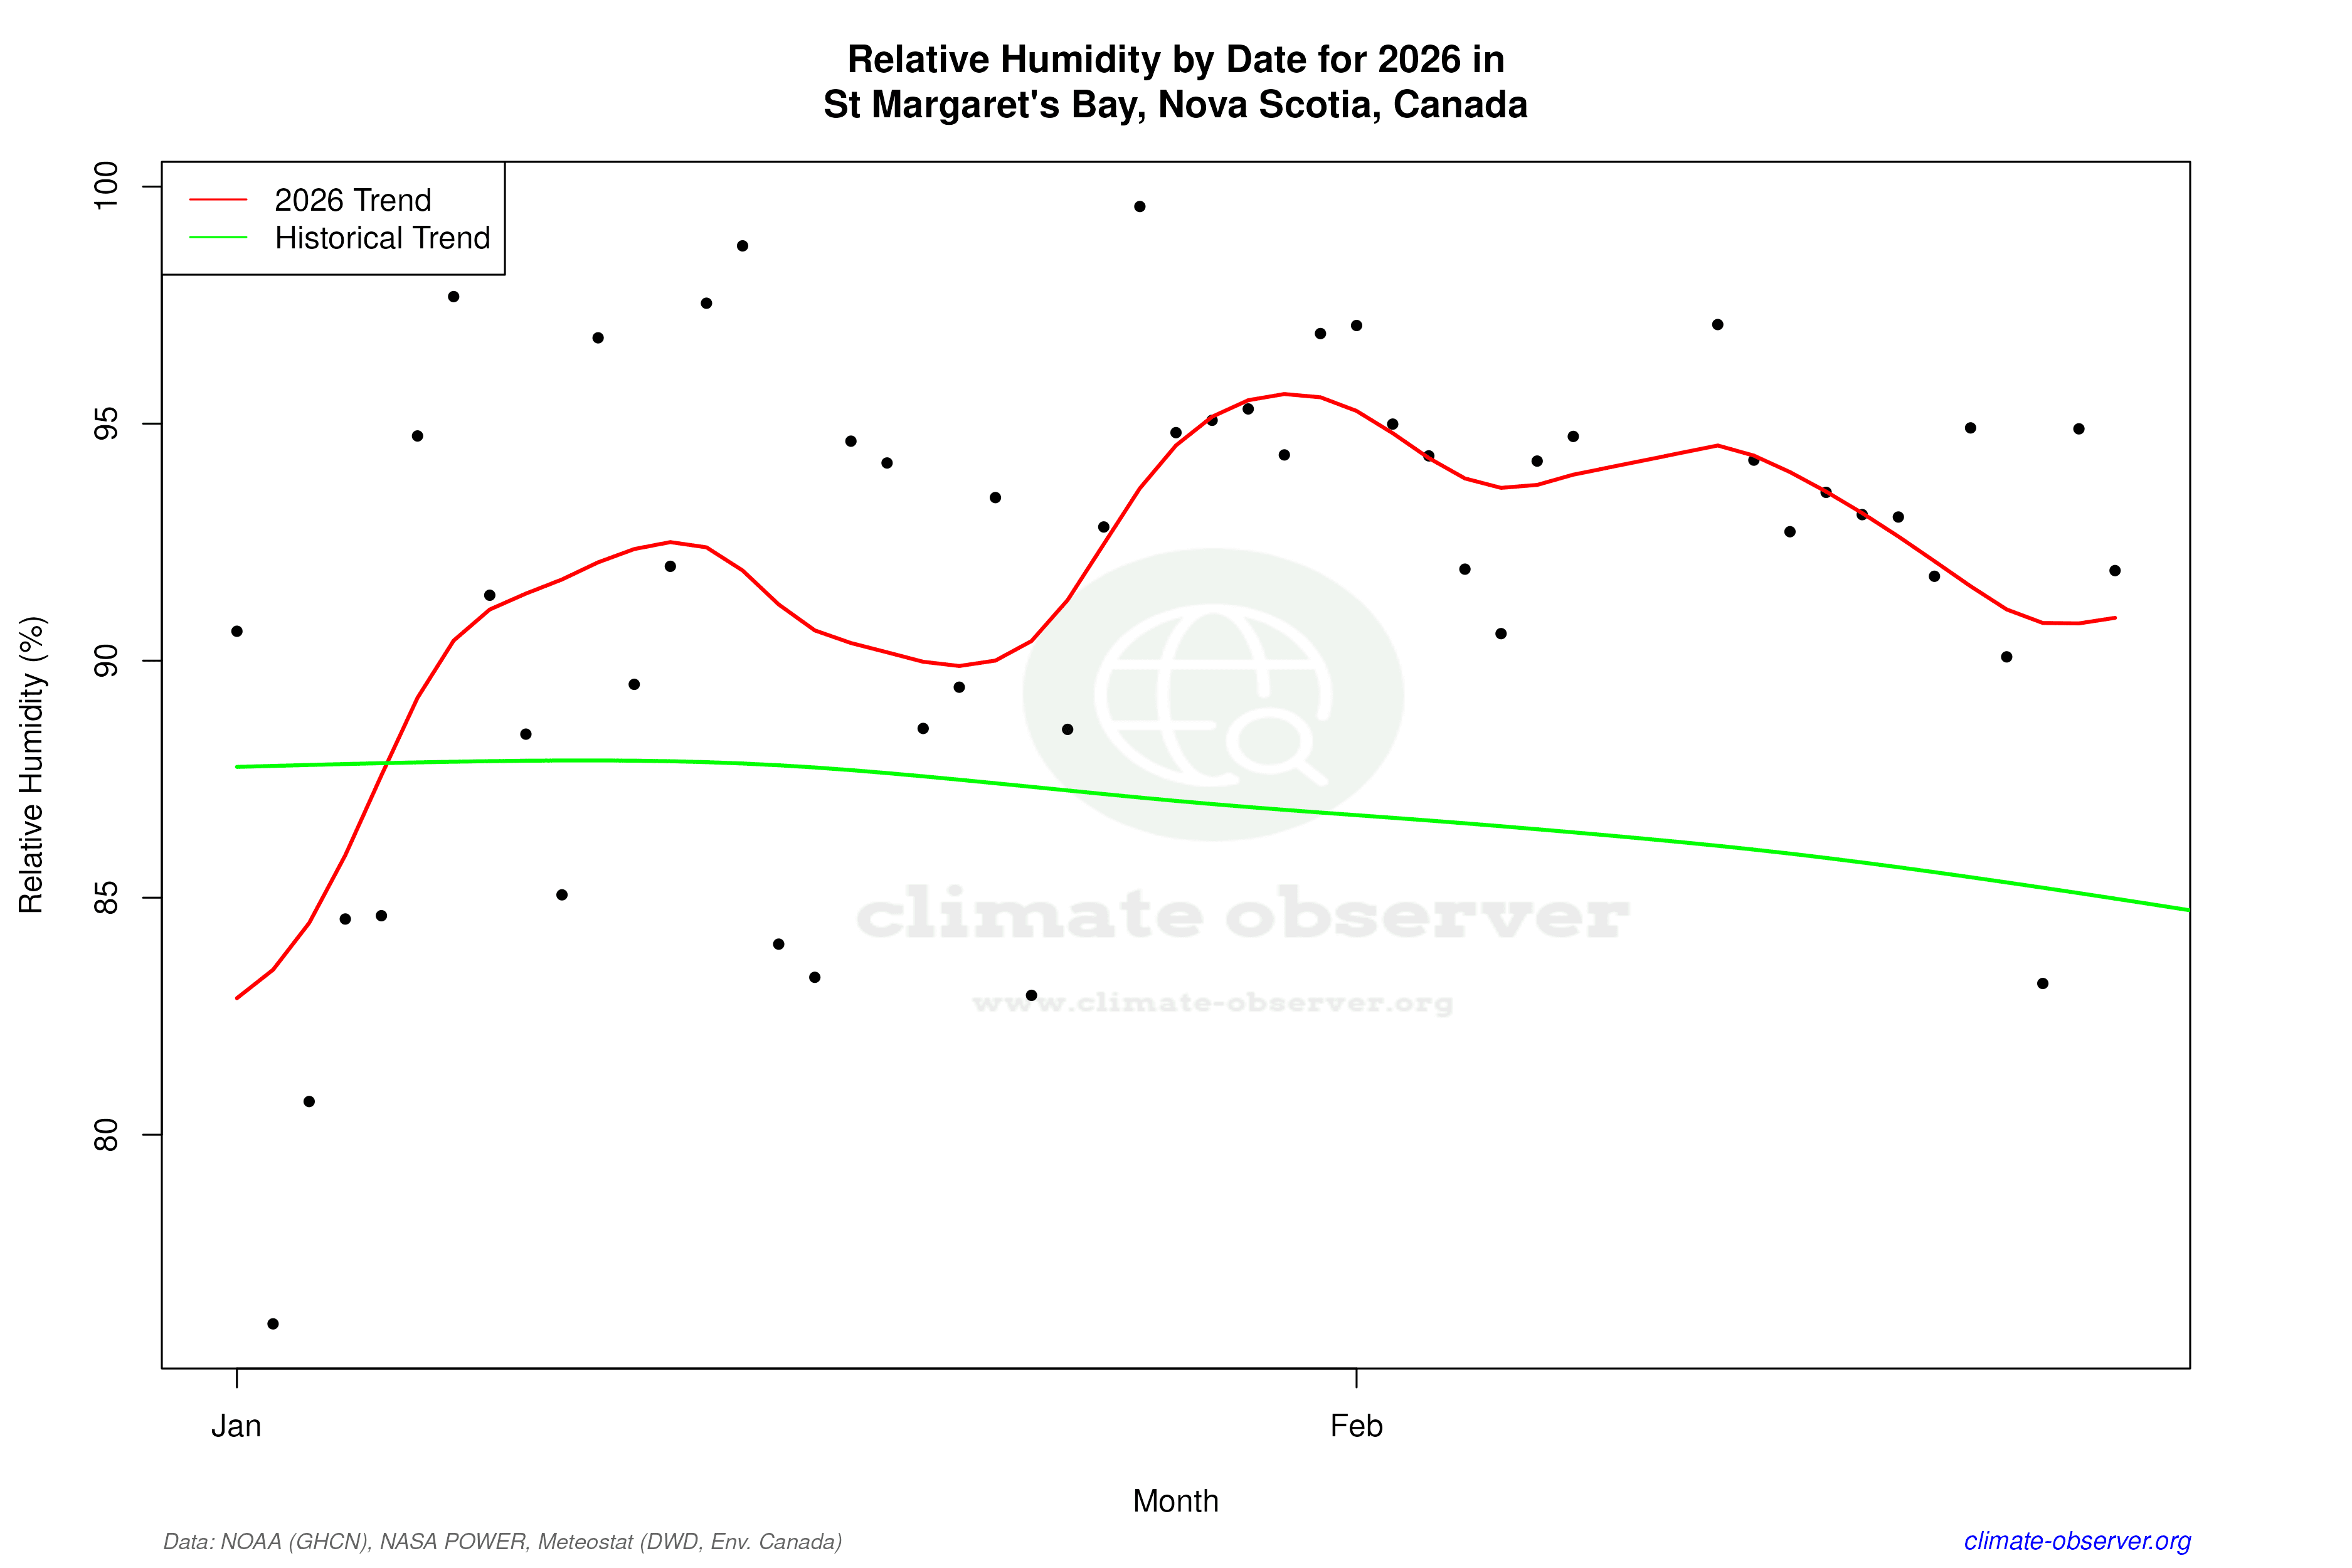

Max Temperature this Year | 1 of 6
Climate 12-Month Moving Averages


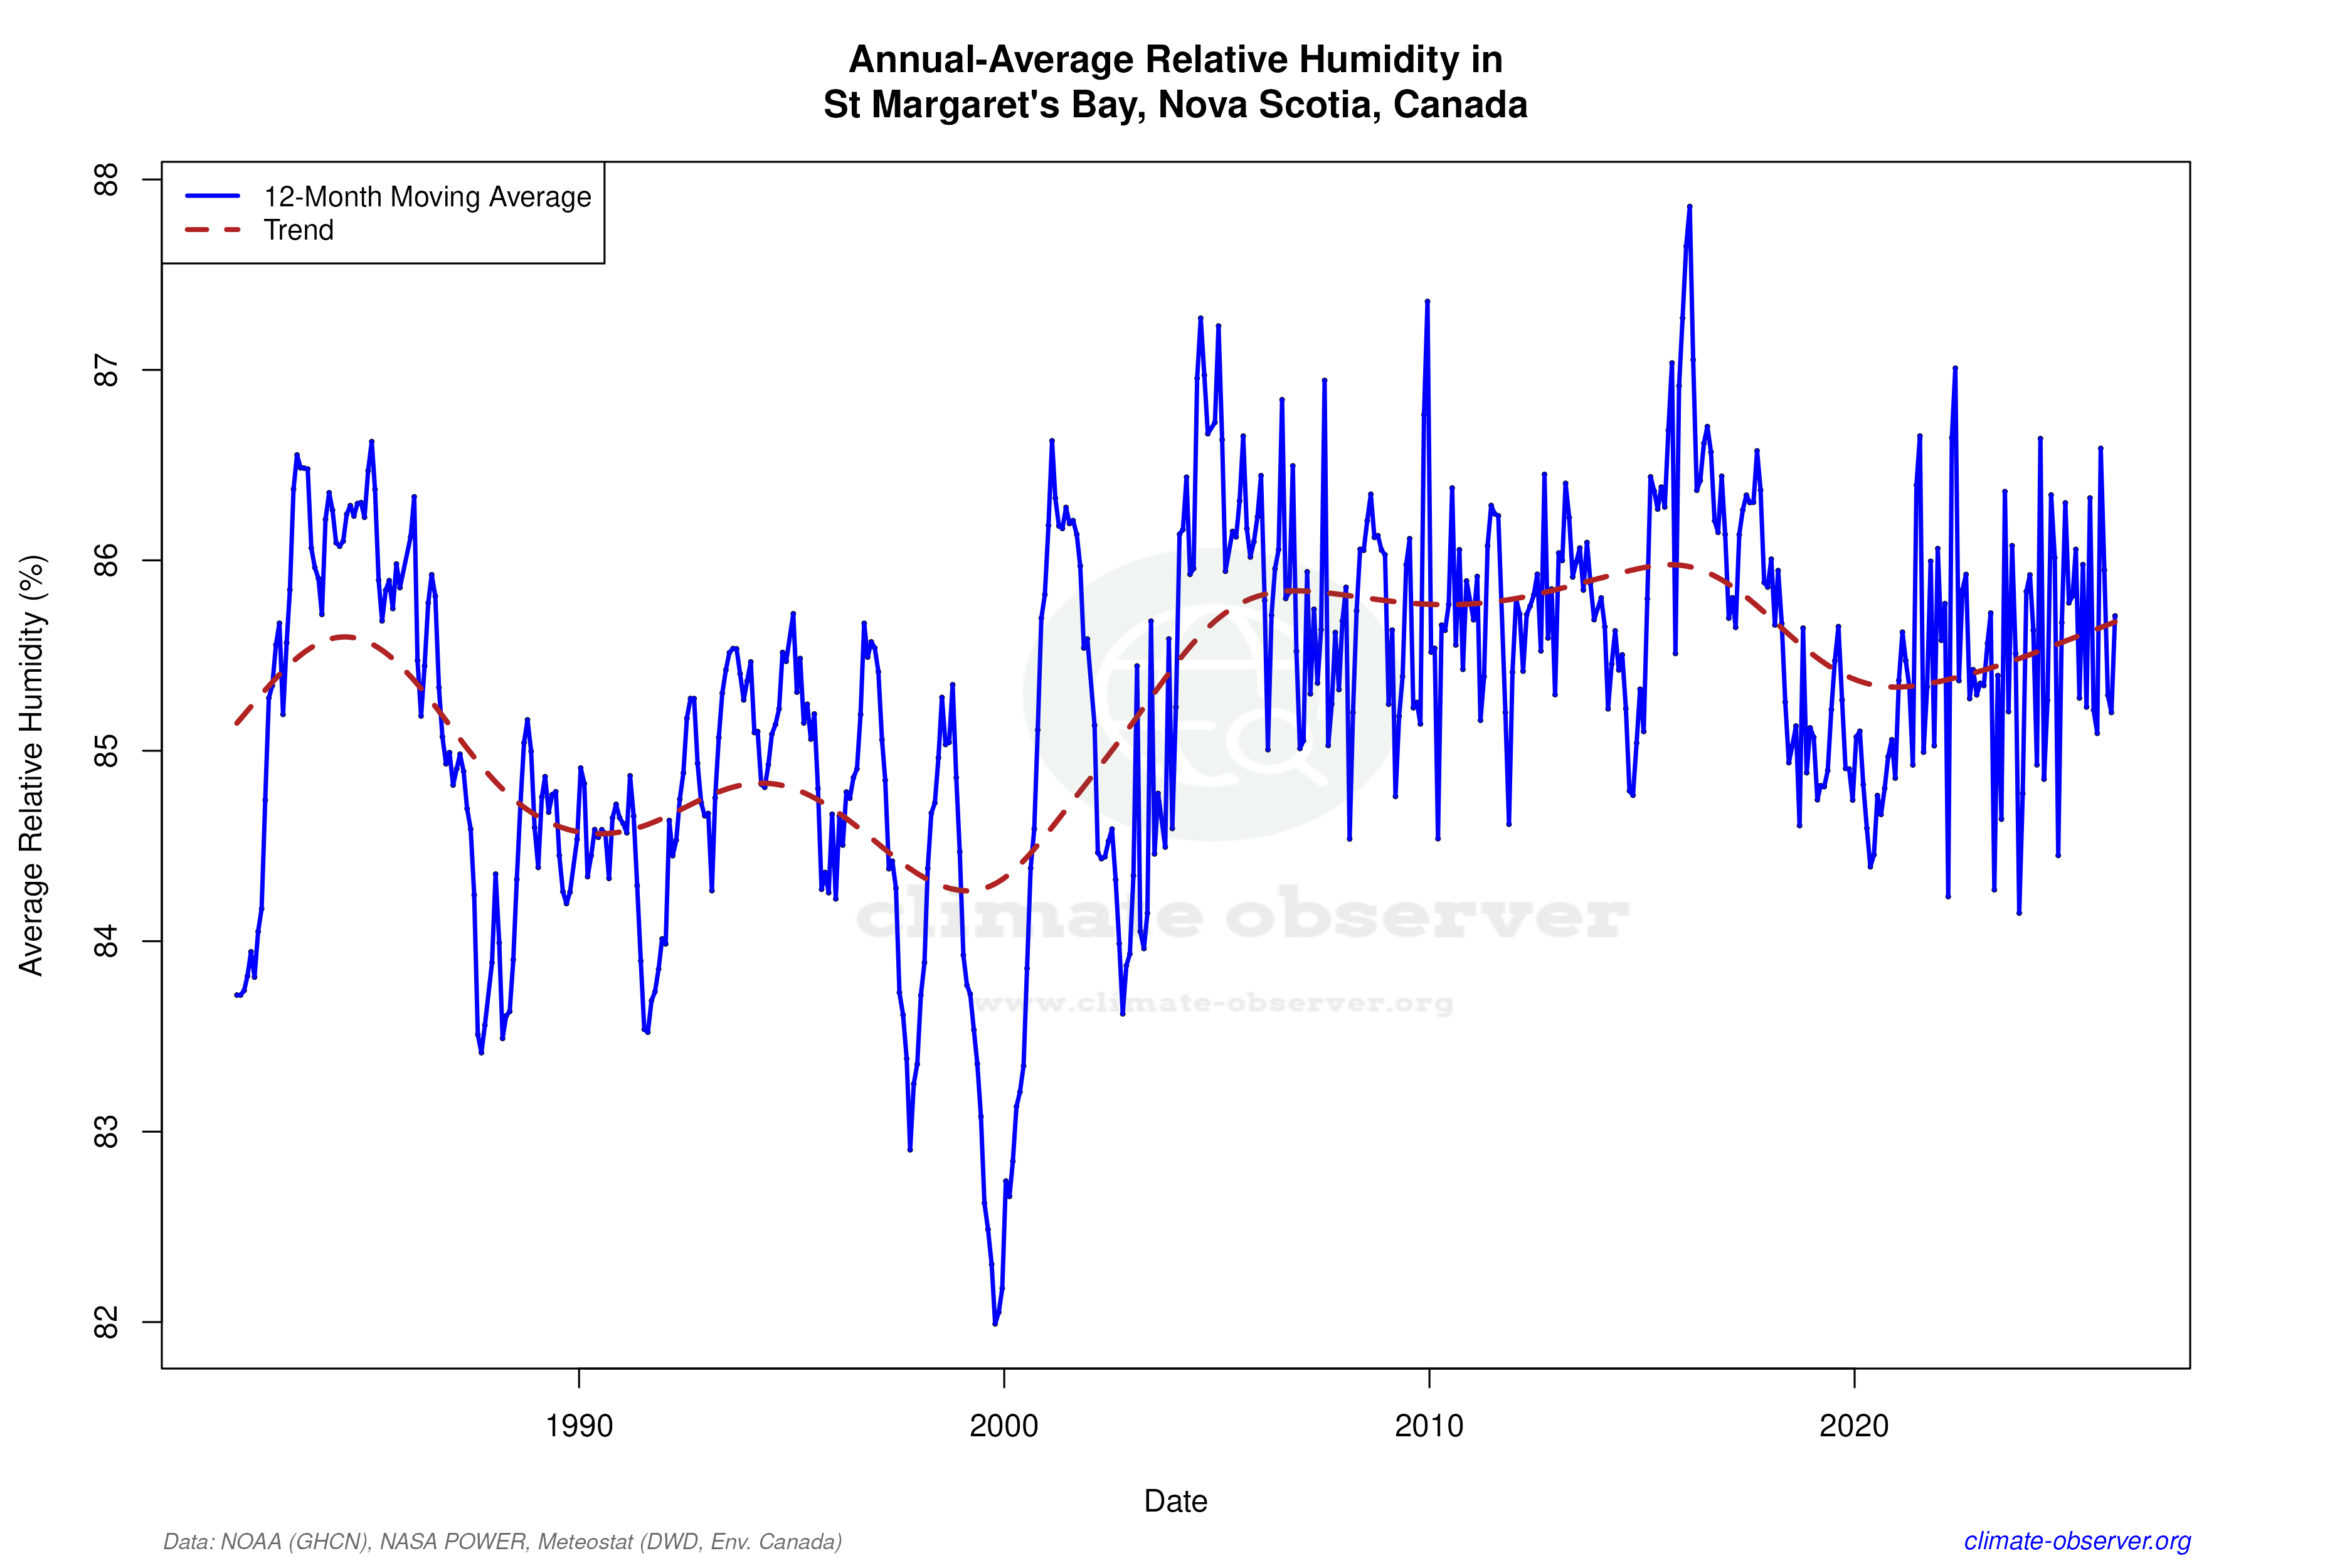

Max Temperature 12-Month MA | 1 of 6
Daily Data Points and Averages Throughout the Year


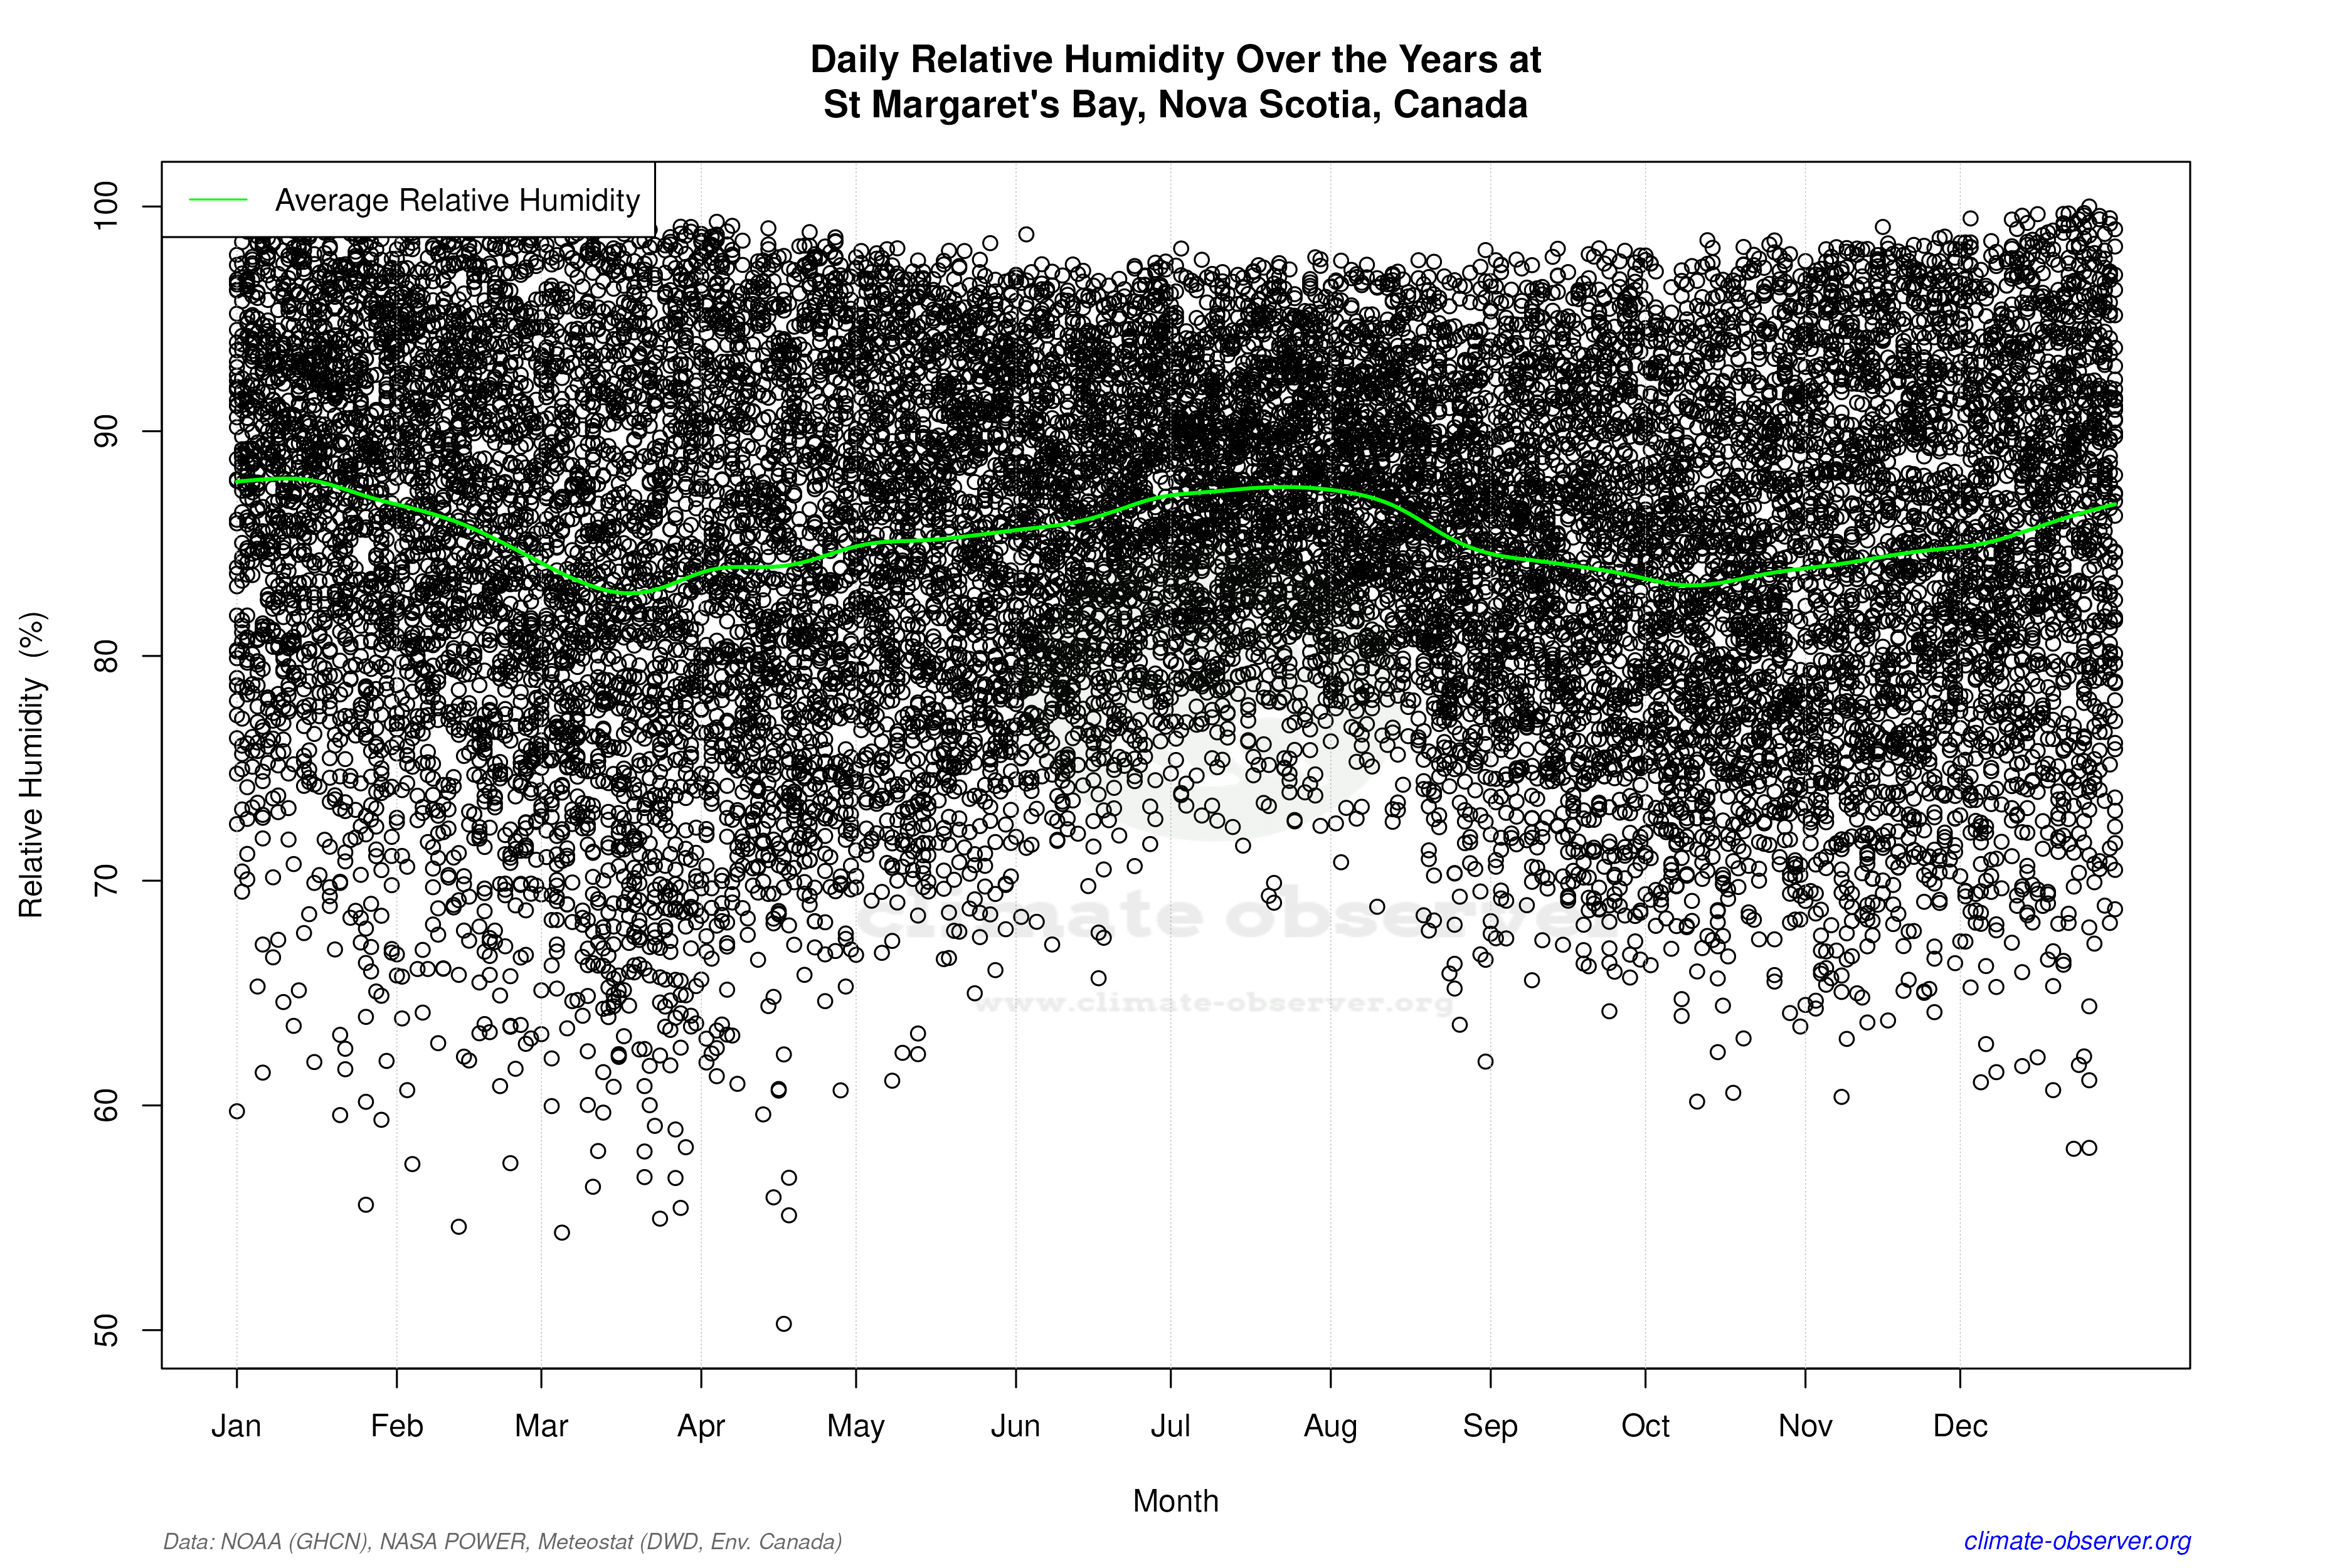

Average Max Temperature Throughout Year | 1 of 5
