Climate for Station: Cartwright, Newfoundland and Labrador, Canada
Loading live weather...
Climate Analysis & Overview
Cartwright, located in the subarctic climate zone of Labrador, Canada, is experiencing a warming trend with significant increases in both high and low temperatures over the past decade. Precipitation has become more evenly distributed, indicating shifts in local weather patterns. These changes align with broader regional climate goals aimed at understanding and mitigating the impacts of global warming.
Subarctic Warming Trends
Cartwright, situated at 53.7167°N, -57.0333°W, falls under the Köppen climate classification of Dfc, indicating a subarctic climate with cold, snowy winters and mild summers. Over the past decade, the area has witnessed a substantial warming trend, with average high temperatures increasing by 3.20°C (5.76°F) and low temperatures rising by 2.96°C (5.33°F). This short-term warming is more pronounced than the all-time trends, which show a rise of 0.18°C (0.32°F) for highs and 0.06°C (0.11°F) for lows. These figures suggest that recent years have experienced accelerated warming, a pattern consistent with global climate change observations.
Temperature Extremes and Records
The temperature extremes in Cartwright highlight the variability inherent in its climate. The record high temperature stands at 36.1°C (97.0°F), while the record low is -37.8°C (-36.0°F). These extremes underscore the broad temperature range typical of subarctic regions, influenced by the area's proximity to the Labrador Sea and its latitude. The warming trend, both in recent years and over the long term, suggests a shift towards milder conditions, which could impact local ecosystems and human activities.
Precipitation Patterns and Distribution
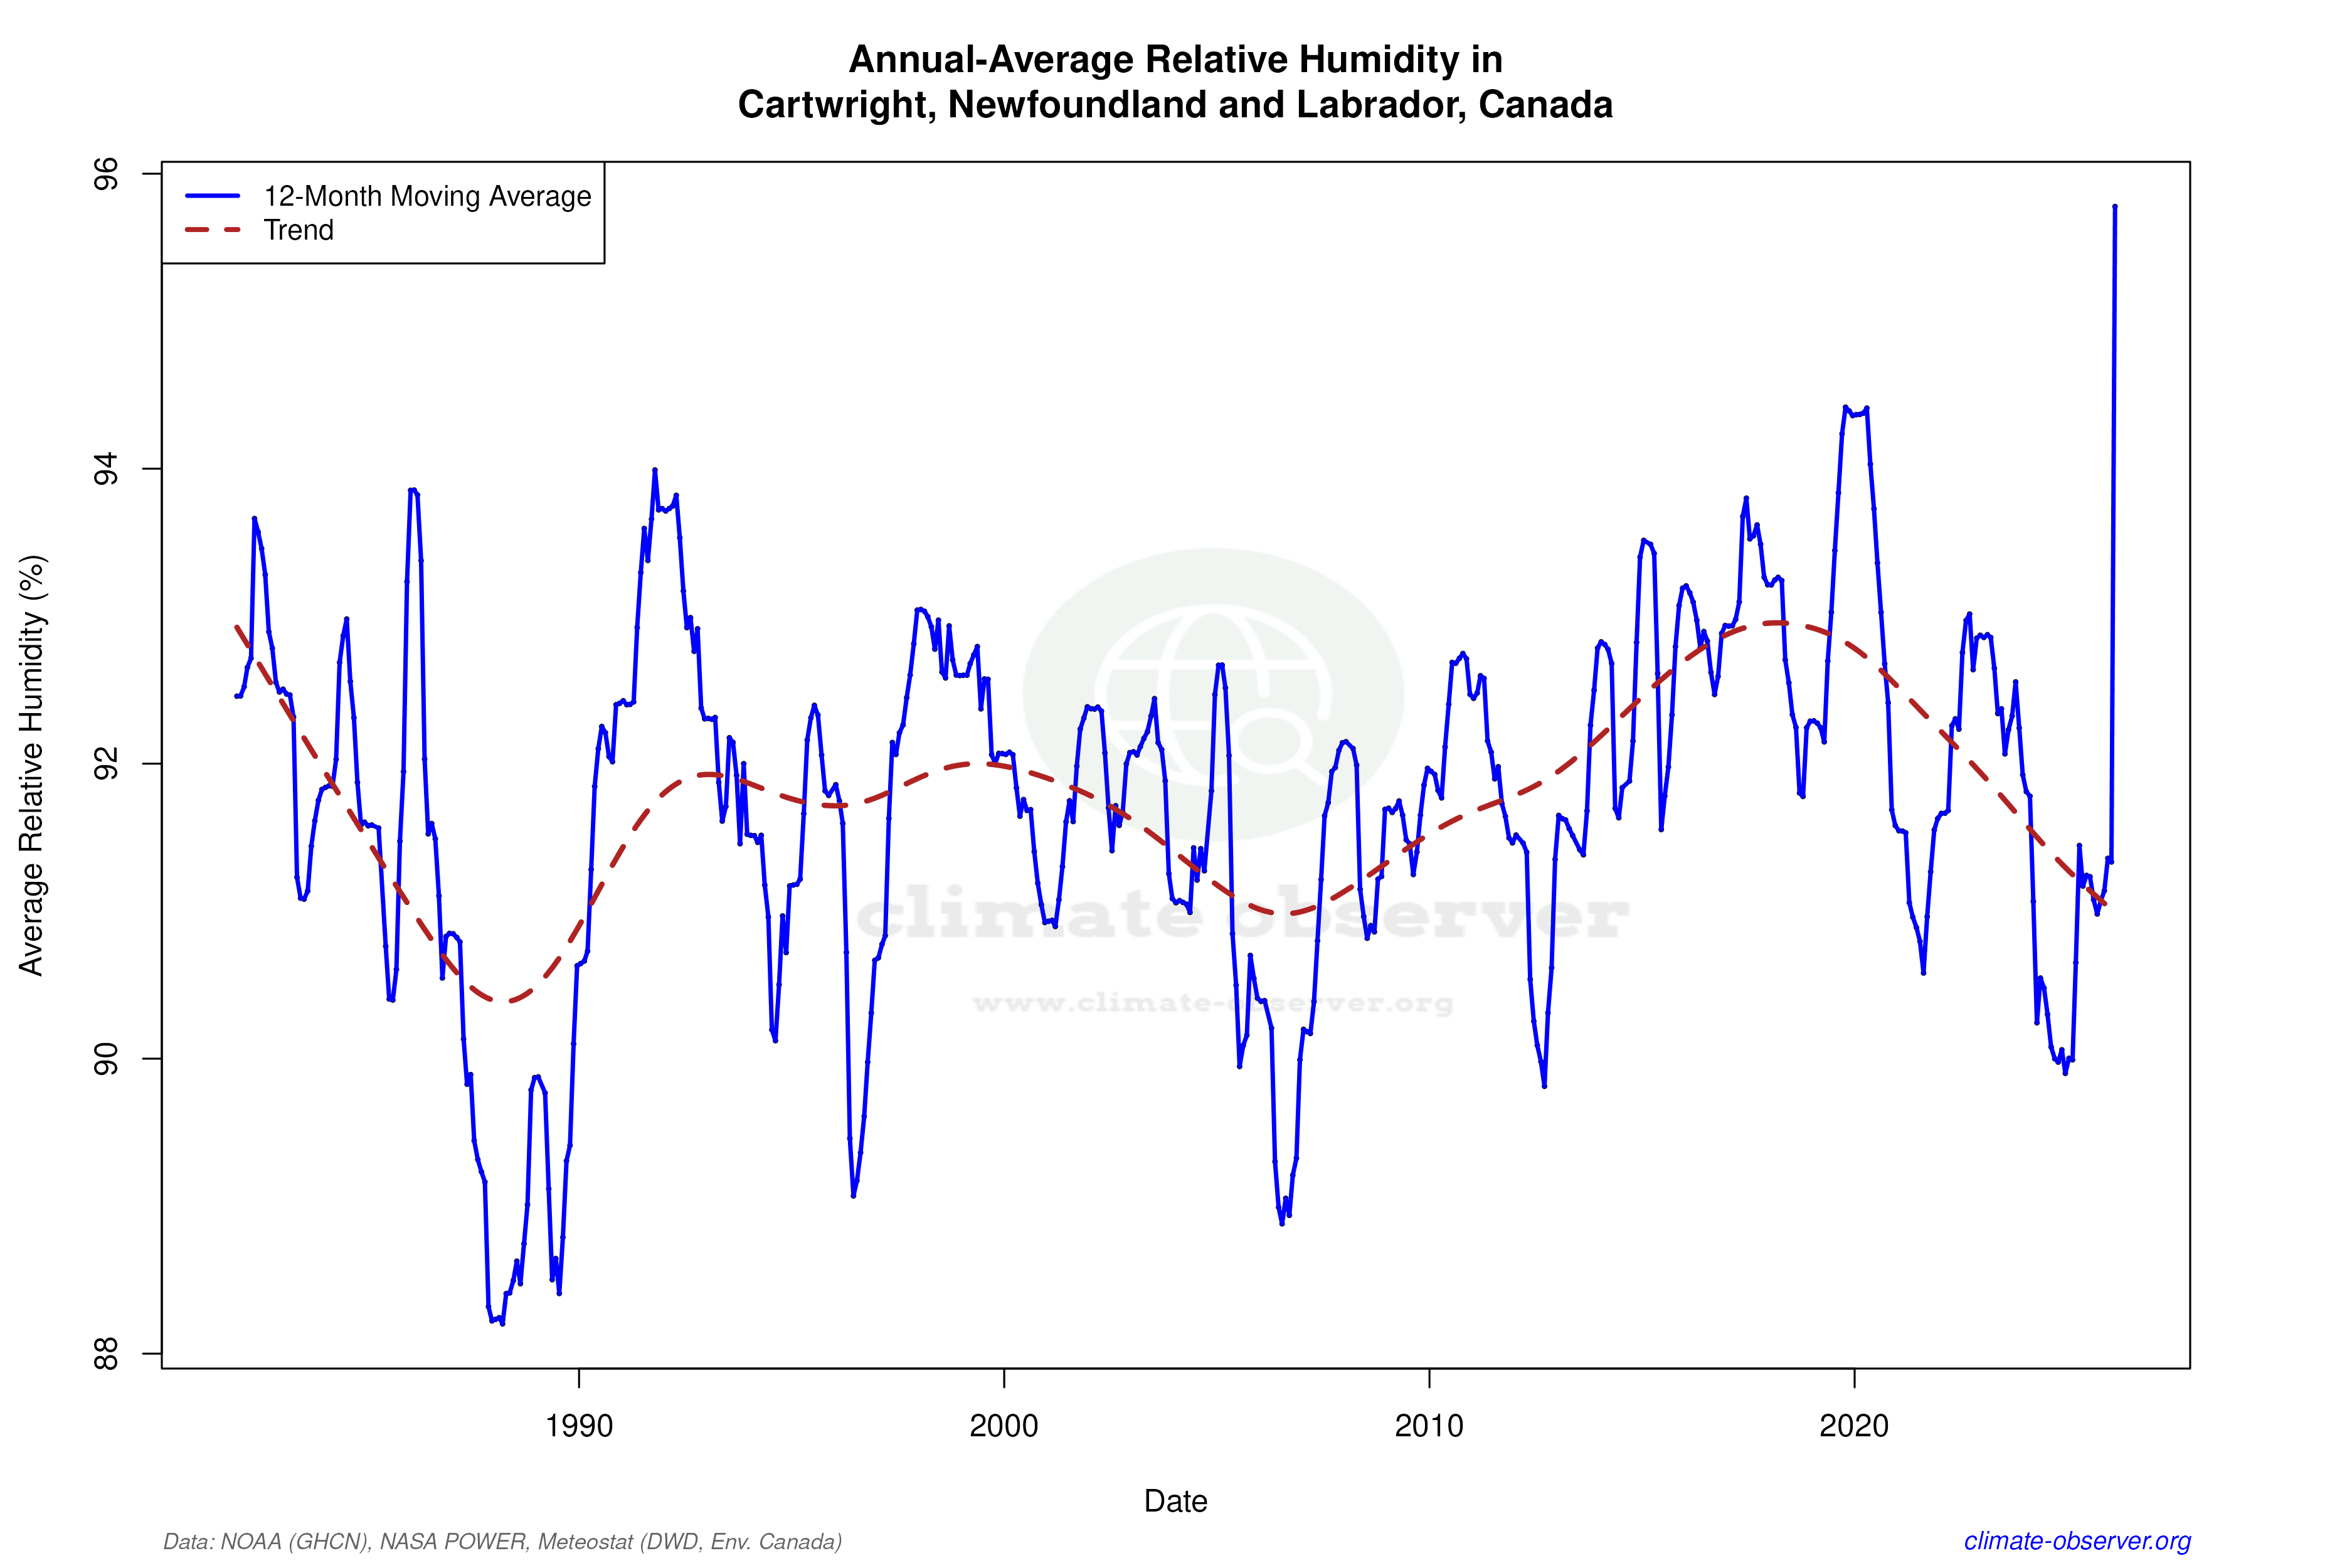
Cartwright's Precipitation Concentration Index (PCI) has decreased from a baseline of 10.39 to a current value of 8.61. The PCI measures how precipitation is distributed over time, with lower values indicating more even distribution. This marginal decrease suggests that precipitation events have become more evenly spread throughout the year, reducing the likelihood of intense, concentrated rainfall. Such a shift could have implications for water resource management and flood risk in the region.
Regional Climate Context
The changes observed in Cartwright are part of a broader regional narrative. Canada's climate goals focus on understanding and adapting to these shifts to mitigate adverse impacts. The warming trends and changes in precipitation distribution align with national efforts to address climate change through research and policy. Recent weather events, such as unseasonably warm winters and altered precipitation patterns, provide a practical backdrop for these scientific observations, illustrating the real-world implications of the data.
Geographical Influences on Climate
Cartwright's climate is shaped by its geographical features, including its location along the Labrador coast. The Labrador Sea plays a crucial role in moderating temperatures, while the surrounding terrain influences local weather patterns. These geographical factors, combined with the observed climatic changes, paint a complex picture of a region in transition, where natural and anthropogenic influences intertwine to shape the future climate landscape.
Station Statistics
10-Year Trend
High: +5.08 °F/decade
Low: +5.22 °F/decade
Rain: -0.031 in/decade
25-Year Trend
High: +0.97 °F/decade
Low: +0.27 °F/decade
Rain: -0.015 in/decade
50-Year Trend
High: +1.20 °F/decade
Low: +0.61 °F/decade
Rain: -0.004 in/decade
All-Time Trend
High: +0.32 °F/decade
Low: +0.11 °F/decade
Rain: +0.000 in/decade
Percentage Above-Average Days
Last 12 Months: 50.4%
This Year: 34.8%
Precipitation Concentration Index (PCI) ℹ️
Last 12 Months: 8.7
Historical Average: 10.3
Percentile Rank of Last 12 Months ℹ️
High: 92nd percentile
Low: 90th percentile
Rain: 57th percentile
Change in Variance ℹ️
High: -0.1%
Low: -4.6%
Intraday: +11.8%
Data Coverage
88.1%
First Year of Data
1934
Station Location
Historical Weather Records
| Max High | Avg High | Min High | Max Avg | Avg Avg | Min Avg | Max Low | Avg Low | Min Low | Max Precipitation | Avg Precipitation | Max Snow | Avg Snow | |
|---|---|---|---|---|---|---|---|---|---|---|---|---|---|
| Record | 96.98 °F | — | -20.02 °F | 78.26 °F | — | -26.70 °F | 66.92 °F | — | -36.04 °F | 3.50 in | — | 35.00 in | — |
| January | 53.24 °F | 16.14 °F | -20.02 °F | 43.88 °F | 8.60 °F | -23.08 °F | 38.48 °F | -0.38 °F | -36.04 °F | 2.19 in | 0.11 in | 24.02 in | 1.03 in |
| February | 55.04 °F | 17.44 °F | -18.58 °F | 48.92 °F | 8.72 °F | -23.44 °F | 41.00 °F | -0.47 °F | -30.10 °F | 2.94 in | 0.11 in | 27.87 in | 1.06 in |
| March | 61.52 °F | 25.85 °F | -5.98 °F | 46.76 °F | 17.33 °F | -14.44 °F | 37.58 °F | 8.01 °F | -25.96 °F | 3.39 in | 0.11 in | 33.90 in | 1.08 in |
| April | 67.46 °F | 35.68 °F | 7.16 °F | 50.54 °F | 28.88 °F | -0.51 °F | 40.28 °F | 20.49 °F | -14.08 °F | 2.09 in | 0.10 in | 20.91 in | 0.74 in |
| May | 88.34 °F | 45.55 °F | 14.00 °F | 66.92 °F | 37.89 °F | 17.24 °F | 53.24 °F | 29.89 °F | 6.98 °F | 1.64 in | 0.09 in | 12.60 in | 0.25 in |
| June | 95.54 °F | 57.21 °F | 32.72 °F | 76.82 °F | 47.35 °F | 30.56 °F | 62.96 °F | 37.95 °F | 21.92 °F | 2.77 in | 0.12 in | 5.39 in | 0.03 in |
| July | 96.98 °F | 65.45 °F | 39.02 °F | 76.28 °F | 54.51 °F | 37.76 °F | 66.92 °F | 44.88 °F | 28.94 °F | 2.23 in | 0.12 in | 0.00 in | 0.00 in |
| August | 95.00 °F | 64.22 °F | 41.90 °F | 78.26 °F | 54.74 °F | 40.10 °F | 66.38 °F | 45.33 °F | 30.92 °F | 2.35 in | 0.12 in | 0.00 in | 0.00 in |
| September | 86.00 °F | 55.94 °F | 37.04 °F | 70.88 °F | 47.93 °F | 34.16 °F | 61.70 °F | 40.00 °F | 23.00 °F | 2.63 in | 0.12 in | 5.83 in | 0.01 in |
| October | 73.94 °F | 44.53 °F | 24.08 °F | 64.04 °F | 39.01 °F | 17.78 °F | 56.48 °F | 32.59 °F | 10.94 °F | 2.32 in | 0.11 in | 13.31 in | 0.15 in |
| November | 63.68 °F | 34.02 °F | 1.94 °F | 53.42 °F | 28.99 °F | 4.82 °F | 48.92 °F | 23.05 °F | -5.98 °F | 2.47 in | 0.11 in | 15.00 in | 0.59 in |
| December | 55.94 °F | 23.21 °F | -19.48 °F | 51.26 °F | 16.99 °F | -26.70 °F | 44.78 °F | 9.48 °F | -35.32 °F | 3.50 in | 0.10 in | 35.00 in | 0.91 in |
Data Visualisations
Remove WatermarksCurrent Year Climate Trends vs Historical


Max Temperature this Year | 1 of 6
Climate 12-Month Moving Averages


Max Temperature 12-Month MA | 1 of 6
Daily Data Points and Averages Throughout the Year


Average Max Temperature Throughout Year | 1 of 5
