Climate for Station: Pointe Noire, Pointe-Noire, Congo (Brazzaville)
Loading live weather...
Climate Analysis & Overview
Pointe Noire is experiencing a nuanced climate evolution with a long-term warming trend in highs and lows, juxtaposed against a recent cooling in lows over the past decade. Precipitation patterns have shifted towards a more even distribution, indicating changes in rainfall dynamics.
Tropical Climate Dynamics
Pointe Noire, situated at coordinates -4.82, 11.9, is characterised by a tropical wet and dry climate, classified as Aw in the Köppen system. This coastal city benefits from its proximity to the Atlantic Ocean, which moderates temperatures and influences its precipitation patterns. The all-time temperature trends reveal a warming of 0.15°C (0.27°F) in highs and 0.27°C (0.49°F) in lows, suggesting a gradual rise in overall temperature. However, the past decade shows a cooling trend in lows by 0.35°C (0.63°F), indicating more complex short-term variability.
Temperature Extremes and Variability
Temperature records in Pointe Noire highlight the region's thermal limits, with a maximum of 36.0°C (96.8°F) and a minimum of 10.0°C (50.0°F). These extremes showcase the city's capacity for significant thermal variation despite its generally stable tropical climate. The recent 10-year trend of a 0.03°C (0.05°F) decrease in highs suggests a slight cooling, contrasting with the long-term warming trend. This interplay between short-term cooling and long-term warming is critical for understanding local climate dynamics.
Precipitation Patterns and Distribution
The Precipitation Concentration Index (PCI) has shifted from a baseline of 16.6 to a current value of 13.5, indicating a more even distribution of rainfall events. This change suggests that precipitation is becoming less concentrated in intense events and more spread out over time. Such a shift can have significant implications for water resource management and agricultural planning in the region, as more evenly distributed rainfall can mitigate the risk of flooding and drought.
Regional Climate Goals and Implications
The Congo (Brazzaville) has been proactive in addressing climate change, with regional goals aimed at sustainable development and environmental conservation. The observed climatic trends in Pointe Noire align with broader regional efforts to adapt to and mitigate the impacts of climate change. The nuanced temperature trends and changes in precipitation distribution underscore the importance of continued monitoring and adaptation strategies to ensure resilience against climate variability.
Complex Interactions and Future Outlook
The climate profile of Pointe Noire is marked by a complex interplay of warming trends and recent cooling in lows, alongside evolving precipitation patterns. These changes reflect broader regional climatic shifts and highlight the need for ongoing research and adaptive management strategies. As the climate continues to evolve, understanding these dynamics will be crucial for informed decision-making and sustainable development in the region.
Station Statistics
10-Year Trend
High: -0.05 °F/decade
Low: -0.43 °F/decade
Rain: -0.005 in/decade
25-Year Trend
High: +0.99 °F/decade
Low: -0.41 °F/decade
Rain: +0.013 in/decade
50-Year Trend
High: +0.88 °F/decade
Low: +0.26 °F/decade
Rain: +0.001 in/decade
All-Time Trend
High: +0.27 °F/decade
Low: +0.48 °F/decade
Rain: +0.001 in/decade
Percentage Above-Average Days
Last 12 Months: 56.6%
This Year: 64.4%
Precipitation Concentration Index (PCI) ℹ️
Last 12 Months: 14.0
Historical Average: 16.3
Percentile Rank of Last 12 Months ℹ️
High: 79th percentile
Low: 61st percentile
Rain: 43rd percentile
Change in Variance ℹ️
High: -24.8%
Low: -34.9%
Intraday: -41.4%
Data Coverage
89.0%
First Year of Data
1947
Station Location
Historical Weather Records
| Max High | Avg High | Min High | Max Avg | Avg Avg | Min Avg | Max Low | Avg Low | Min Low | Max Precipitation | Avg Precipitation | Max Snow | Avg Snow | |
|---|---|---|---|---|---|---|---|---|---|---|---|---|---|
| Record | 96.80 °F | — | 69.58 °F | 86.72 °F | — | 62.60 °F | 82.54 °F | — | 50.00 °F | 9.50 in | — | — | — |
| January | 95.00 °F | 85.00 °F | 76.37 °F | 85.28 °F | 80.16 °F | 70.88 °F | 82.40 °F | 74.74 °F | 66.38 °F | 6.54 in | 0.22 in | — | — |
| February | 94.64 °F | 86.30 °F | 77.72 °F | 86.36 °F | 81.14 °F | 70.88 °F | 82.20 °F | 75.13 °F | 63.32 °F | 7.87 in | 0.30 in | — | — |
| March | 94.64 °F | 86.88 °F | 77.76 °F | 86.54 °F | 81.57 °F | 71.42 °F | 82.54 °F | 75.57 °F | 66.56 °F | 9.50 in | 0.26 in | — | — |
| April | 96.80 °F | 86.30 °F | 76.64 °F | 86.72 °F | 81.18 °F | 74.12 °F | 81.68 °F | 75.49 °F | 66.20 °F | 6.17 in | 0.20 in | — | — |
| May | 96.26 °F | 84.03 °F | 75.24 °F | 85.64 °F | 79.32 °F | 71.96 °F | 80.60 °F | 74.01 °F | 63.50 °F | 4.74 in | 0.10 in | — | — |
| June | 90.50 °F | 80.03 °F | 71.22 °F | 81.86 °F | 75.19 °F | 68.00 °F | 77.72 °F | 69.06 °F | 52.16 °F | 3.32 in | 0.00 in | — | — |
| July | 87.80 °F | 77.40 °F | 69.76 °F | 78.80 °F | 72.52 °F | 62.60 °F | 74.70 °F | 66.28 °F | 50.00 °F | 1.17 in | 0.00 in | — | — |
| August | 86.72 °F | 77.46 °F | 69.58 °F | 78.26 °F | 72.78 °F | 66.92 °F | 74.14 °F | 67.17 °F | 54.32 °F | 0.59 in | 0.00 in | — | — |
| September | 89.96 °F | 79.67 °F | 72.32 °F | 81.32 °F | 75.31 °F | 68.36 °F | 76.64 °F | 70.61 °F | 59.00 °F | 3.10 in | 0.02 in | — | — |
| October | 89.60 °F | 82.39 °F | 75.20 °F | 82.22 °F | 78.19 °F | 71.24 °F | 78.80 °F | 73.99 °F | 65.48 °F | 6.19 in | 0.10 in | — | — |
| November | 93.92 °F | 83.55 °F | 74.97 °F | 84.56 °F | 79.21 °F | 71.78 °F | 80.60 °F | 74.62 °F | 66.20 °F | 7.05 in | 0.28 in | — | — |
| December | 92.84 °F | 83.93 °F | 74.95 °F | 84.02 °F | 79.35 °F | 72.14 °F | 80.71 °F | 74.43 °F | 66.92 °F | 6.12 in | 0.20 in | — | — |
Data Visualisations
Remove WatermarksCurrent Year Climate Trends vs Historical


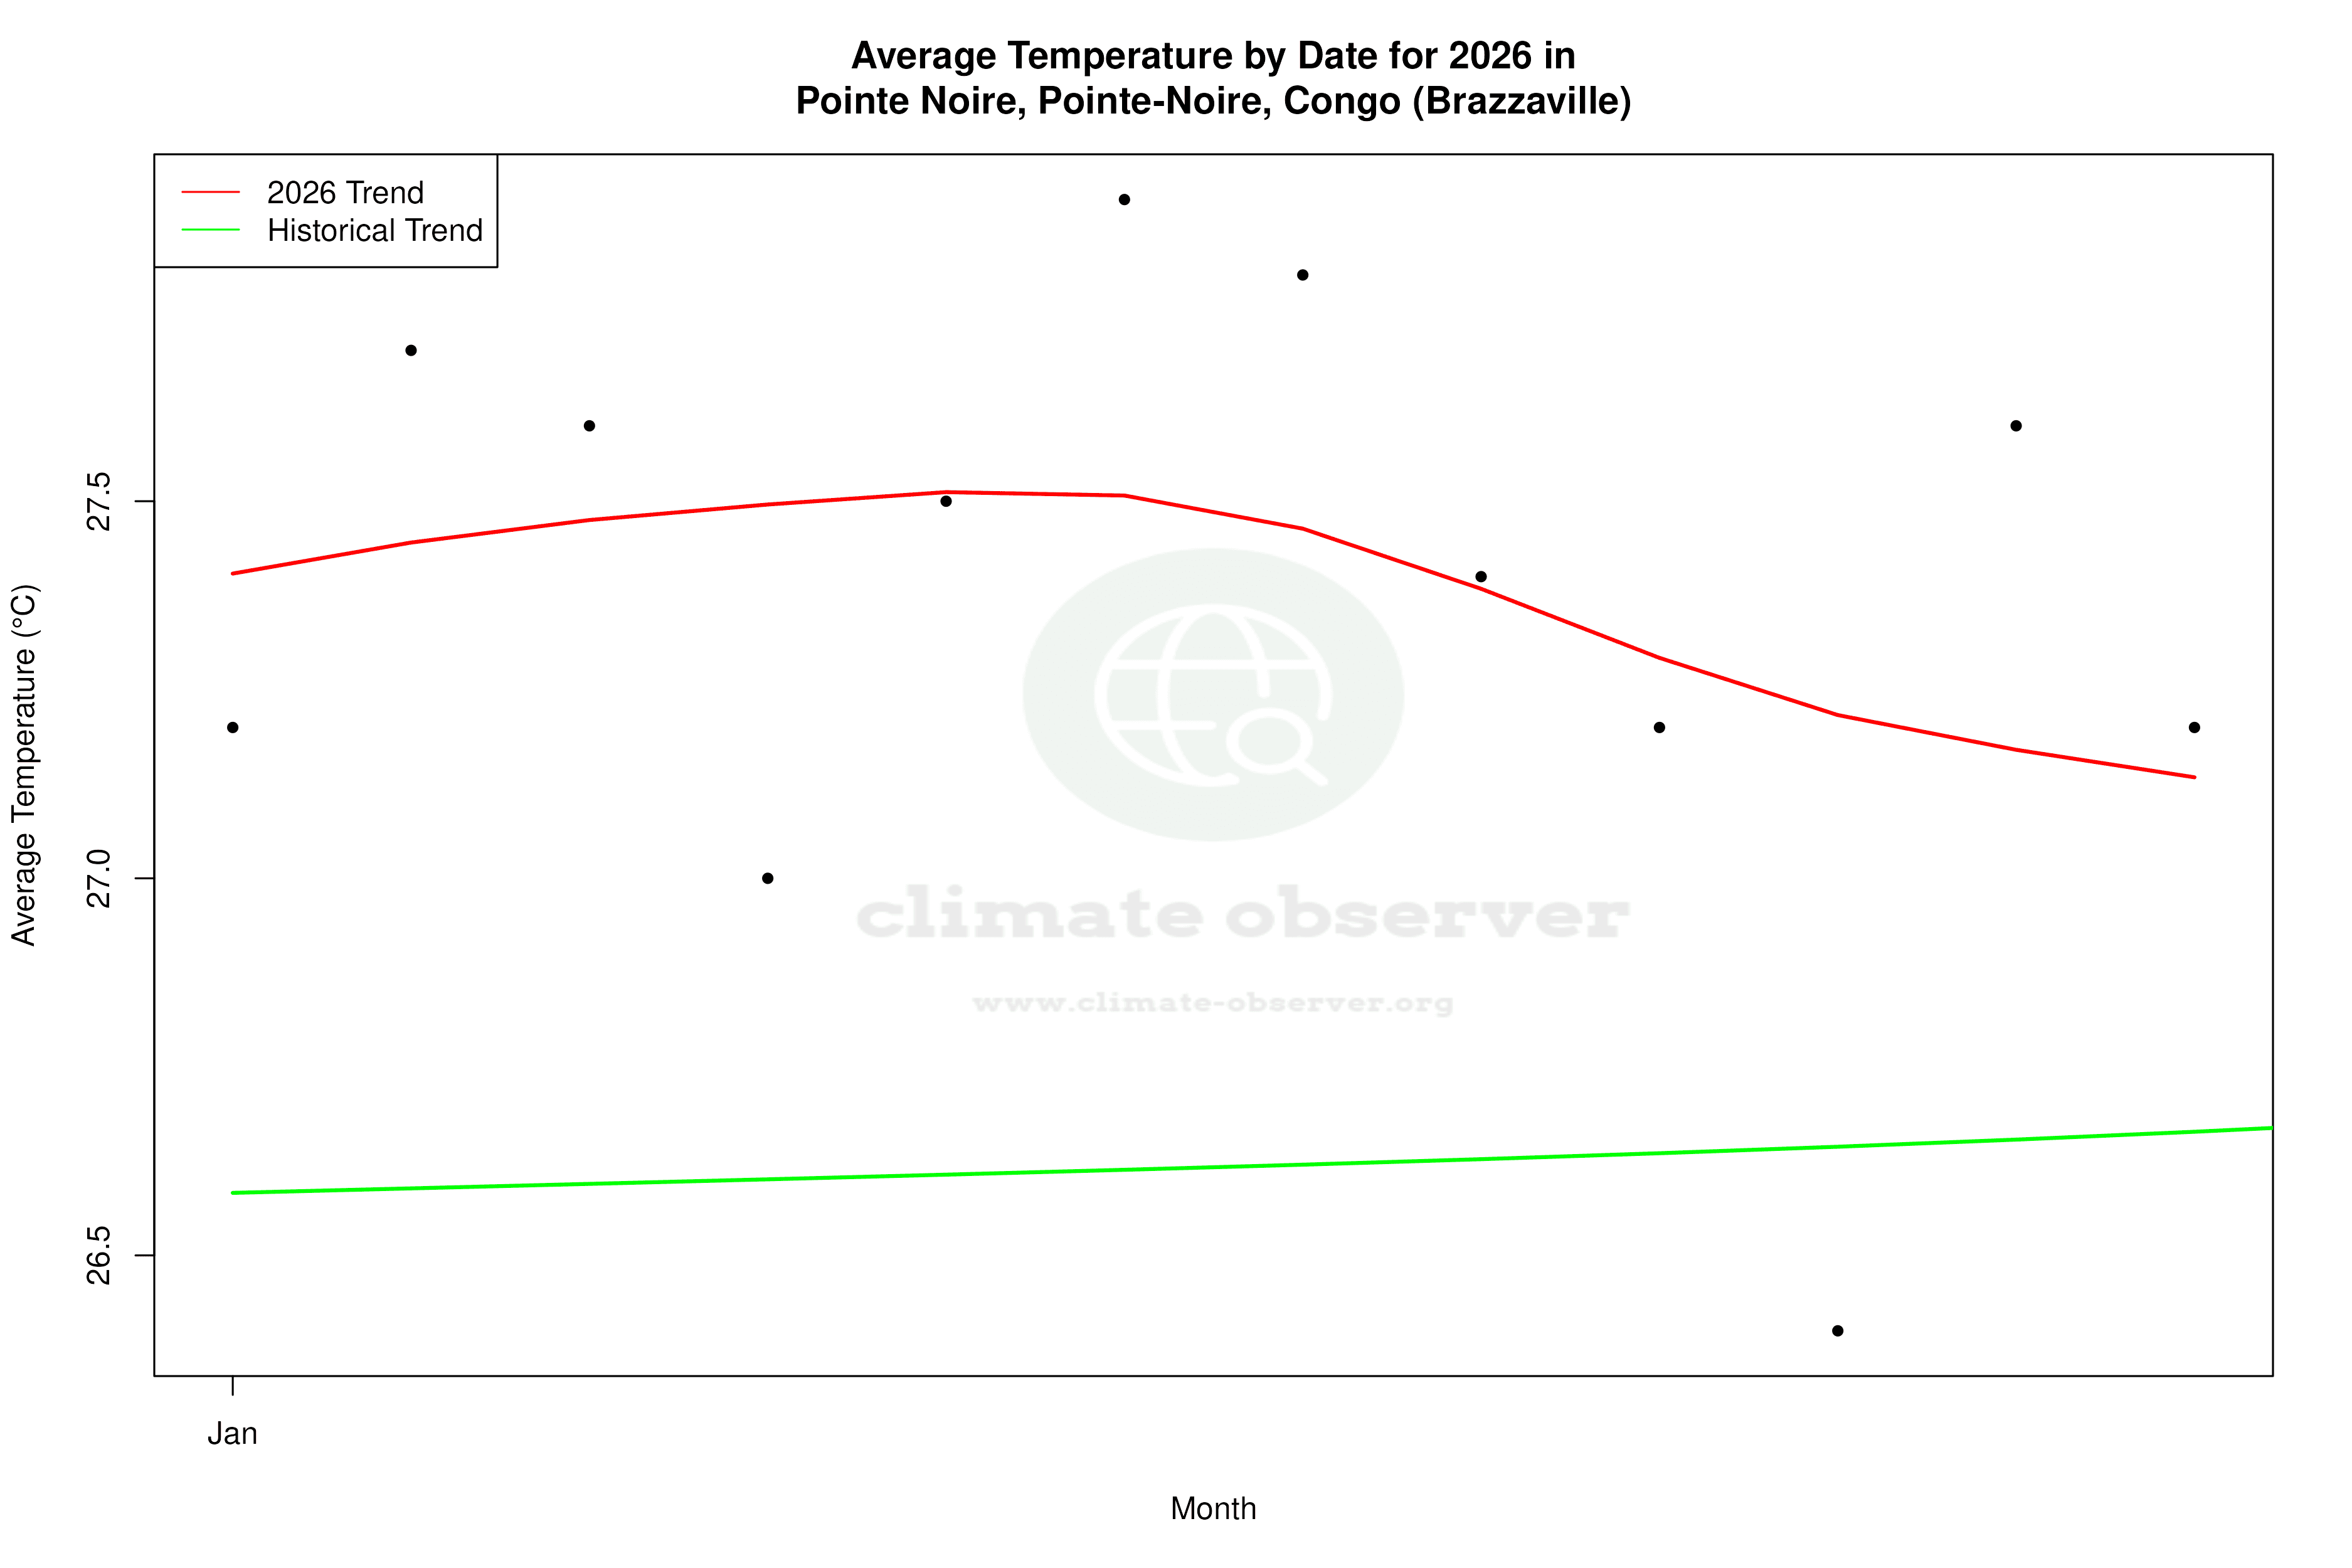


Max Temperature this Year | 1 of 6
Climate 12-Month Moving Averages


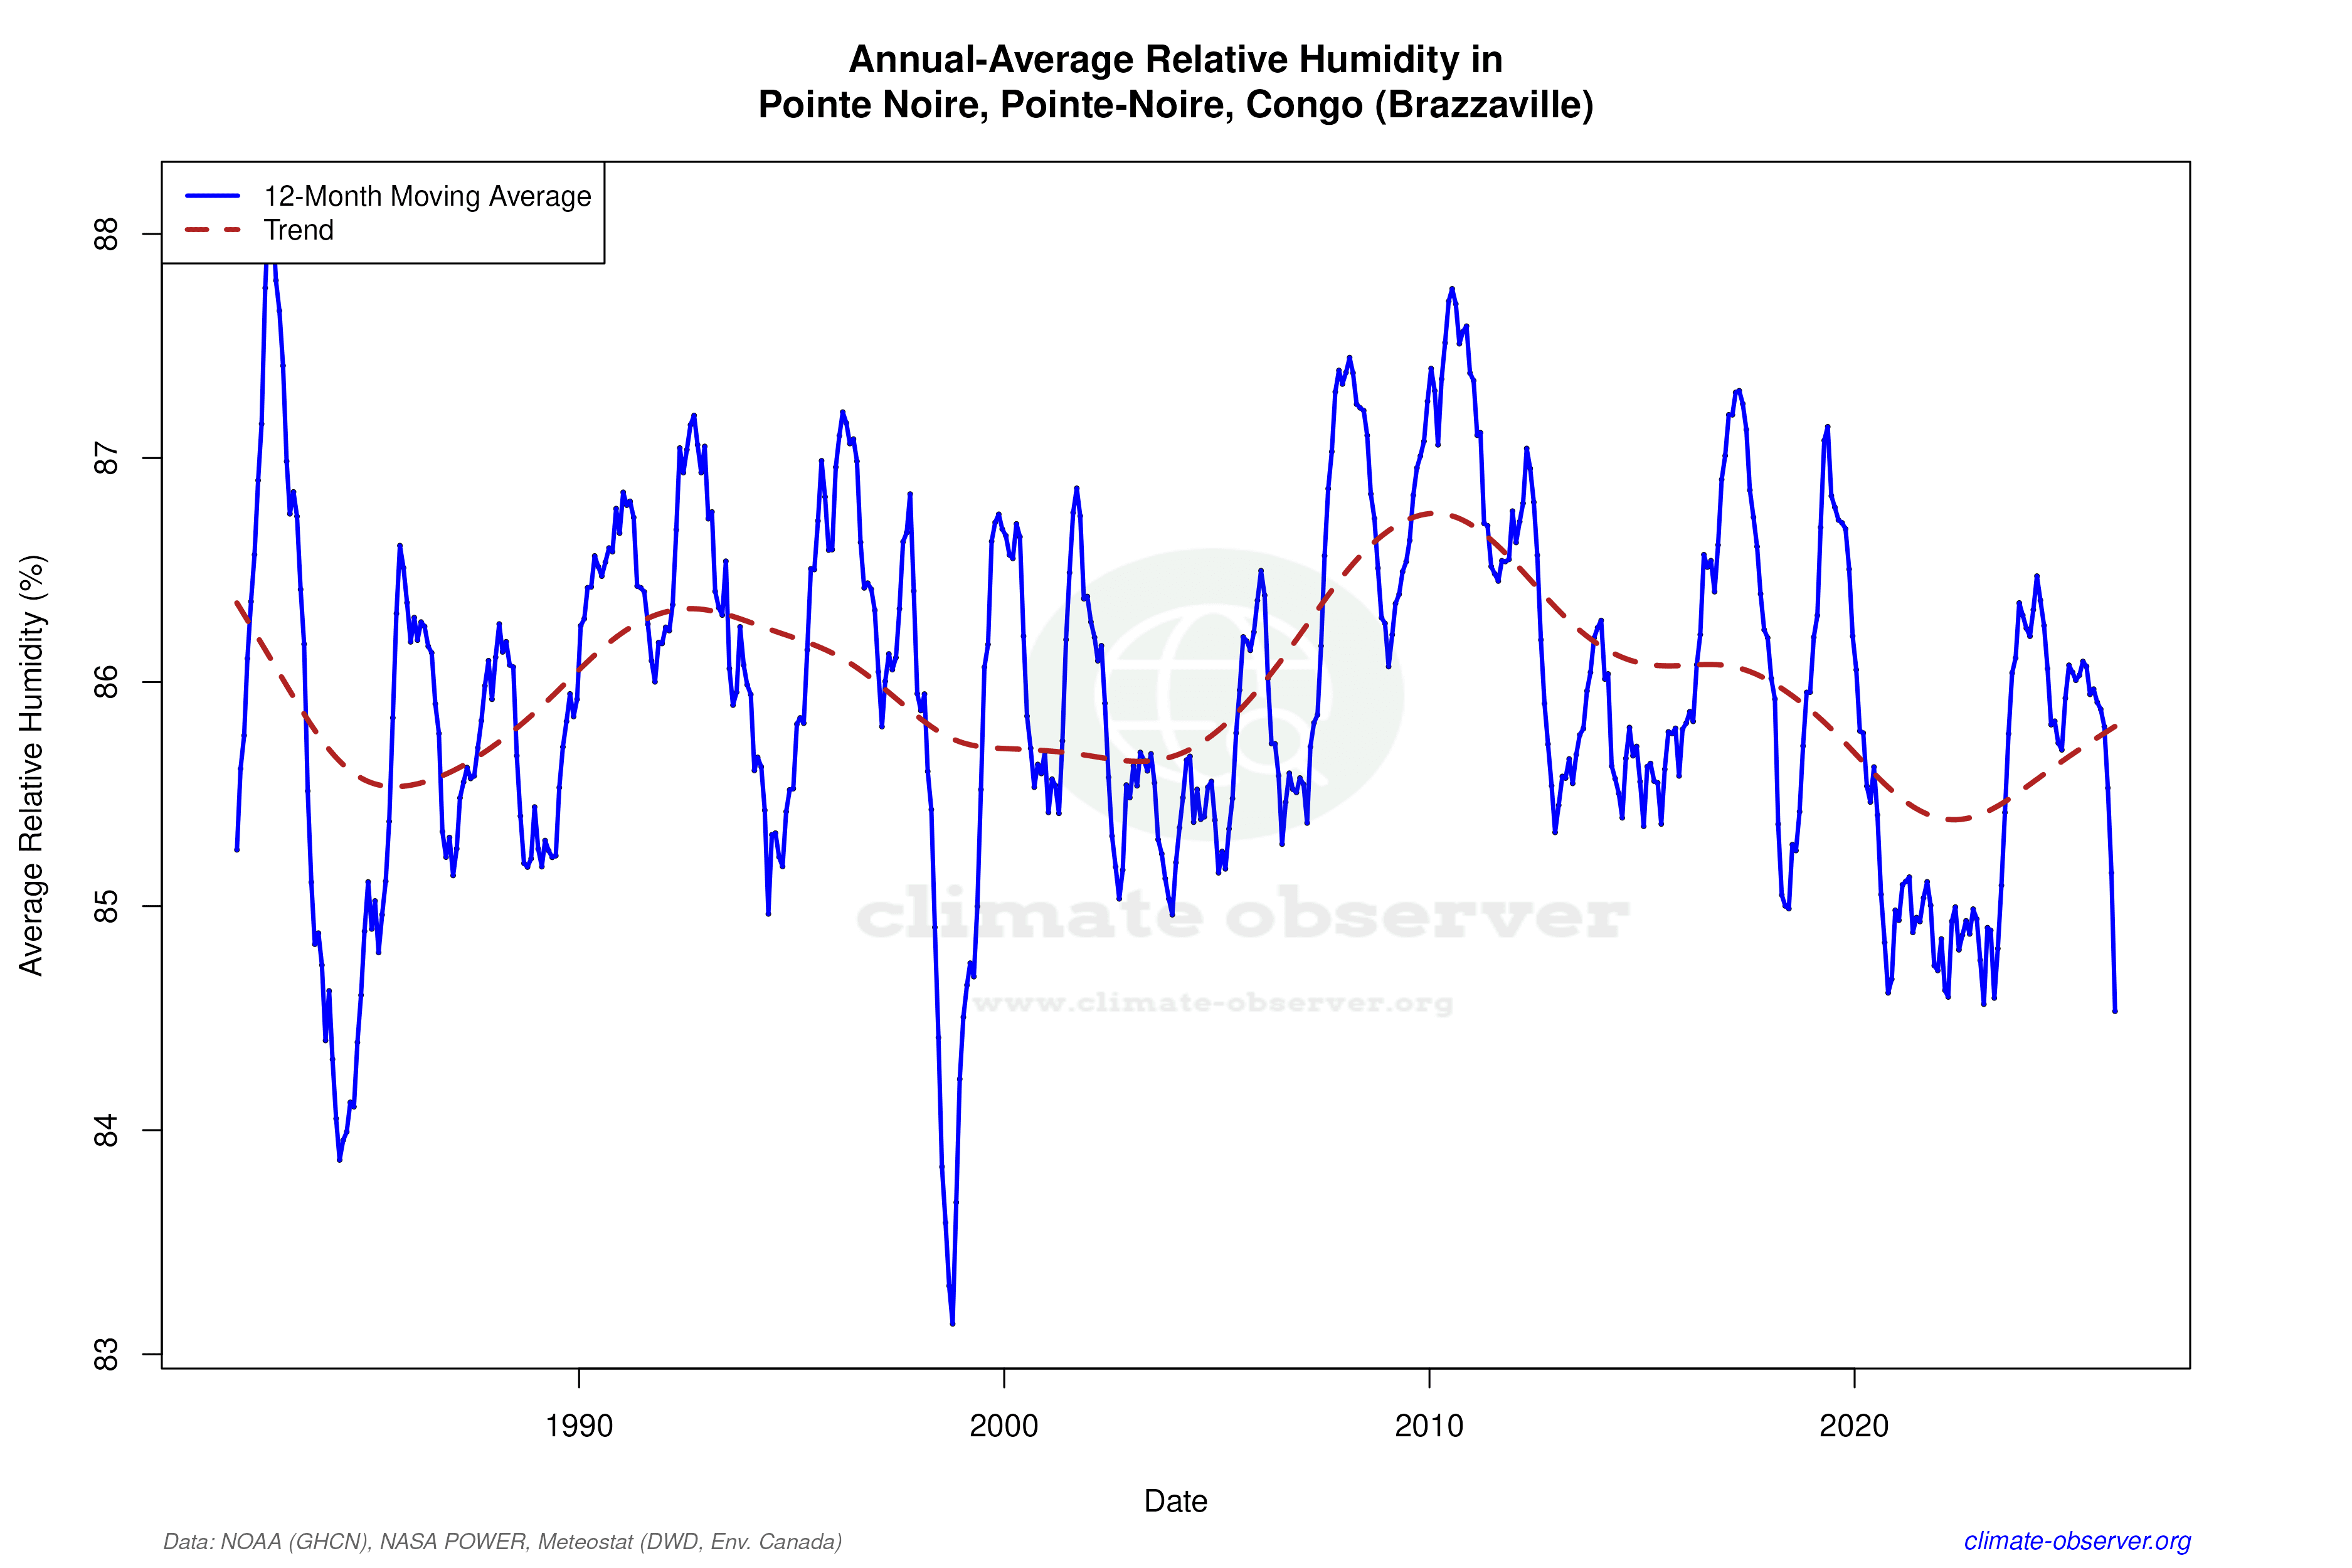

Max Temperature 12-Month MA | 1 of 6
Daily Data Points and Averages Throughout the Year
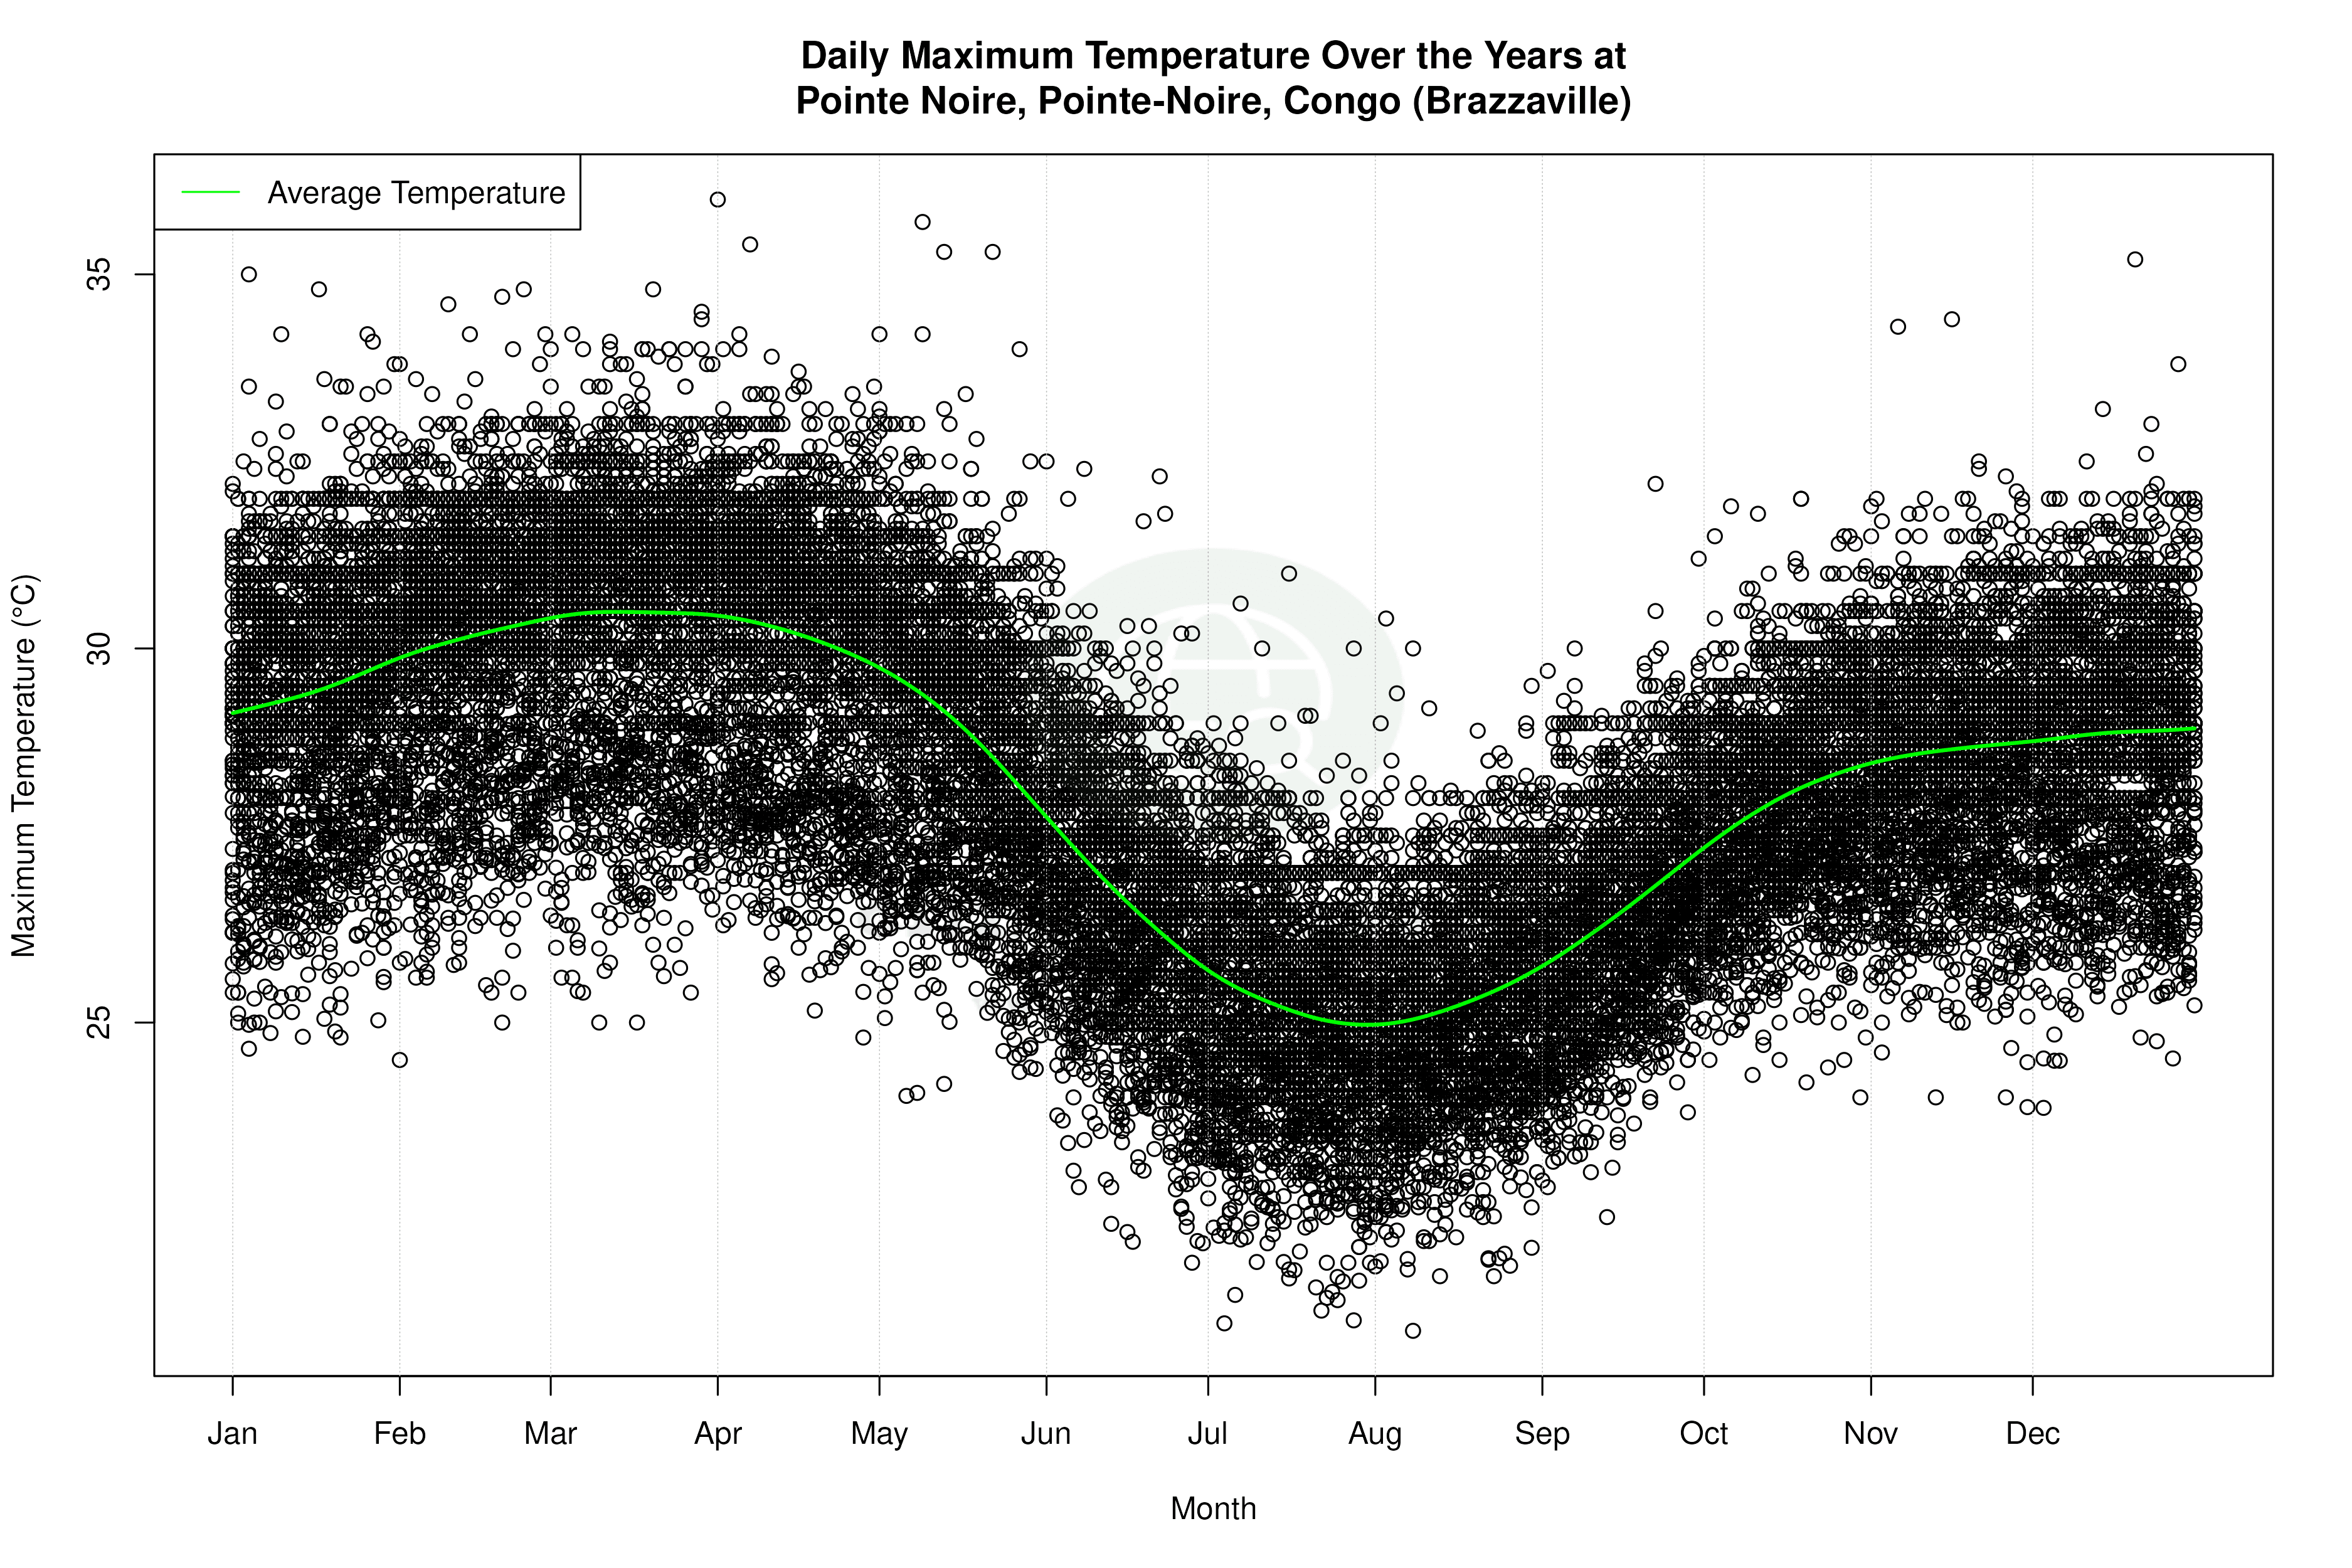


Average Max Temperature Throughout Year | 1 of 5
