Climate for Station: Ouesso, Sangha, Congo (Brazzaville)
Loading live weather...
Climate Analysis & Overview
Ouesso is experiencing a complex climate narrative with a slight warming trend in all-time lows and a cooling trend in recent highs. This duality reflects nuanced climatic shifts in the region, underscored by a marginal increase in precipitation concentration, suggesting more intense rainfall events.
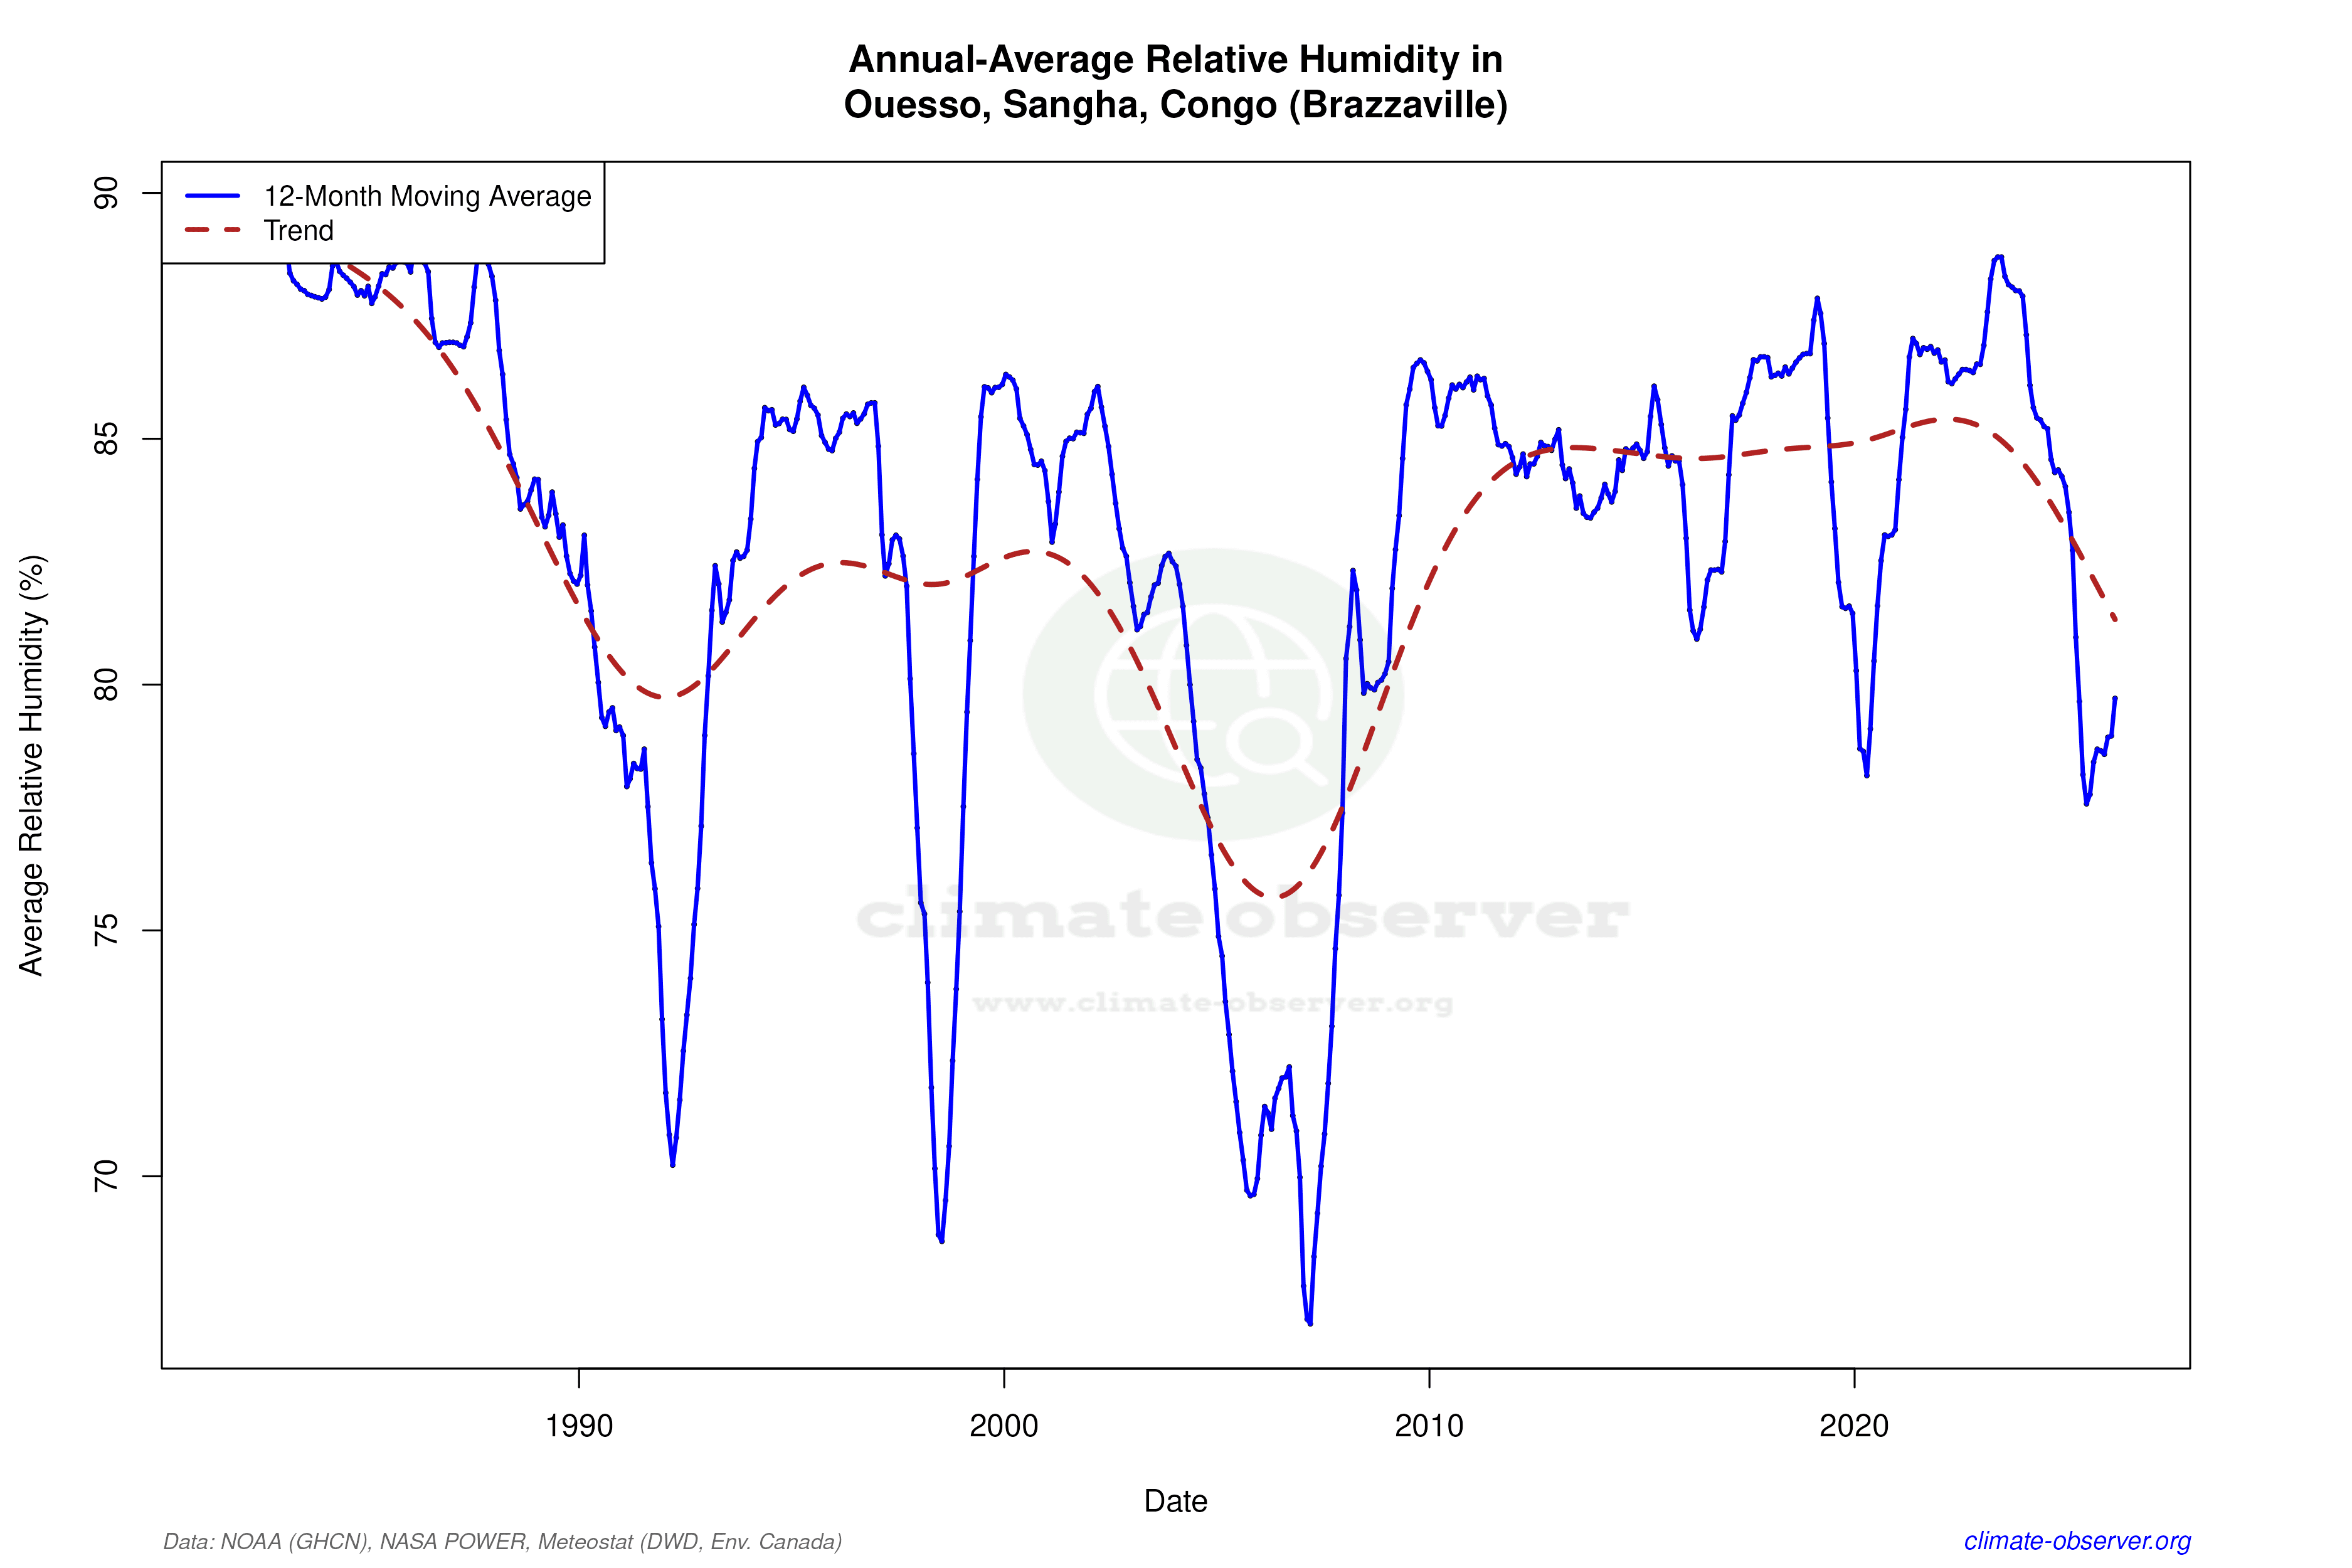
Equatorial Climate Dynamics
Ouesso, located in the Sangha region of the Republic of the Congo, is characterised by an Af climate under the Köppen classification, indicating a tropical rainforest climate. This region, influenced by the proximity of the Congo River and dense forest cover, typically exhibits high humidity and substantial rainfall throughout the year. The geographical features contribute to the area's consistent thermal and precipitation patterns, albeit with some recent shifts.
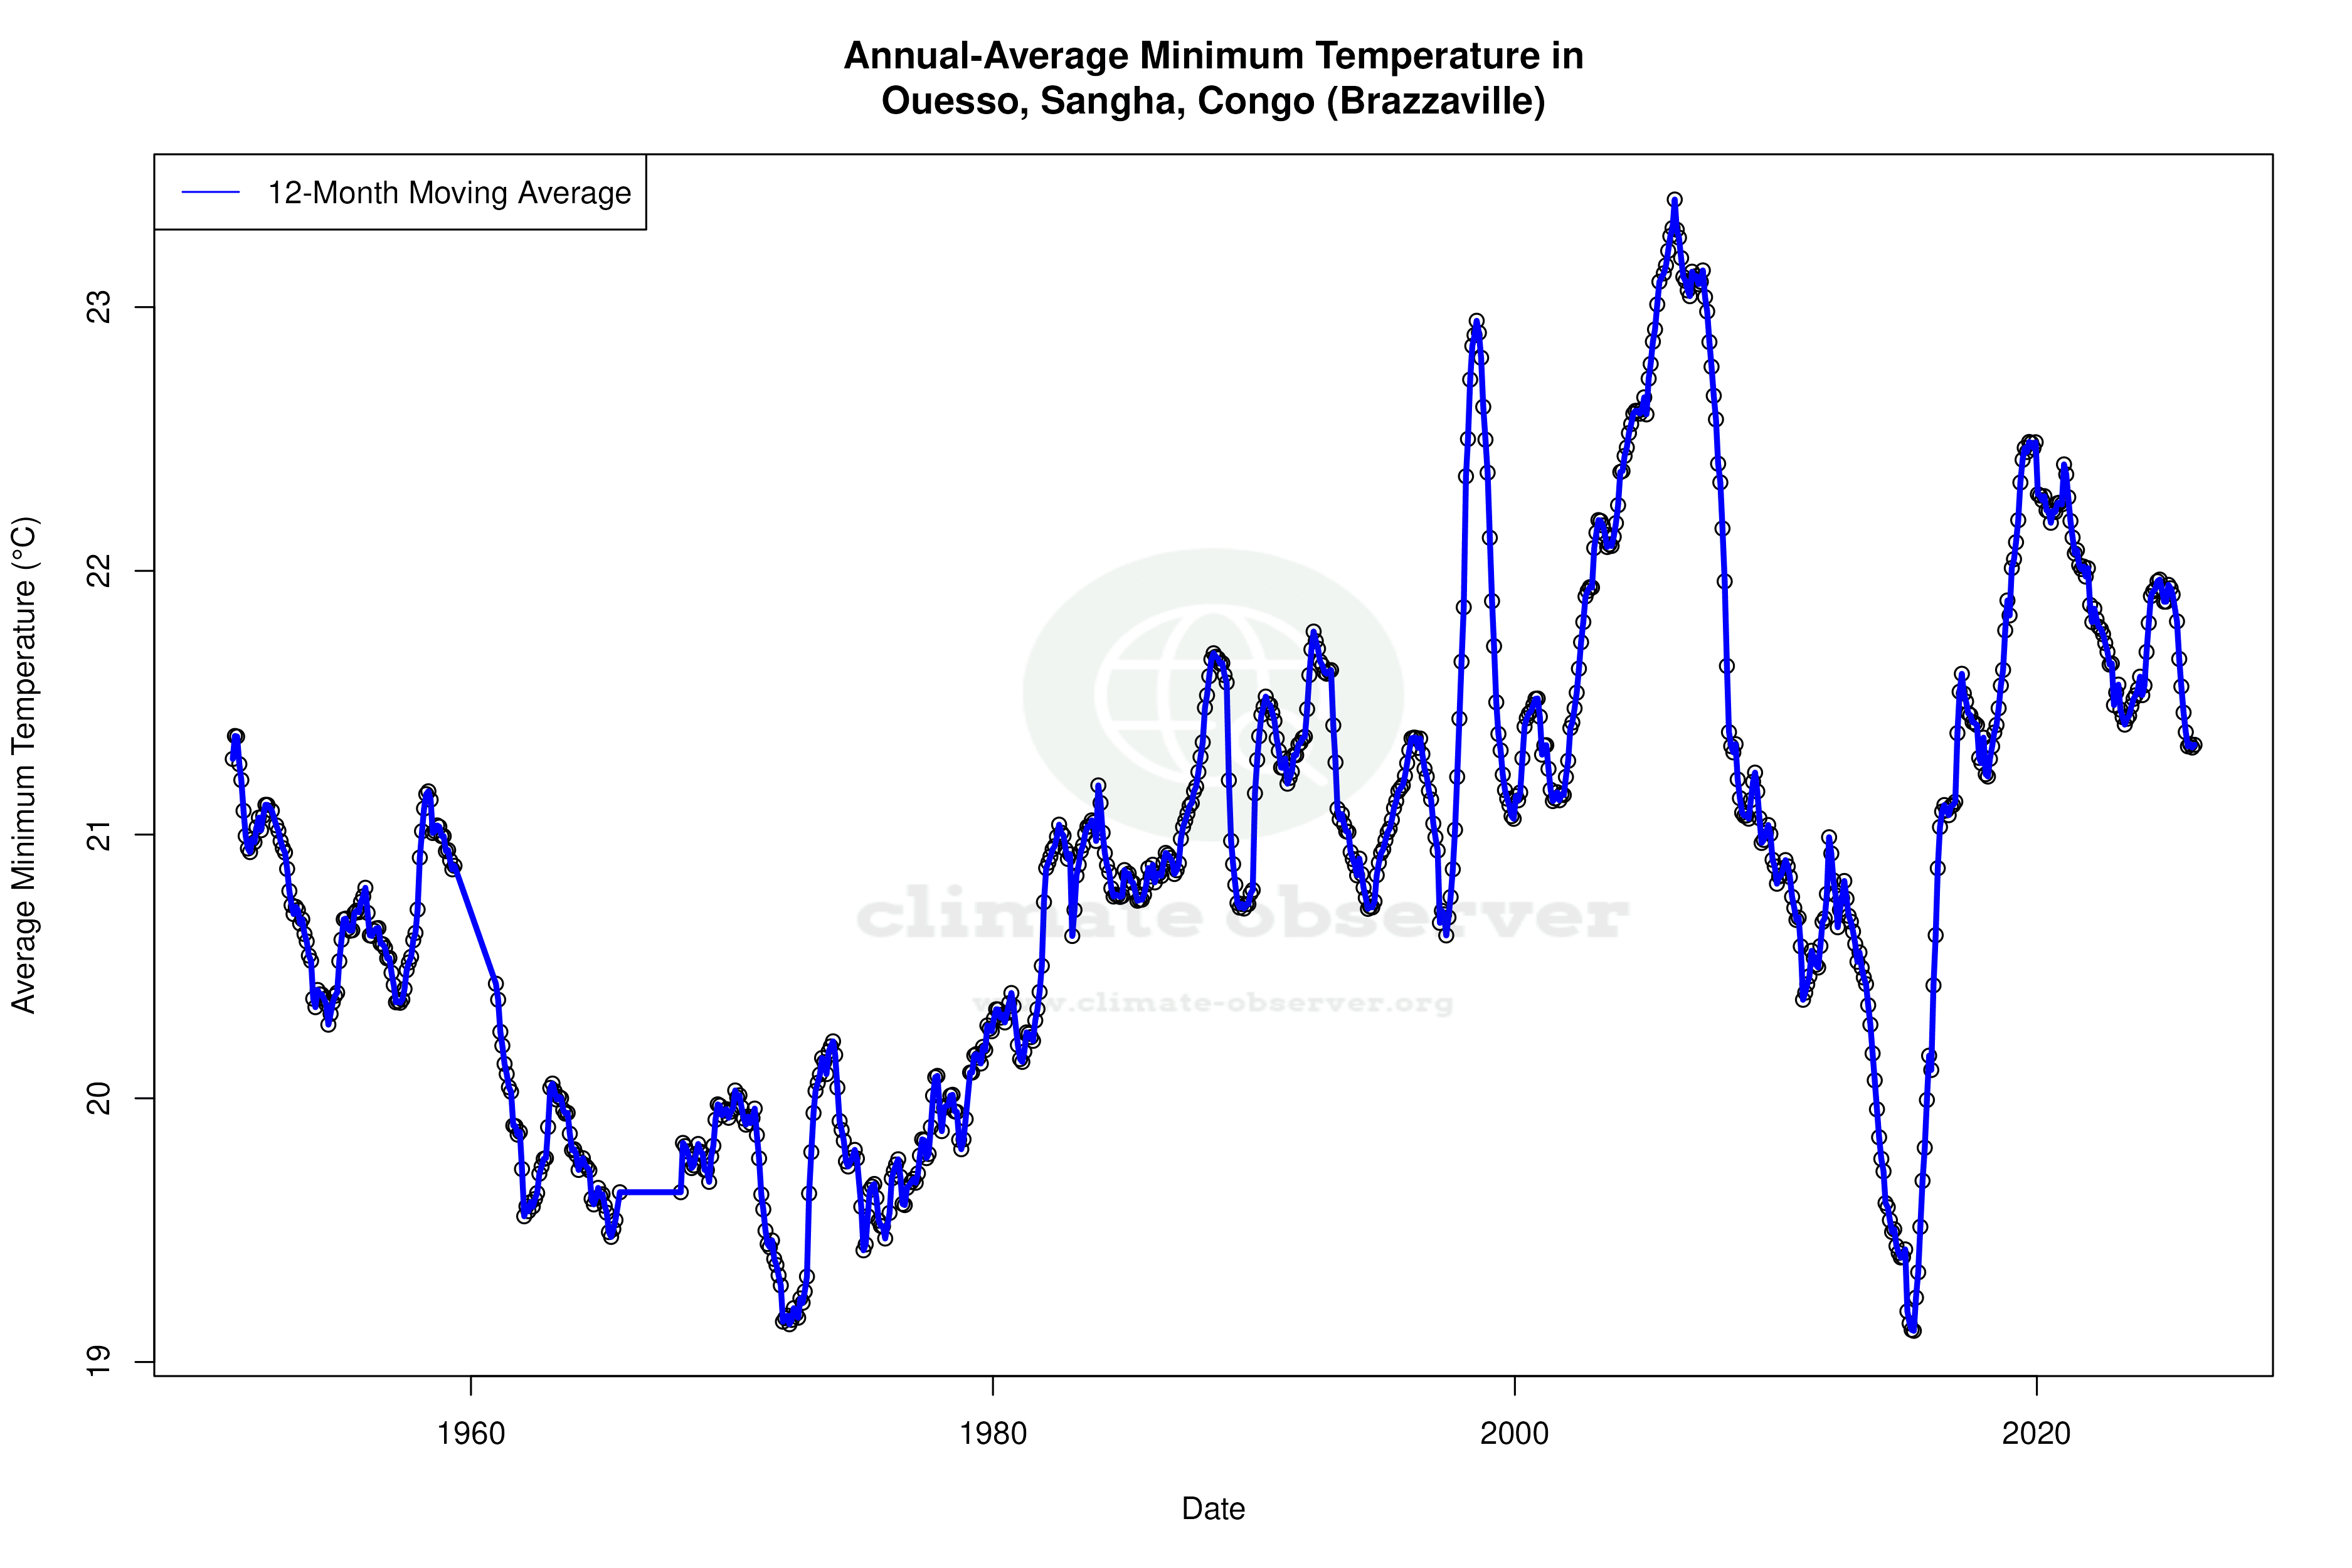
Temperature Trends: A Tale of Two Scales
The all-time temperature trends in Ouesso reveal a warming in the lows, with an increase of 0.23°C (0.41°F). This suggests milder nights over the long term. Conversely, the highs have shown a slight cooling, with a decrease of 0.16°C (0.29°F). This cooling trend is more pronounced in the recent decade, with highs dropping by 0.32°C (0.58°F), indicating a potential shift in daytime temperature dynamics. Notably, the record high temperature stands at 43.5°C (110.3°F), while the record low is 10.0°C (50.0°F), showcasing the region's thermal extremes.
Precipitation Patterns: Concentration and Intensity
The Precipitation Concentration Index (PCI) for Ouesso has seen a marginal increase from a baseline of 11.33 to 11.55. This slight rise suggests a trend towards more concentrated rainfall events, where precipitation is increasingly occurring in fewer, more intense episodes. Although not drastic, this change could have implications for local water management and agriculture, as the region may experience more pronounced wet and dry periods.
Regional Climate Context
The Republic of the Congo has been actively working towards regional climate goals, focusing on sustainable forest management and adaptation strategies to mitigate the impacts of climate change. Ouesso's climate data, with its nuanced trends, provides valuable insights into the broader climatic shifts occurring within the Congo Basin. Recent weather events, such as intense rainfall and flooding, align with the observed increase in precipitation concentration, highlighting the need for continued monitoring and adaptive measures.
Implications for Local and Regional Climate Strategies
Understanding these climatic trends is crucial for local policymakers and stakeholders in Ouesso. The cooling of daytime highs, combined with the marginal increase in rainfall concentration, suggests potential shifts in agricultural practices and water resource management. As the Republic of the Congo advances its climate resilience initiatives, integrating these insights will be vital to addressing both current challenges and future uncertainties in the region.
Station Statistics
10-Year Trend
High: -0.69 °F/decade
Low: +0.14 °F/decade
Rain: -0.080 in/decade
25-Year Trend
High: +0.35 °F/decade
Low: -0.33 °F/decade
Rain: -0.005 in/decade
50-Year Trend
High: +0.99 °F/decade
Low: +0.41 °F/decade
Rain: -0.010 in/decade
All-Time Trend
High: +0.27 °F/decade
Low: +0.41 °F/decade
Rain: +0.000 in/decade
Percentage Above-Average Days
Last 12 Months: 46.1%
This Year: 45.0%
Precipitation Concentration Index (PCI) ℹ️
Last 12 Months: 10.0
Historical Average: 11.0
Percentile Rank of Last 12 Months ℹ️
High: 55th percentile
Low: 76th percentile
Rain: 18th percentile
Change in Variance ℹ️
High: -12.7%
Low: -36.6%
Intraday: -15.7%
Data Coverage
89.4%
First Year of Data
1950
Station Location
Historical Weather Records
| Max High | Avg High | Min High | Max Avg | Avg Avg | Min Avg | Max Low | Avg Low | Min Low | Max Precipitation | Avg Precipitation | Max Snow | Avg Snow | |
|---|---|---|---|---|---|---|---|---|---|---|---|---|---|
| Record | 110.30 °F | — | 69.80 °F | 93.02 °F | — | 62.96 °F | 82.04 °F | — | 50.00 °F | 7.76 in | — | — | — |
| January | 103.10 °F | 87.64 °F | 73.04 °F | 88.84 °F | 78.55 °F | 62.96 °F | 79.88 °F | 68.40 °F | 50.00 °F | 2.92 in | 0.07 in | — | — |
| February | 105.37 °F | 89.36 °F | 71.96 °F | 92.26 °F | 80.07 °F | 67.75 °F | 82.04 °F | 69.72 °F | 53.42 °F | 7.34 in | 0.12 in | — | — |
| March | 105.80 °F | 88.89 °F | 71.96 °F | 93.02 °F | 80.15 °F | 69.44 °F | 80.91 °F | 70.74 °F | 57.92 °F | 3.54 in | 0.19 in | — | — |
| April | 110.30 °F | 88.04 °F | 72.50 °F | 91.04 °F | 79.58 °F | 70.52 °F | 80.56 °F | 70.90 °F | 60.80 °F | 5.39 in | 0.20 in | — | — |
| May | 102.20 °F | 87.32 °F | 72.32 °F | 90.14 °F | 79.05 °F | 70.34 °F | 78.78 °F | 70.71 °F | 64.04 °F | 6.57 in | 0.23 in | — | — |
| June | 98.51 °F | 85.53 °F | 72.68 °F | 88.16 °F | 77.94 °F | 70.16 °F | 77.86 °F | 69.69 °F | 60.80 °F | 4.37 in | 0.19 in | — | — |
| July | 102.20 °F | 84.60 °F | 69.80 °F | 87.26 °F | 77.30 °F | 68.90 °F | 76.86 °F | 69.08 °F | 57.20 °F | 4.21 in | 0.15 in | — | — |
| August | 102.92 °F | 84.75 °F | 72.50 °F | 86.83 °F | 77.25 °F | 68.90 °F | 77.38 °F | 69.14 °F | 57.74 °F | 5.75 in | 0.20 in | — | — |
| September | 102.92 °F | 84.67 °F | 71.60 °F | 85.82 °F | 76.93 °F | 69.44 °F | 76.77 °F | 69.21 °F | 58.82 °F | 7.76 in | 0.31 in | — | — |
| October | 99.86 °F | 84.69 °F | 71.96 °F | 87.62 °F | 76.99 °F | 66.74 °F | 78.22 °F | 69.42 °F | 60.08 °F | 6.42 in | 0.31 in | — | — |
| November | 102.20 °F | 84.95 °F | 71.96 °F | 86.72 °F | 77.34 °F | 68.90 °F | 76.32 °F | 69.41 °F | 62.24 °F | 4.33 in | 0.23 in | — | — |
| December | 98.29 °F | 85.80 °F | 71.60 °F | 86.49 °F | 77.83 °F | 67.64 °F | 76.68 °F | 68.83 °F | 53.60 °F | 2.70 in | 0.11 in | — | — |
Data Visualisations
Remove WatermarksCurrent Year Climate Trends vs Historical


Max Temperature this Year | 1 of 6
Climate 12-Month Moving Averages


Max Temperature 12-Month MA | 1 of 6
Daily Data Points and Averages Throughout the Year


Average Max Temperature Throughout Year | 1 of 5
