Climate for Station: Kananga, Kasai Central, Congo (Kinshasa)
Loading live weather...
Climate Analysis & Overview
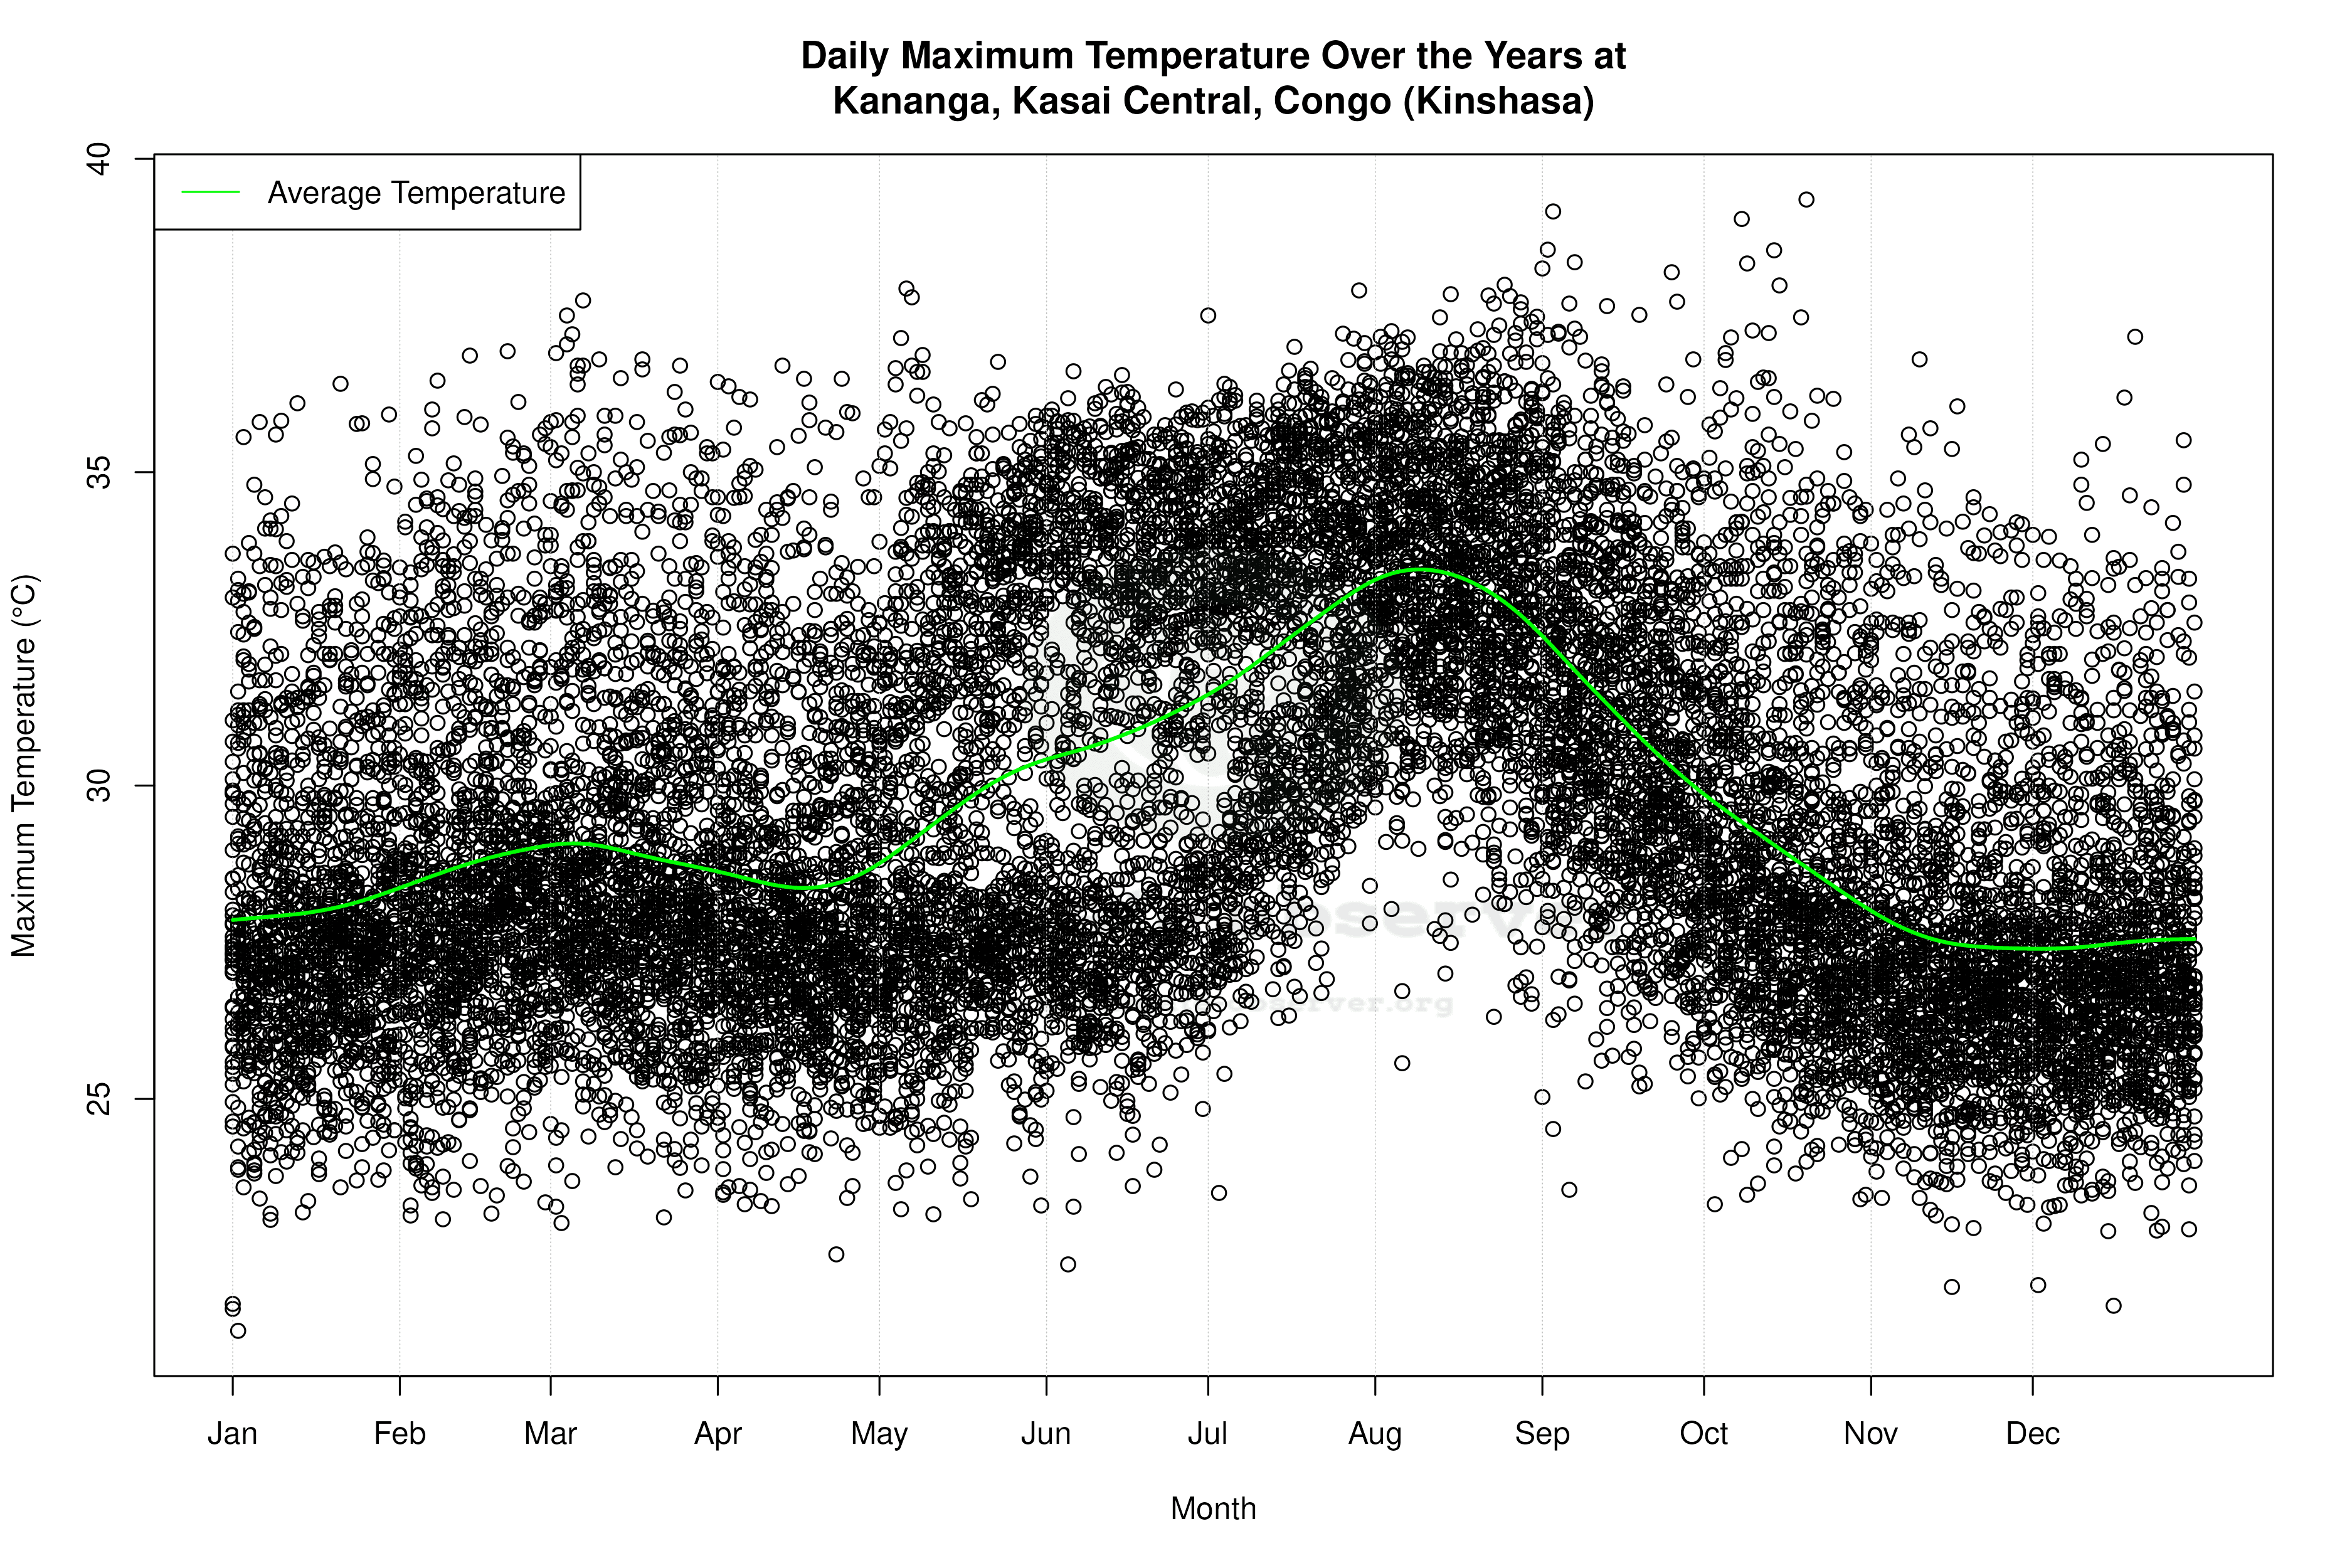
Kananga's climate profile reveals a complex interplay of warming trends and precipitation distribution, reflecting broader regional shifts. While the all-time temperature trends indicate a slight warming, recent years have shown more pronounced changes. The city's precipitation is becoming slightly more evenly distributed, aligning with Congo's climate adaptation goals.
Warming Trends in Kananga
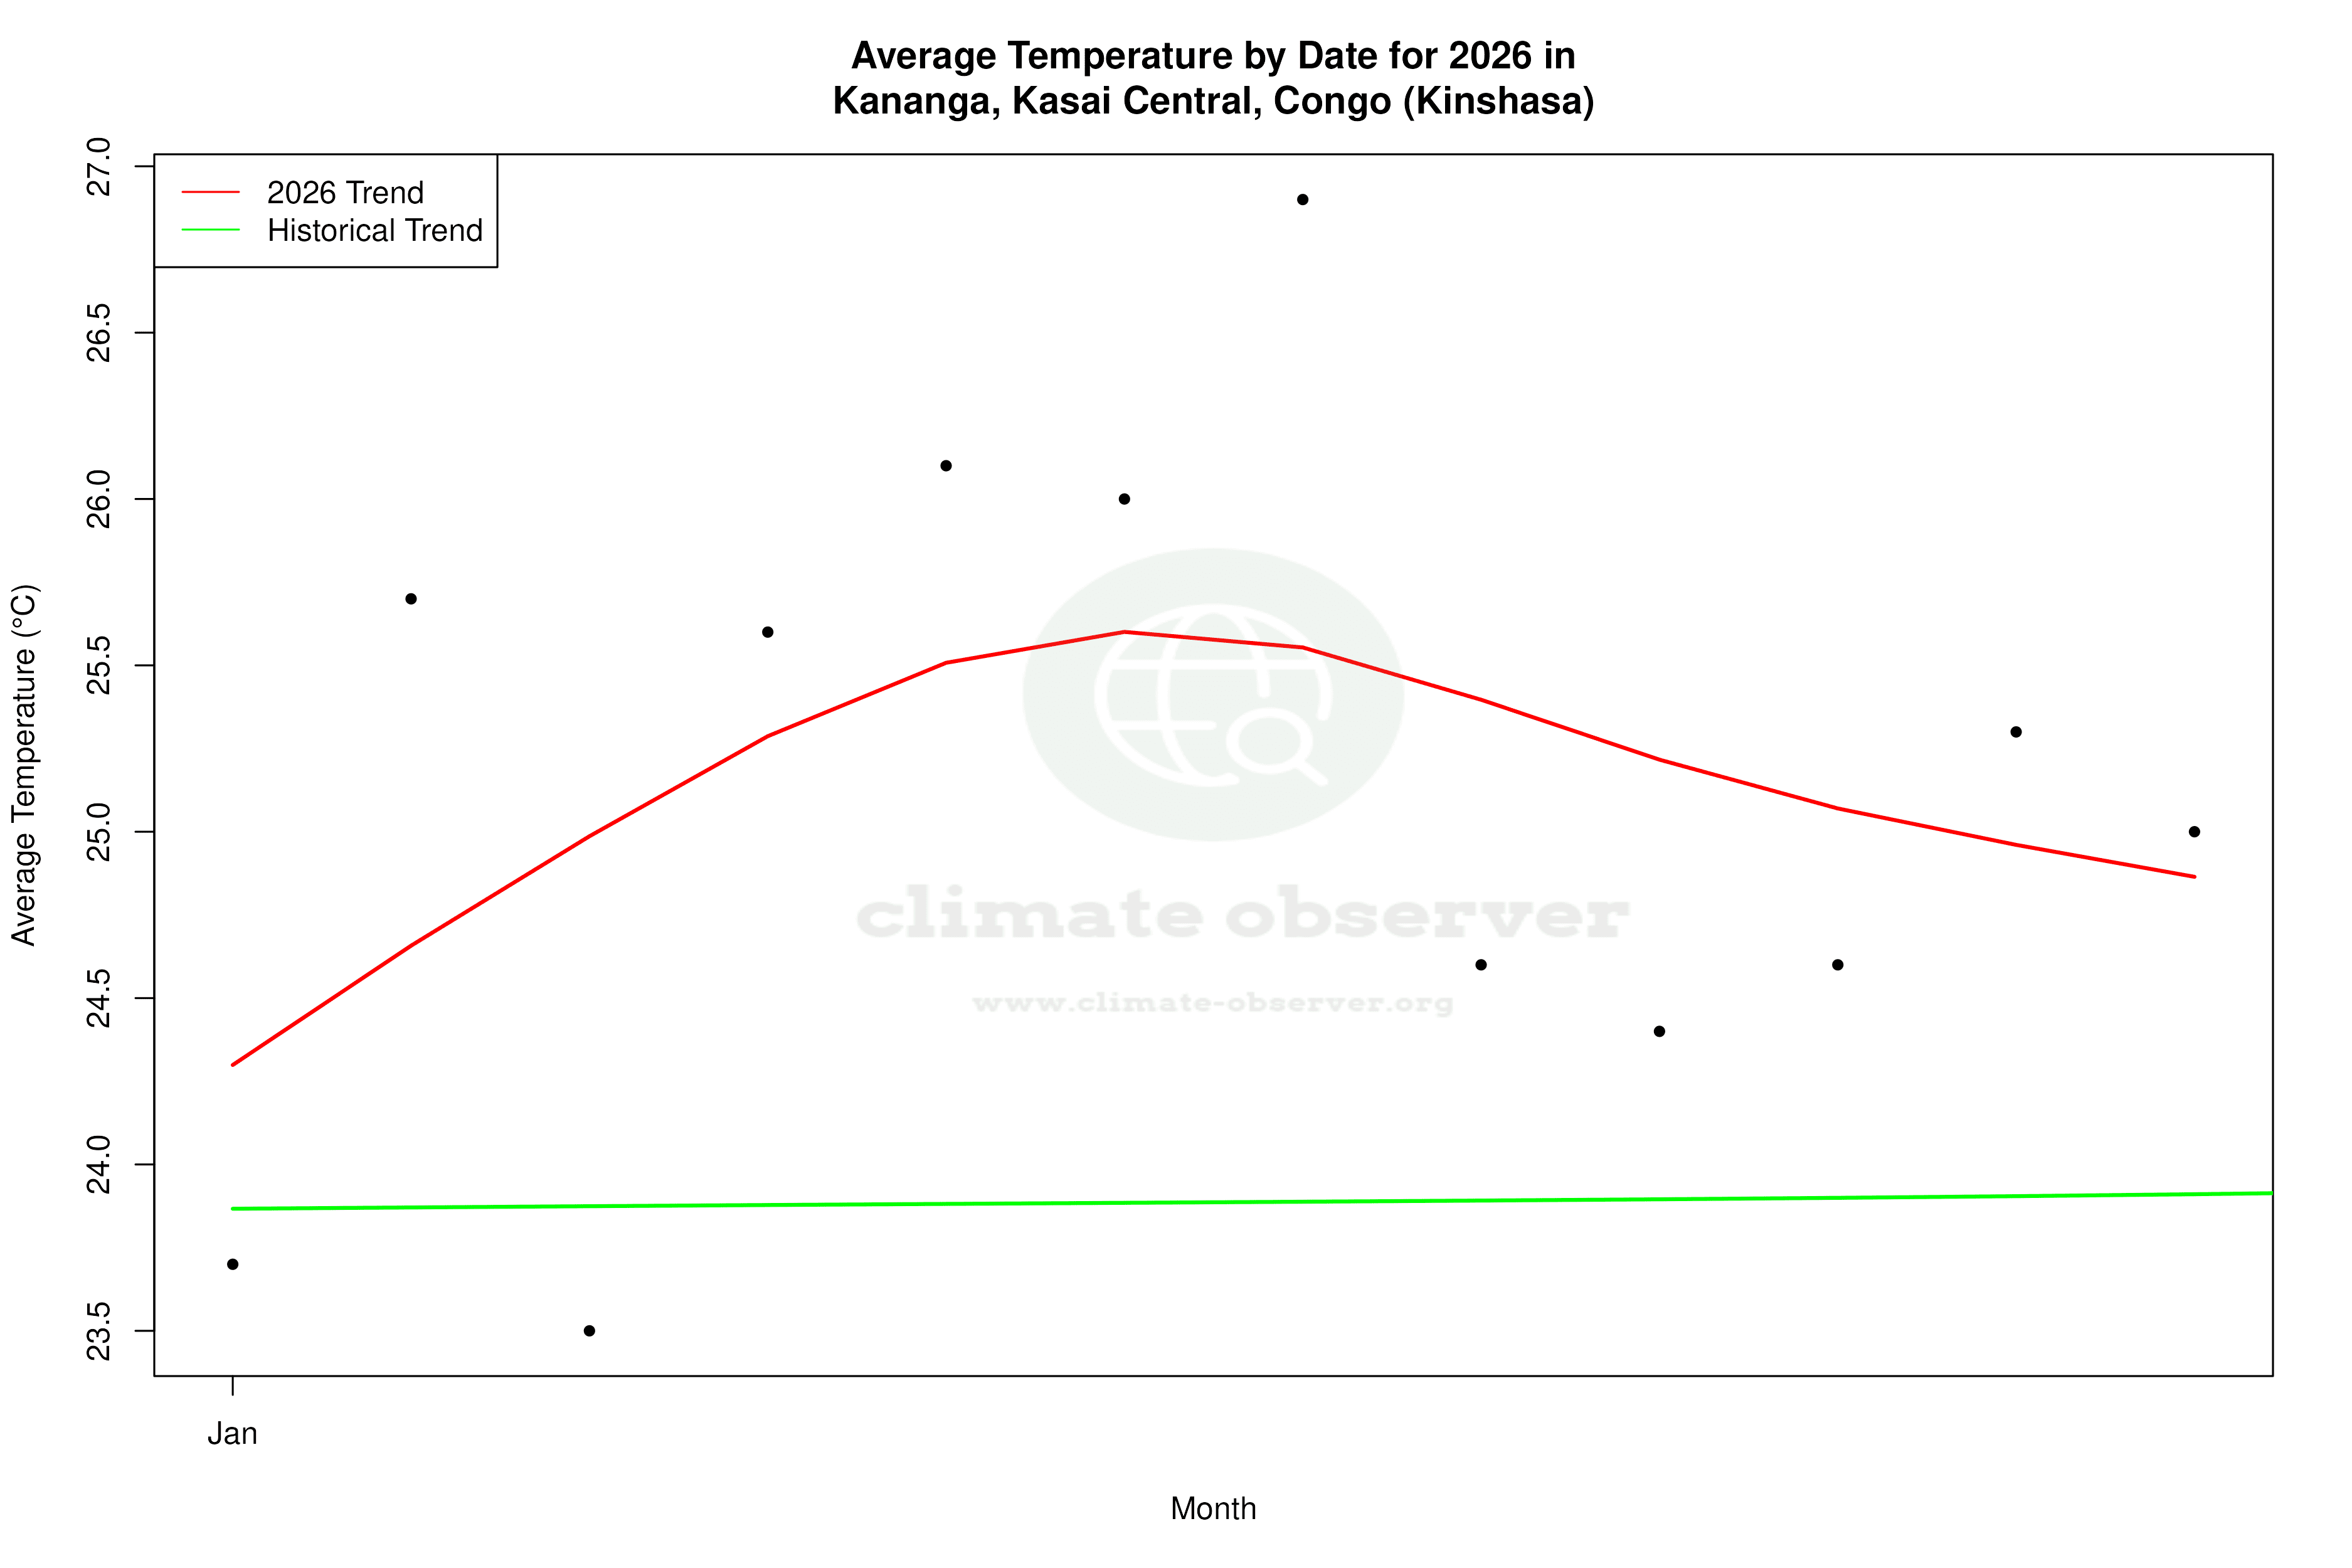
Kananga, located in the heart of the Democratic Republic of the Congo, experiences a tropical wet and dry climate, classified as Aw in the Köppen climate classification. This region is characterised by distinct wet and dry seasons, influenced by its proximity to the equator and the surrounding tropical forests. Over the past decade, Kananga has experienced a notable warming trend, with high temperatures increasing by 2.62°C (4.72°F). This is a more significant change compared to the all-time trend, which shows a warming of 0.99°C (1.78°F). Such a rapid increase in recent years suggests a shift in regional climate patterns, possibly exacerbated by global climate change.
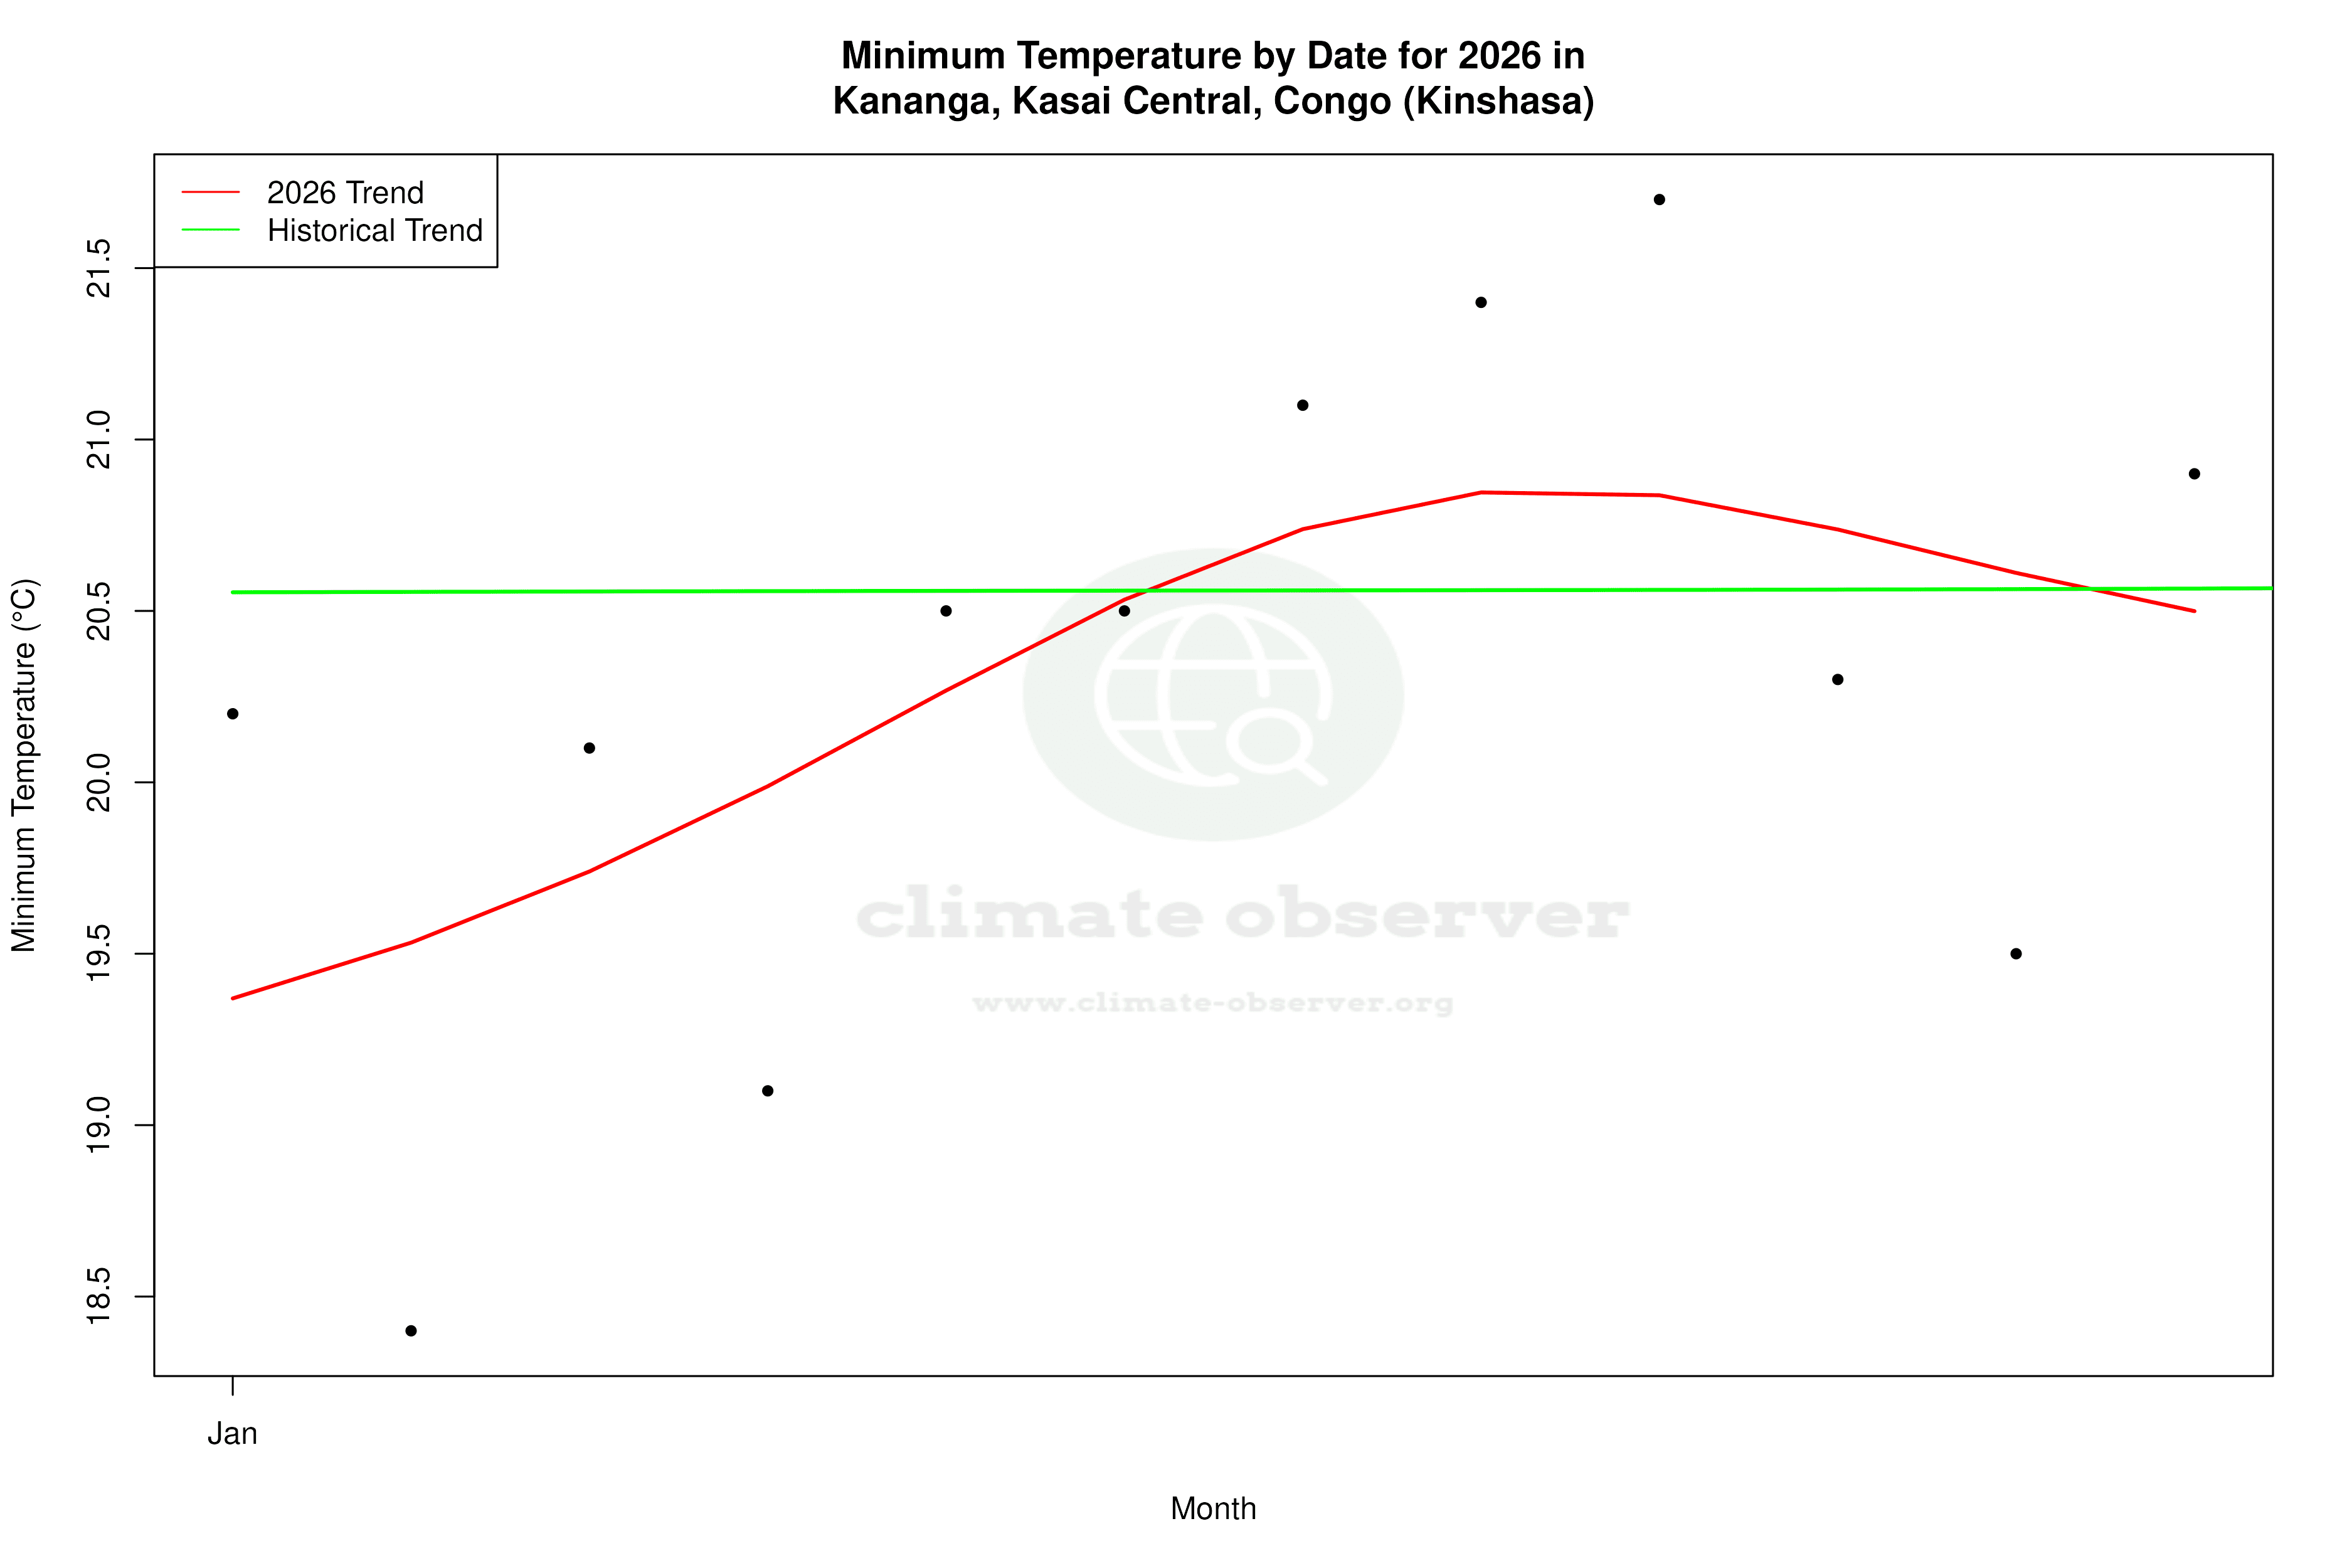
Cooling Nights: A Contradictory Trend
Interestingly, while daytime temperatures have risen, nighttime lows have shown a cooling trend over the past decade, with a decrease of 0.86°C (1.55°F). This is in contrast to the all-time trend, which indicates a slight warming of 0.32°C (0.58°F) for lows. This cooling of nighttime temperatures could be influenced by local microclimates or changes in atmospheric conditions, such as increased cloud cover or altered wind patterns, which are common in tropical regions.
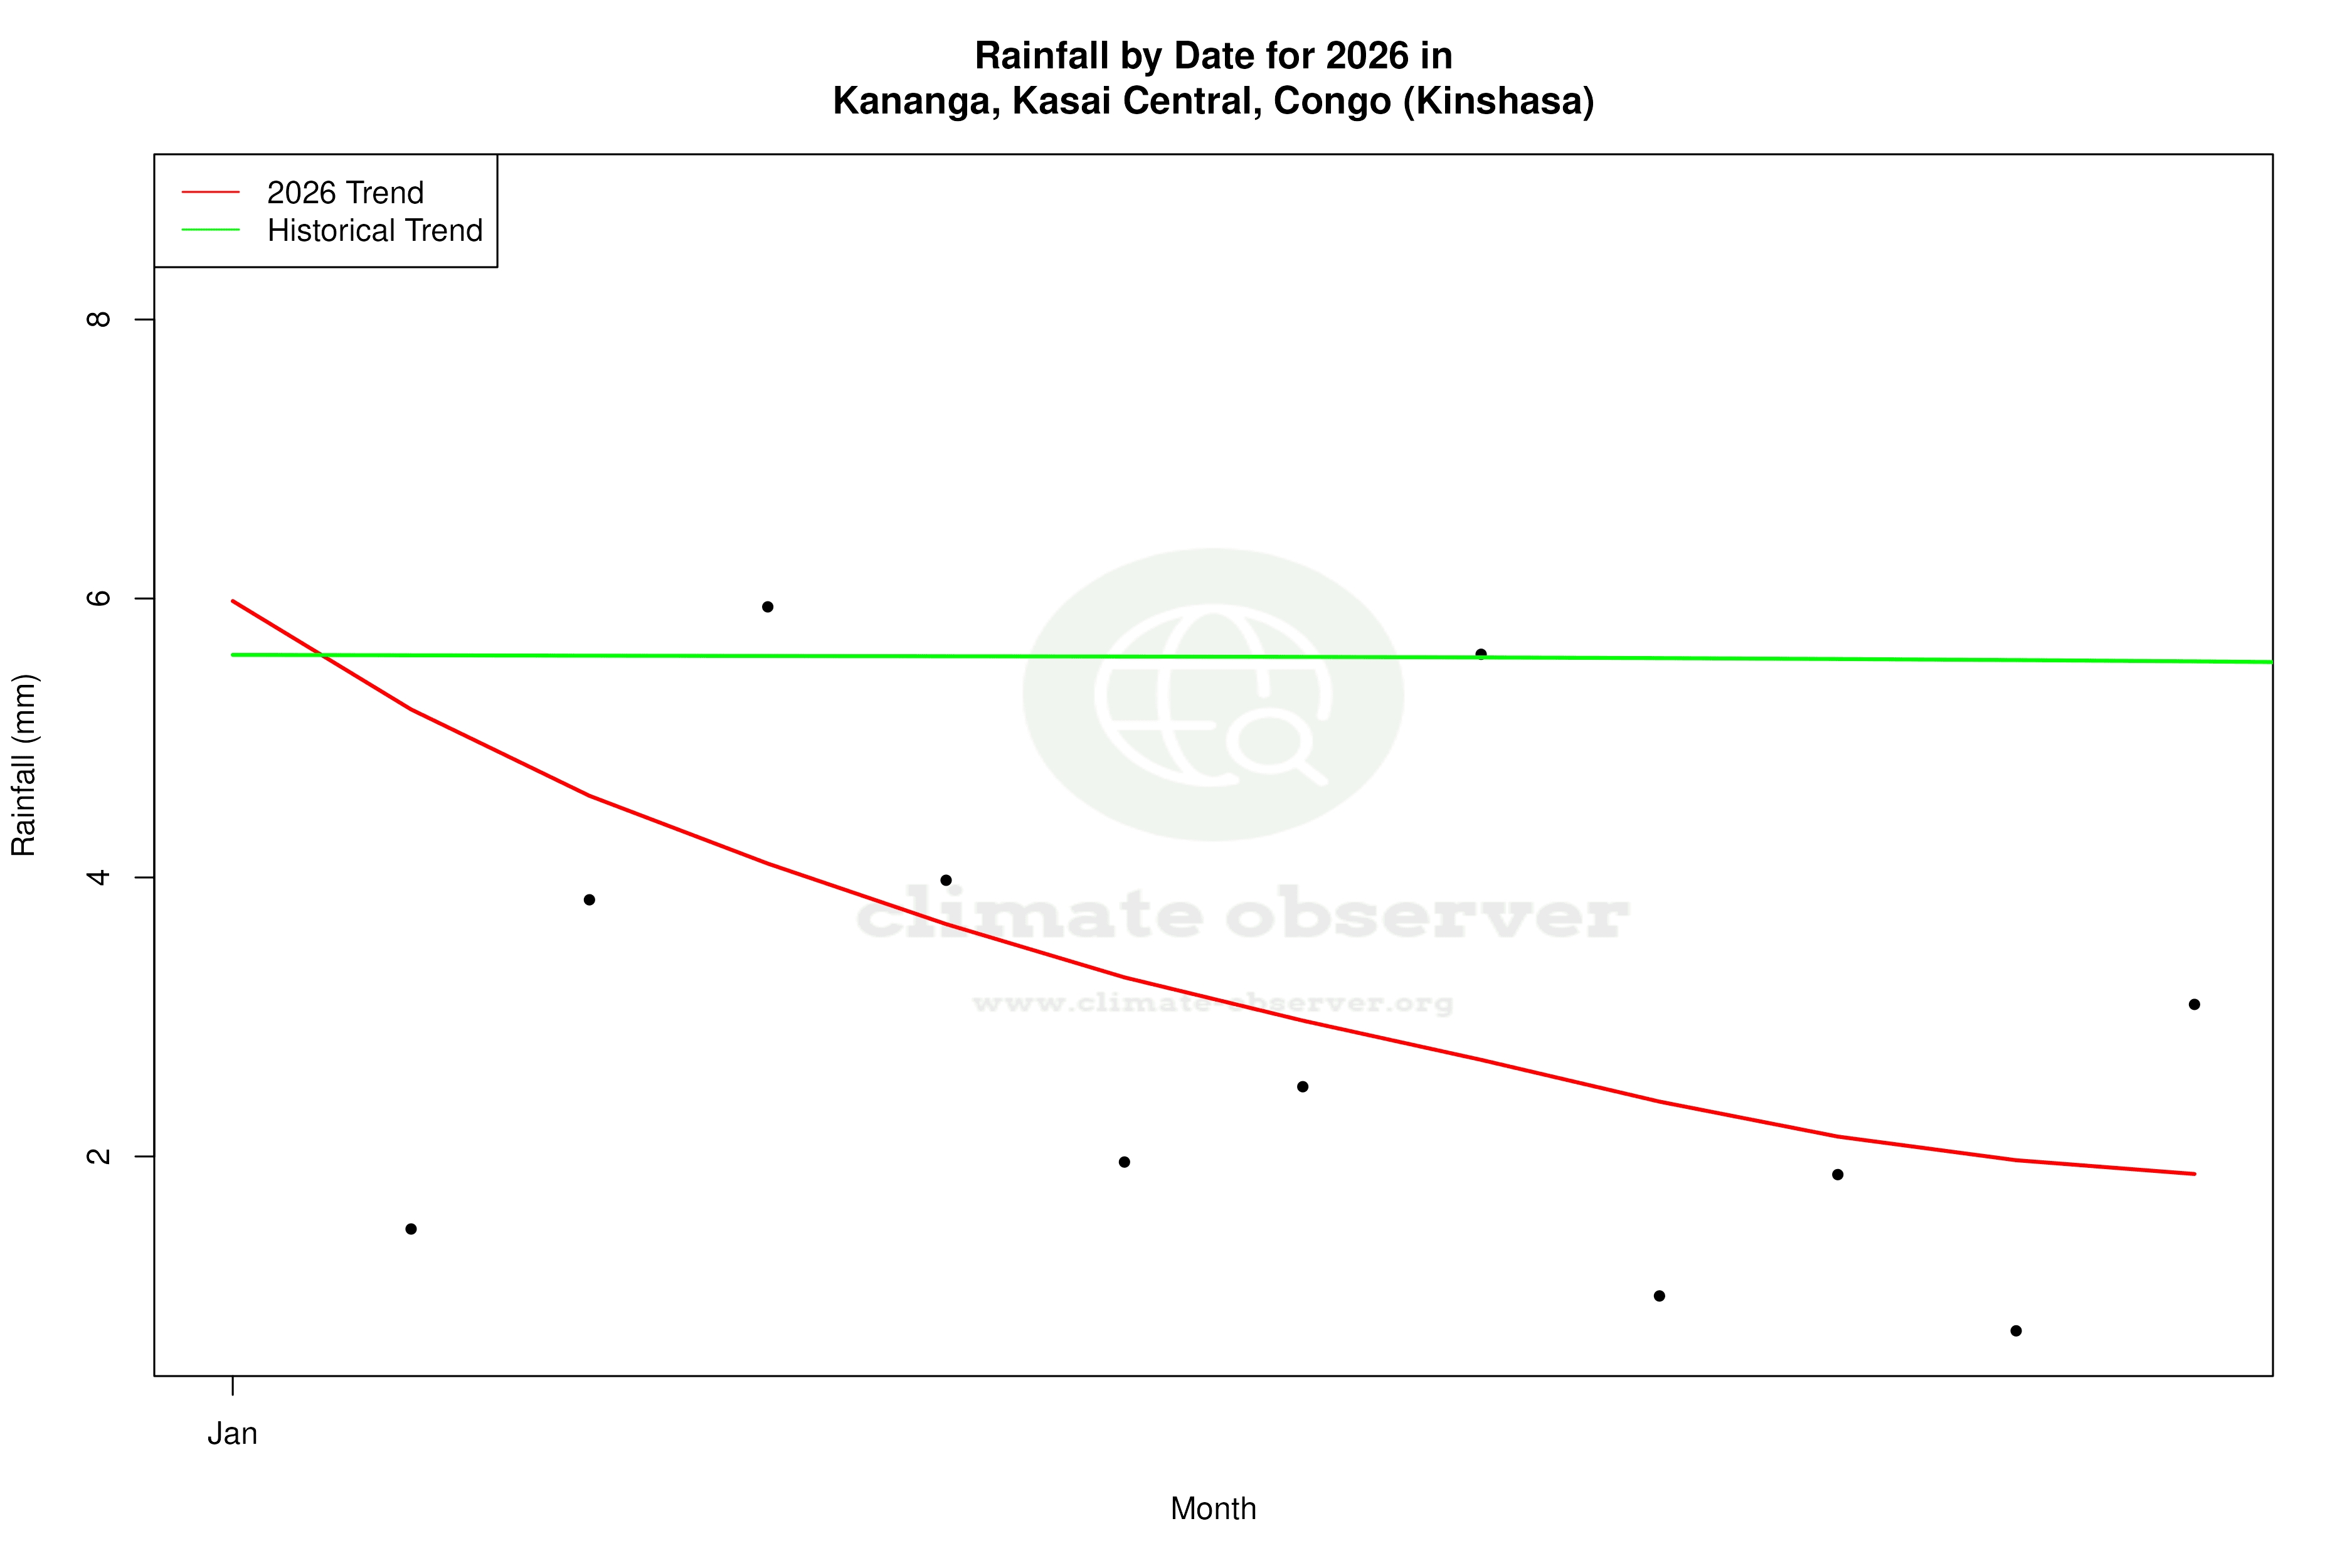
Precipitation Patterns: A Marginal Shift
The Precipitation Concentration Index (PCI) for Kananga has experienced a slight decrease from a baseline of 13.29 to a current value of 12.76. This indicates that rainfall is becoming marginally more evenly distributed throughout the year. While the change is not drastic, it suggests a trend towards less concentrated rainfall events, which could help mitigate flooding risks and improve water availability during the dry season. This aligns with Congo's regional climate goals of enhancing water resource management and resilience to climate variability.
Record Extremes: Temperature Benchmarks
Kananga's climate records highlight the extremes experienced in this tropical region. The highest recorded temperature is 39.35°C (102.83°F), while the lowest is 10.00°C (50.00°F). These extremes underscore the variability and potential challenges posed by climate change, as increased temperature variability can impact agriculture, water resources, and health.
Regional Climate Context
The broader context of Kananga's climate trends is shaped by the Democratic Republic of the Congo's commitment to addressing climate change impacts. Recent weather events, such as intense rainfall and heatwaves, have prompted national efforts to enhance climate resilience. These initiatives aim to adapt to the changing climate while protecting the livelihoods and ecosystems that are vital to the region's socio-economic stability.
Station Statistics
10-Year Trend
High: +4.05 °F/decade
Low: -1.67 °F/decade
Rain: -0.029 in/decade
25-Year Trend
High: +0.45 °F/decade
Low: -0.27 °F/decade
Rain: -0.011 in/decade
50-Year Trend
High: +1.78 °F/decade
Low: +0.55 °F/decade
Rain: -0.028 in/decade
All-Time Trend
High: +1.78 °F/decade
Low: +0.55 °F/decade
Rain: -0.028 in/decade
Percentage Above-Average Days
Last 12 Months: 67.7%
This Year: 59.1%
Precipitation Concentration Index (PCI) ℹ️
Last 12 Months: 12.3
Historical Average: 12.6
Percentile Rank of Last 12 Months ℹ️
High: 83rd percentile
Low: 56th percentile
Rain: 22nd percentile
Change in Variance ℹ️
High: -12.5%
Low: -41.7%
Intraday: -5.3%
Data Coverage
98.3%
First Year of Data
1980
Station Location
Historical Weather Records
| Max High | Avg High | Min High | Max Avg | Avg Avg | Min Avg | Max Low | Avg Low | Min Low | Max Precipitation | Avg Precipitation | Max Snow | Avg Snow | |
|---|---|---|---|---|---|---|---|---|---|---|---|---|---|
| Record | 102.83 °F | — | 70.34 °F | 89.31 °F | — | 64.35 °F | 78.93 °F | — | 50.00 °F | 2.98 in | — | — | — |
| January | 97.54 °F | 82.53 °F | 70.34 °F | 86.04 °F | 75.20 °F | 67.15 °F | 76.12 °F | 69.08 °F | 63.16 °F | 2.50 in | 0.21 in | — | — |
| February | 98.47 °F | 83.73 °F | 73.54 °F | 87.44 °F | 76.03 °F | 68.77 °F | 76.32 °F | 69.48 °F | 64.04 °F | 2.11 in | 0.21 in | — | — |
| March | 99.93 °F | 84.04 °F | 71.28 °F | 87.08 °F | 76.44 °F | 69.69 °F | 77.18 °F | 69.87 °F | 64.40 °F | 2.25 in | 0.21 in | — | — |
| April | 98.06 °F | 83.23 °F | 72.54 °F | 86.34 °F | 75.99 °F | 70.32 °F | 77.56 °F | 69.83 °F | 63.39 °F | 2.76 in | 0.19 in | — | — |
| May | 100.27 °F | 85.42 °F | 73.69 °F | 88.05 °F | 76.42 °F | 67.98 °F | 78.33 °F | 68.38 °F | 50.00 °F | 1.81 in | 0.07 in | — | — |
| June | 97.90 °F | 87.52 °F | 72.25 °F | 86.00 °F | 75.81 °F | 64.35 °F | 76.62 °F | 64.86 °F | 53.04 °F | 1.41 in | 0.01 in | — | — |
| July | 100.22 °F | 90.17 °F | 74.30 °F | 85.08 °F | 76.80 °F | 65.59 °F | 75.76 °F | 64.70 °F | 53.73 °F | 0.84 in | 0.01 in | — | — |
| August | 100.38 °F | 91.84 °F | 78.03 °F | 87.55 °F | 79.42 °F | 70.56 °F | 77.34 °F | 68.48 °F | 56.75 °F | 2.93 in | 0.07 in | — | — |
| September | 102.49 °F | 87.92 °F | 74.39 °F | 88.05 °F | 78.03 °F | 70.34 °F | 78.04 °F | 69.74 °F | 63.32 °F | 2.98 in | 0.18 in | — | — |
| October | 102.83 °F | 84.12 °F | 73.98 °F | 89.31 °F | 76.23 °F | 70.70 °F | 78.93 °F | 69.83 °F | 64.22 °F | 2.31 in | 0.22 in | — | — |
| November | 98.24 °F | 81.59 °F | 71.60 °F | 85.42 °F | 74.87 °F | 69.44 °F | 74.79 °F | 69.35 °F | 64.22 °F | 2.42 in | 0.29 in | — | — |
| December | 98.89 °F | 81.50 °F | 71.06 °F | 85.42 °F | 74.71 °F | 68.83 °F | 75.85 °F | 69.16 °F | 64.74 °F | 2.39 in | 0.24 in | — | — |
Data Visualisations
Remove WatermarksCurrent Year Climate Trends vs Historical


Max Temperature this Year | 1 of 6
Climate 12-Month Moving Averages


Max Temperature 12-Month MA | 1 of 6
Daily Data Points and Averages Throughout the Year


Average Max Temperature Throughout Year | 1 of 5
