Climate for Station: Nenjiang, Heilongjiang, China
Loading live weather...
Climate Analysis & Overview
Nenjiang is experiencing a warming trend with significant changes in temperature highs over the past decade, contrasting with a more stable long-term pattern. Precipitation has become more evenly distributed, reflecting a shift in climatic behaviour. These changes align with China's climate adaptation goals, focusing on understanding and mitigating regional climate impacts.
Warming Trends in Nenjiang
Situated in the northeastern part of China, Nenjiang falls under the Dwb classification in the Köppen climate system, denoting a humid continental climate with dry winters. Over the last decade, Nenjiang has experienced a notable warming in temperature highs, with an increase of 1.73°C (3.11°F). This short-term trend suggests a shift towards warmer conditions, which is more pronounced than the long-term all-time trend that shows a modest rise of 0.19°C (0.34°F) in highs. Meanwhile, the lows have increased by 0.40°C (0.72°F) over the past ten years, closely mirroring the all-time trend of 0.41°C (0.74°F). This indicates a consistent warming pattern, albeit less dramatic than the highs.
Temperature Extremes and Regional Impact
Nenjiang's geographic location contributes to its temperature extremes, with a record high of 40.0°C (104.0°F) and a record low of -47.3°C (-53.1°F). These extremes are influenced by the region's continental position, far from moderating oceanic effects. Such variability poses challenges for local agriculture and water management, key areas of focus in China's climate strategy.
Precipitation Patterns: A Shift Towards Even Distribution
The Precipitation Concentration Index (PCI) for Nenjiang has decreased from a baseline of 19.3 to a current value of 14.5, indicating a shift towards a more even distribution of rainfall throughout the year. This change suggests a reduction in the concentration of precipitation events, which may lead to less intense but more frequent rainfall. Such a shift can be beneficial for reducing the risk of flooding and improving water resource management, aligning with China's broader climate resilience goals.
Regional Climate Goals and Adaptation
China's regional climate goals emphasize understanding and adapting to local climatic changes. Nenjiang's warming trends and evolving precipitation patterns highlight the need for adaptive strategies in agriculture, infrastructure, and water management. The observed changes in Nenjiang's climate underscore the importance of ongoing monitoring and research to inform policy and practice, ensuring sustainable development in the face of climate change.
Station Statistics
10-Year Trend
High: -2.59 °F/decade
Low: -4.98 °F/decade
Rain: -0.025 in/decade
25-Year Trend
High: -0.57 °F/decade
Low: -1.21 °F/decade
Rain: +0.008 in/decade
50-Year Trend
High: +0.27 °F/decade
Low: +0.35 °F/decade
Rain: +0.001 in/decade
All-Time Trend
High: +0.17 °F/decade
Low: +0.53 °F/decade
Rain: +0.000 in/decade
Percentage Above-Average Days
Last 12 Months: 51.2%
This Year: 52.2%
Precipitation Concentration Index (PCI) ℹ️
Last 12 Months: 13.6
Historical Average: 20.9
Percentile Rank of Last 12 Months ℹ️
High: 39th percentile
Low: 53rd percentile
Rain: 33rd percentile
Change in Variance ℹ️
High: -0.1%
Low: -3.6%
Intraday: -12.2%
Data Coverage
100.0%
First Year of Data
1951
Station Location
Historical Weather Records
| Max High | Avg High | Min High | Max Avg | Avg Avg | Min Avg | Max Low | Avg Low | Min Low | Max Precipitation | Avg Precipitation | Max Snow | Avg Snow | |
|---|---|---|---|---|---|---|---|---|---|---|---|---|---|
| Record | 104.00 °F | — | -30.82 °F | 87.80 °F | — | -42.34 °F | 76.10 °F | — | -53.14 °F | 4.15 in | — | — | — |
| January | 32.72 °F | 1.10 °F | -28.30 °F | 16.34 °F | -11.52 °F | -42.34 °F | 10.22 °F | -22.78 °F | -53.14 °F | 0.16 in | 0.00 in | — | — |
| February | 43.52 °F | 11.77 °F | -21.82 °F | 33.26 °F | -2.91 °F | -35.32 °F | 21.74 °F | -16.38 °F | -48.46 °F | 0.48 in | 0.01 in | — | — |
| March | 67.46 °F | 30.38 °F | -3.64 °F | 52.70 °F | 17.37 °F | -19.48 °F | 38.84 °F | 4.08 °F | -36.76 °F | 0.55 in | 0.01 in | — | — |
| April | 88.52 °F | 51.54 °F | 23.00 °F | 69.26 °F | 39.08 °F | 15.08 °F | 54.68 °F | 26.27 °F | -0.22 °F | 1.10 in | 0.03 in | — | — |
| May | 98.60 °F | 67.41 °F | 37.94 °F | 80.78 °F | 54.47 °F | 30.92 °F | 69.08 °F | 40.31 °F | 16.52 °F | 1.26 in | 0.05 in | — | — |
| June | 104.00 °F | 77.44 °F | 48.92 °F | 87.80 °F | 65.70 °F | 41.18 °F | 75.56 °F | 53.40 °F | 31.28 °F | 3.32 in | 0.11 in | — | — |
| July | 99.86 °F | 80.24 °F | 58.10 °F | 86.18 °F | 70.04 °F | 54.68 °F | 76.10 °F | 60.10 °F | 39.74 °F | 4.15 in | 0.17 in | — | — |
| August | 98.82 °F | 76.50 °F | 49.26 °F | 83.12 °F | 65.67 °F | 46.04 °F | 73.94 °F | 55.64 °F | 33.98 °F | 3.28 in | 0.14 in | — | — |
| September | 93.02 °F | 65.88 °F | 39.92 °F | 74.30 °F | 53.49 °F | 33.26 °F | 63.68 °F | 42.16 °F | 15.44 °F | 2.37 in | 0.09 in | — | — |
| October | 80.24 °F | 48.57 °F | 12.92 °F | 65.30 °F | 36.35 °F | 2.48 °F | 54.14 °F | 25.26 °F | -13.90 °F | 1.21 in | 0.03 in | — | — |
| November | 54.68 °F | 23.87 °F | -9.04 °F | 44.96 °F | 12.61 °F | -20.20 °F | 39.38 °F | 2.14 °F | -31.72 °F | 0.52 in | 0.01 in | — | — |
| December | 39.92 °F | 4.87 °F | -30.82 °F | 27.14 °F | -6.52 °F | -37.30 °F | 16.52 °F | -16.91 °F | -43.96 °F | 0.48 in | 0.01 in | — | — |
Data Visualisations
Remove WatermarksCurrent Year Climate Trends vs Historical


Max Temperature this Year | 1 of 6
Climate 12-Month Moving Averages


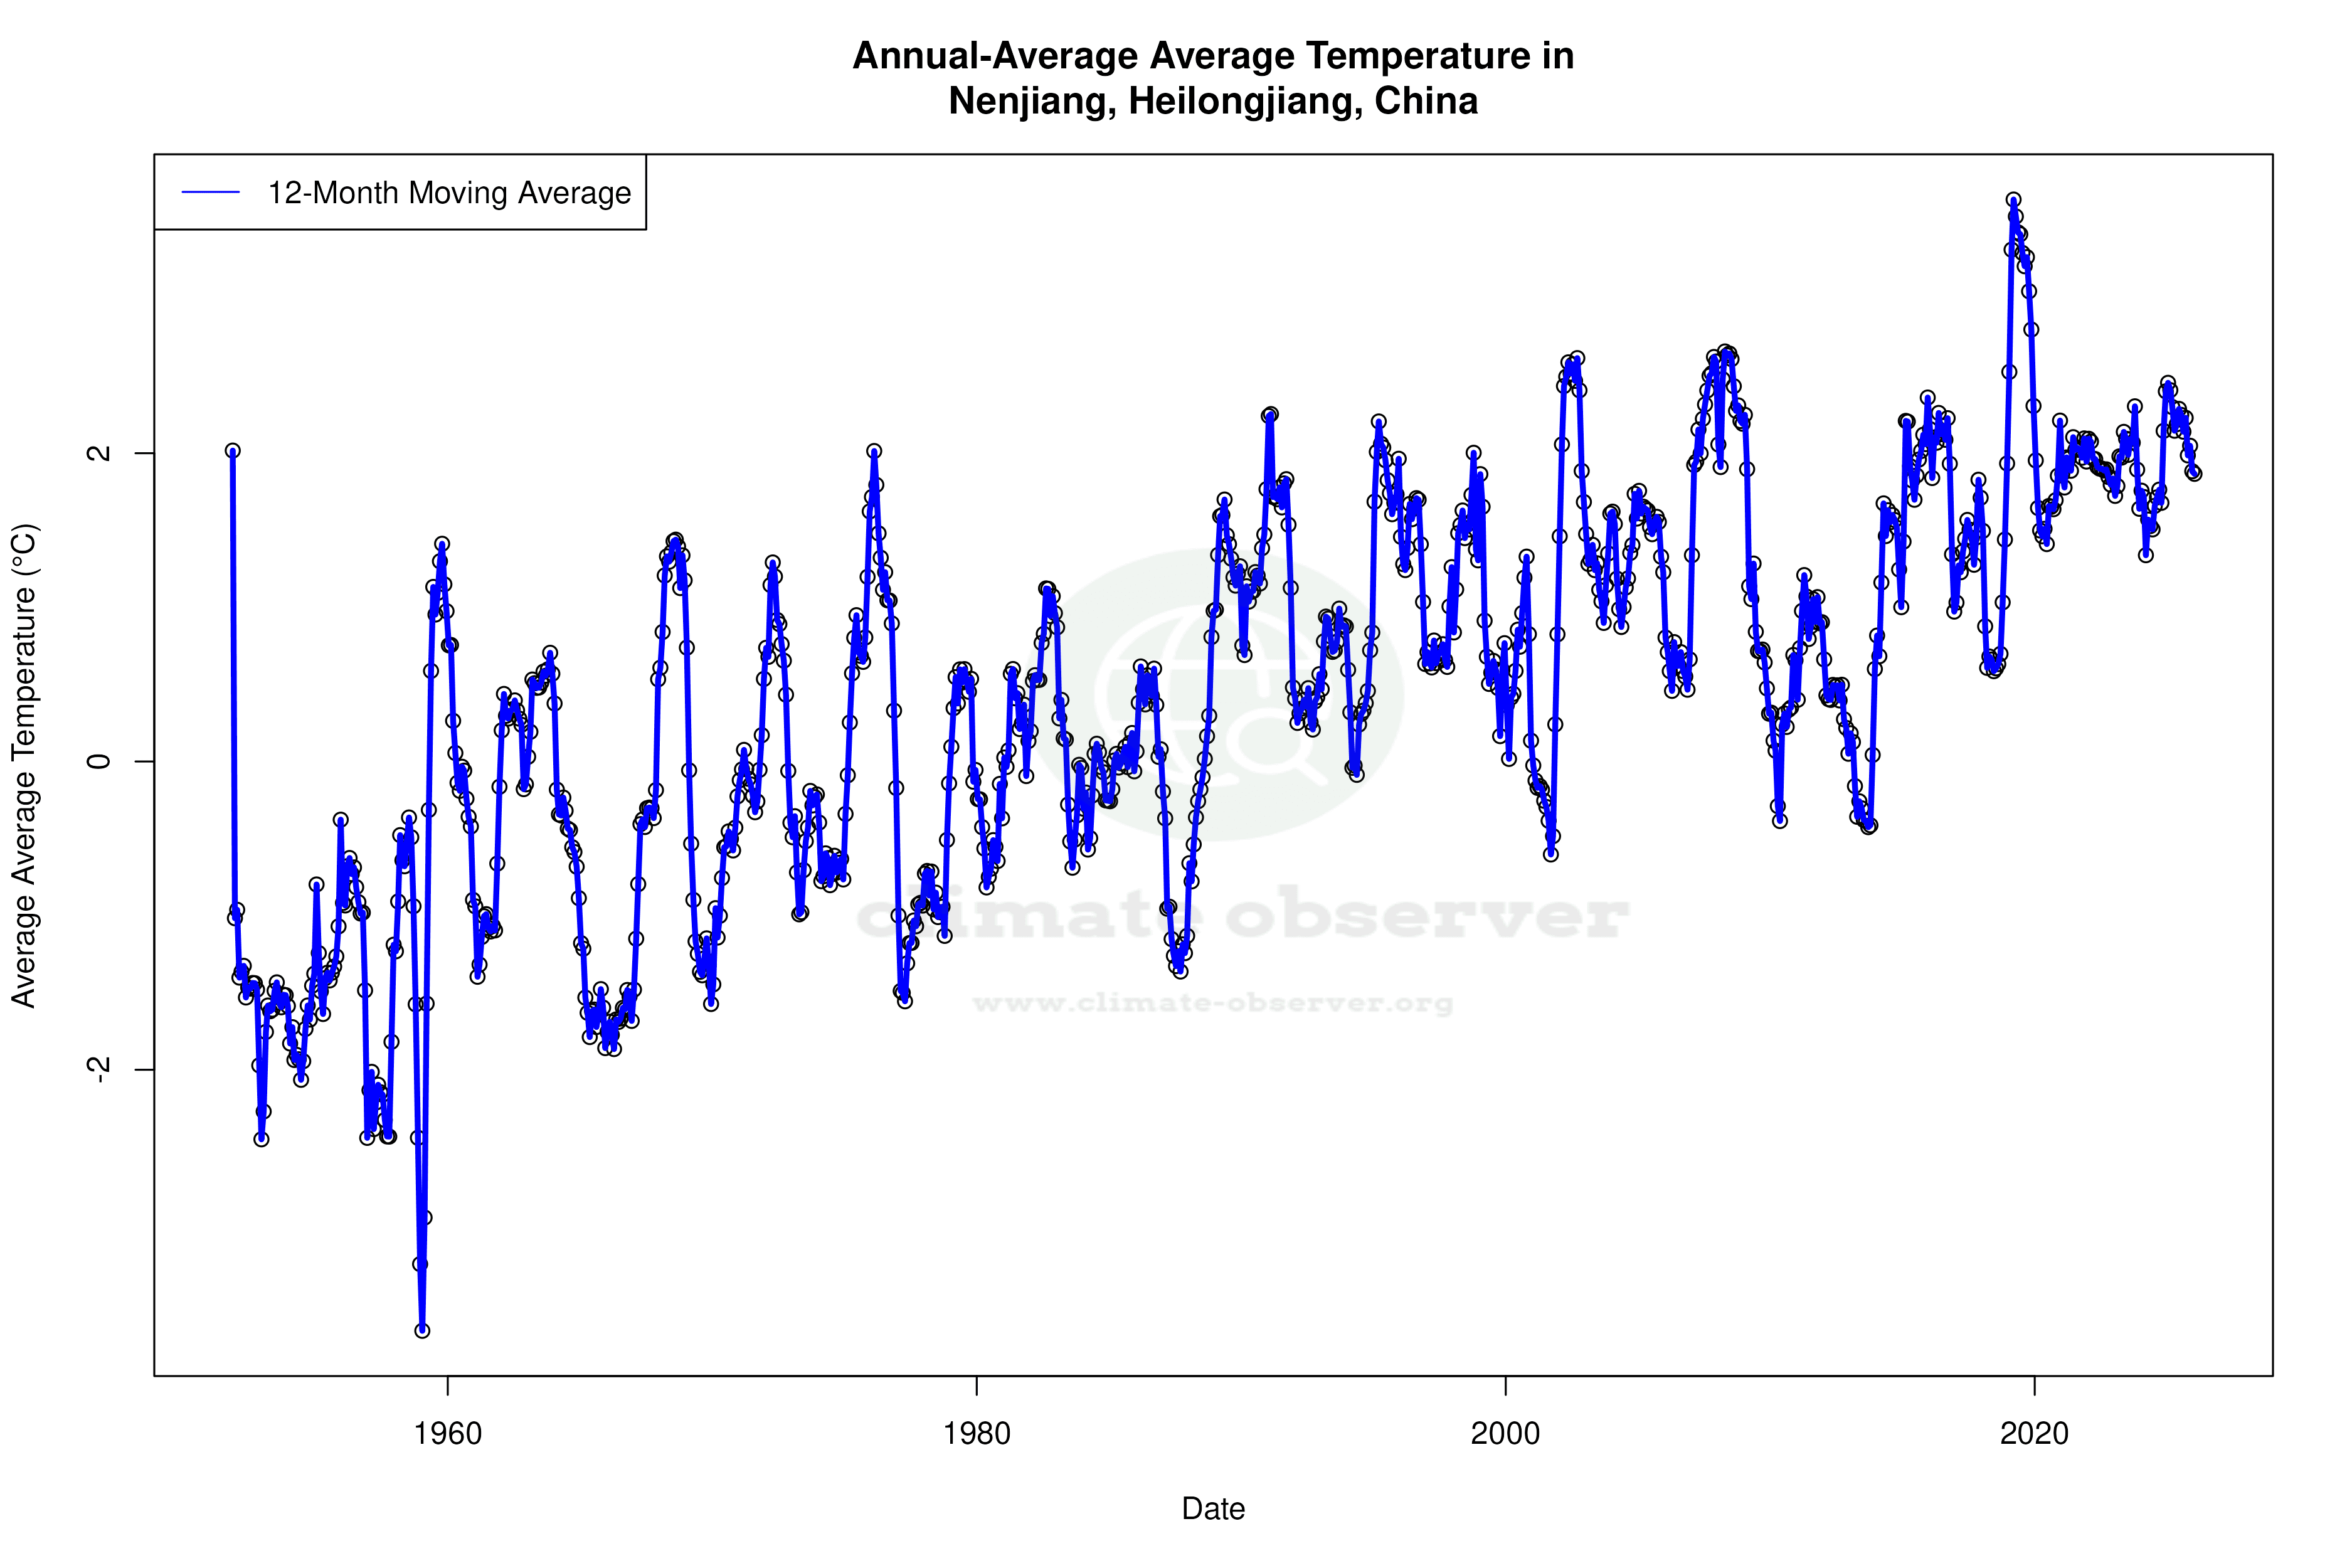


Max Temperature 12-Month MA | 1 of 6
Daily Data Points and Averages Throughout the Year


Average Max Temperature Throughout Year | 1 of 5
