Climate for Station: Hotan, Xinjiang Uygur, China
Loading live weather...
Climate Analysis & Overview
Hotan is experiencing a notable warming trend, with a significant increase in temperature highs over the past decade. The region's precipitation patterns have also shifted, becoming more concentrated, which could have implications for local water resources and agriculture.
Desert Climate Dynamics
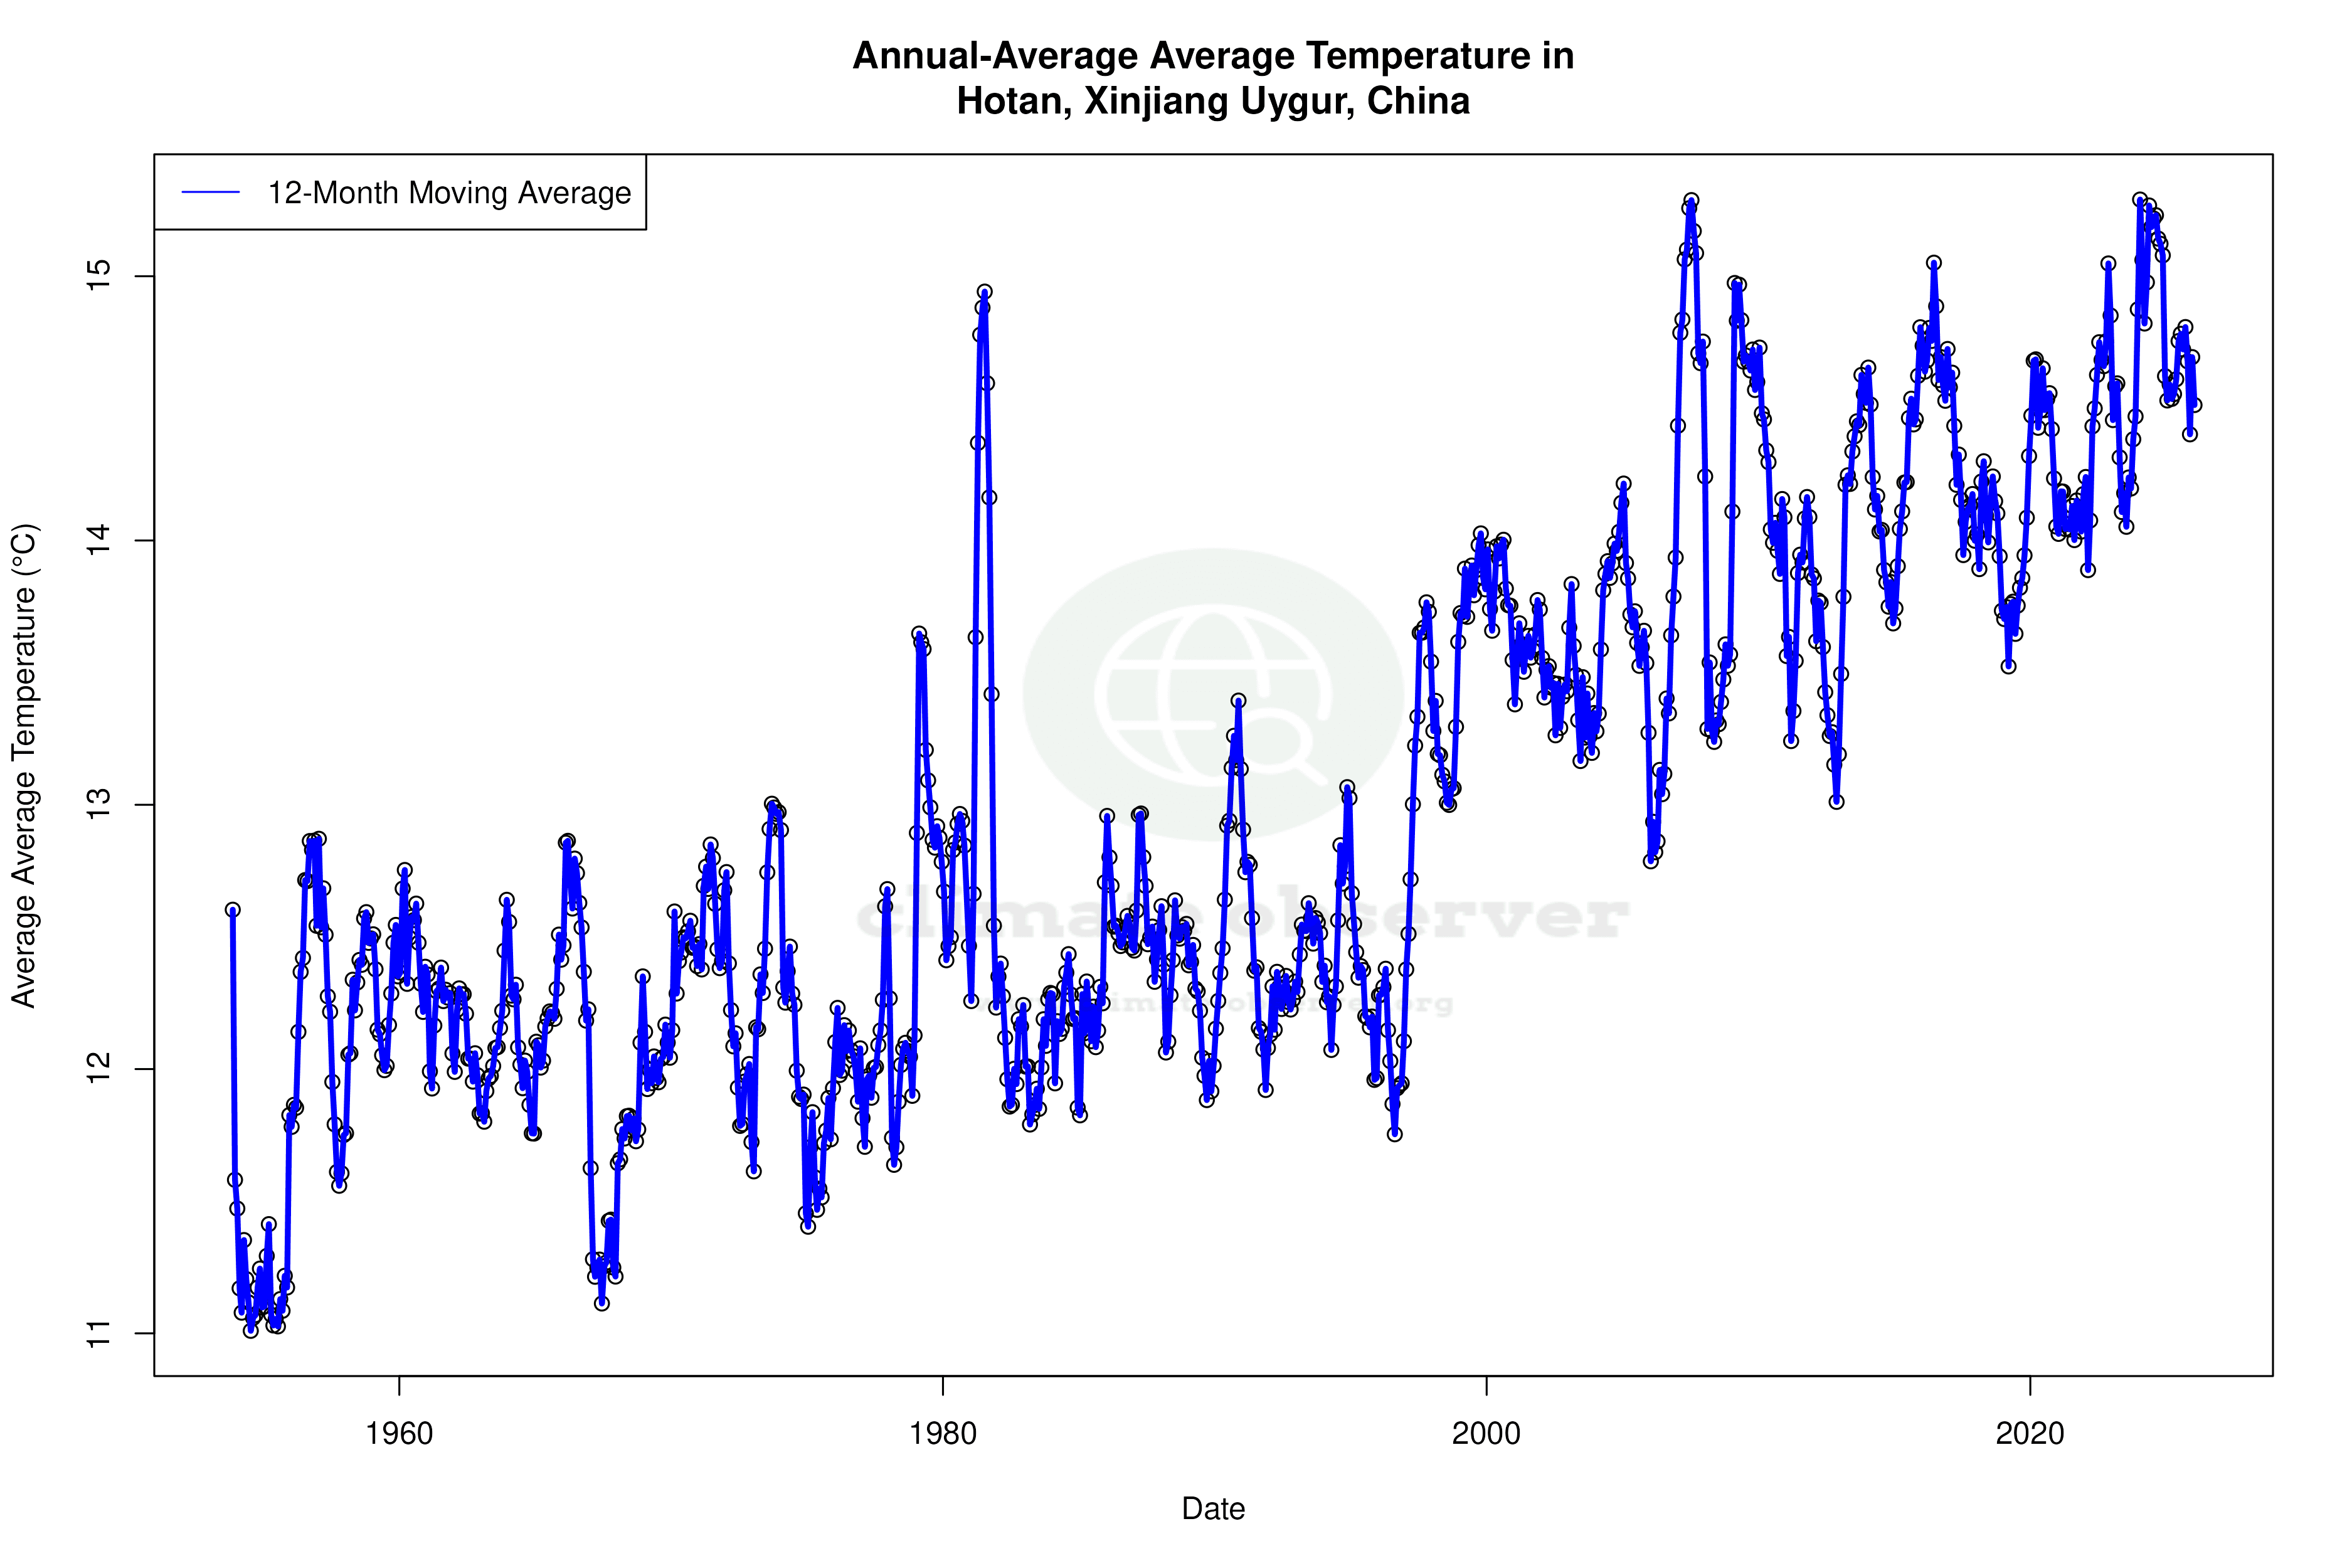
Hotan, located in the Xinjiang Uyghur Autonomous Region of China, is characterised by a desert climate under the Köppen classification (BWh). This arid environment is shaped by the surrounding Taklamakan Desert, which influences its extreme temperature variations and minimal precipitation. Over the last decade, Hotan has seen a significant rise in temperature highs of 2.76°C (4.97°F), indicating a pronounced warming trend. This is contrasted by the all-time trend, which shows a more moderate increase in highs of 0.23°C (0.41°F). Such differences highlight the recent acceleration in warming, likely exacerbated by regional climate changes and human activities.
Temperature Extremes and Trends
The temperature extremes in Hotan are stark, with record highs reaching 41.1°C (106.0°F) and record lows plummeting to -21.6°C (-6.9°F). The all-time trend for lows shows a warming of 0.49°C (0.88°F), suggesting that the region is experiencing milder winters over the long term. This warming of nighttime temperatures can have significant ecological impacts, potentially altering local flora and fauna.
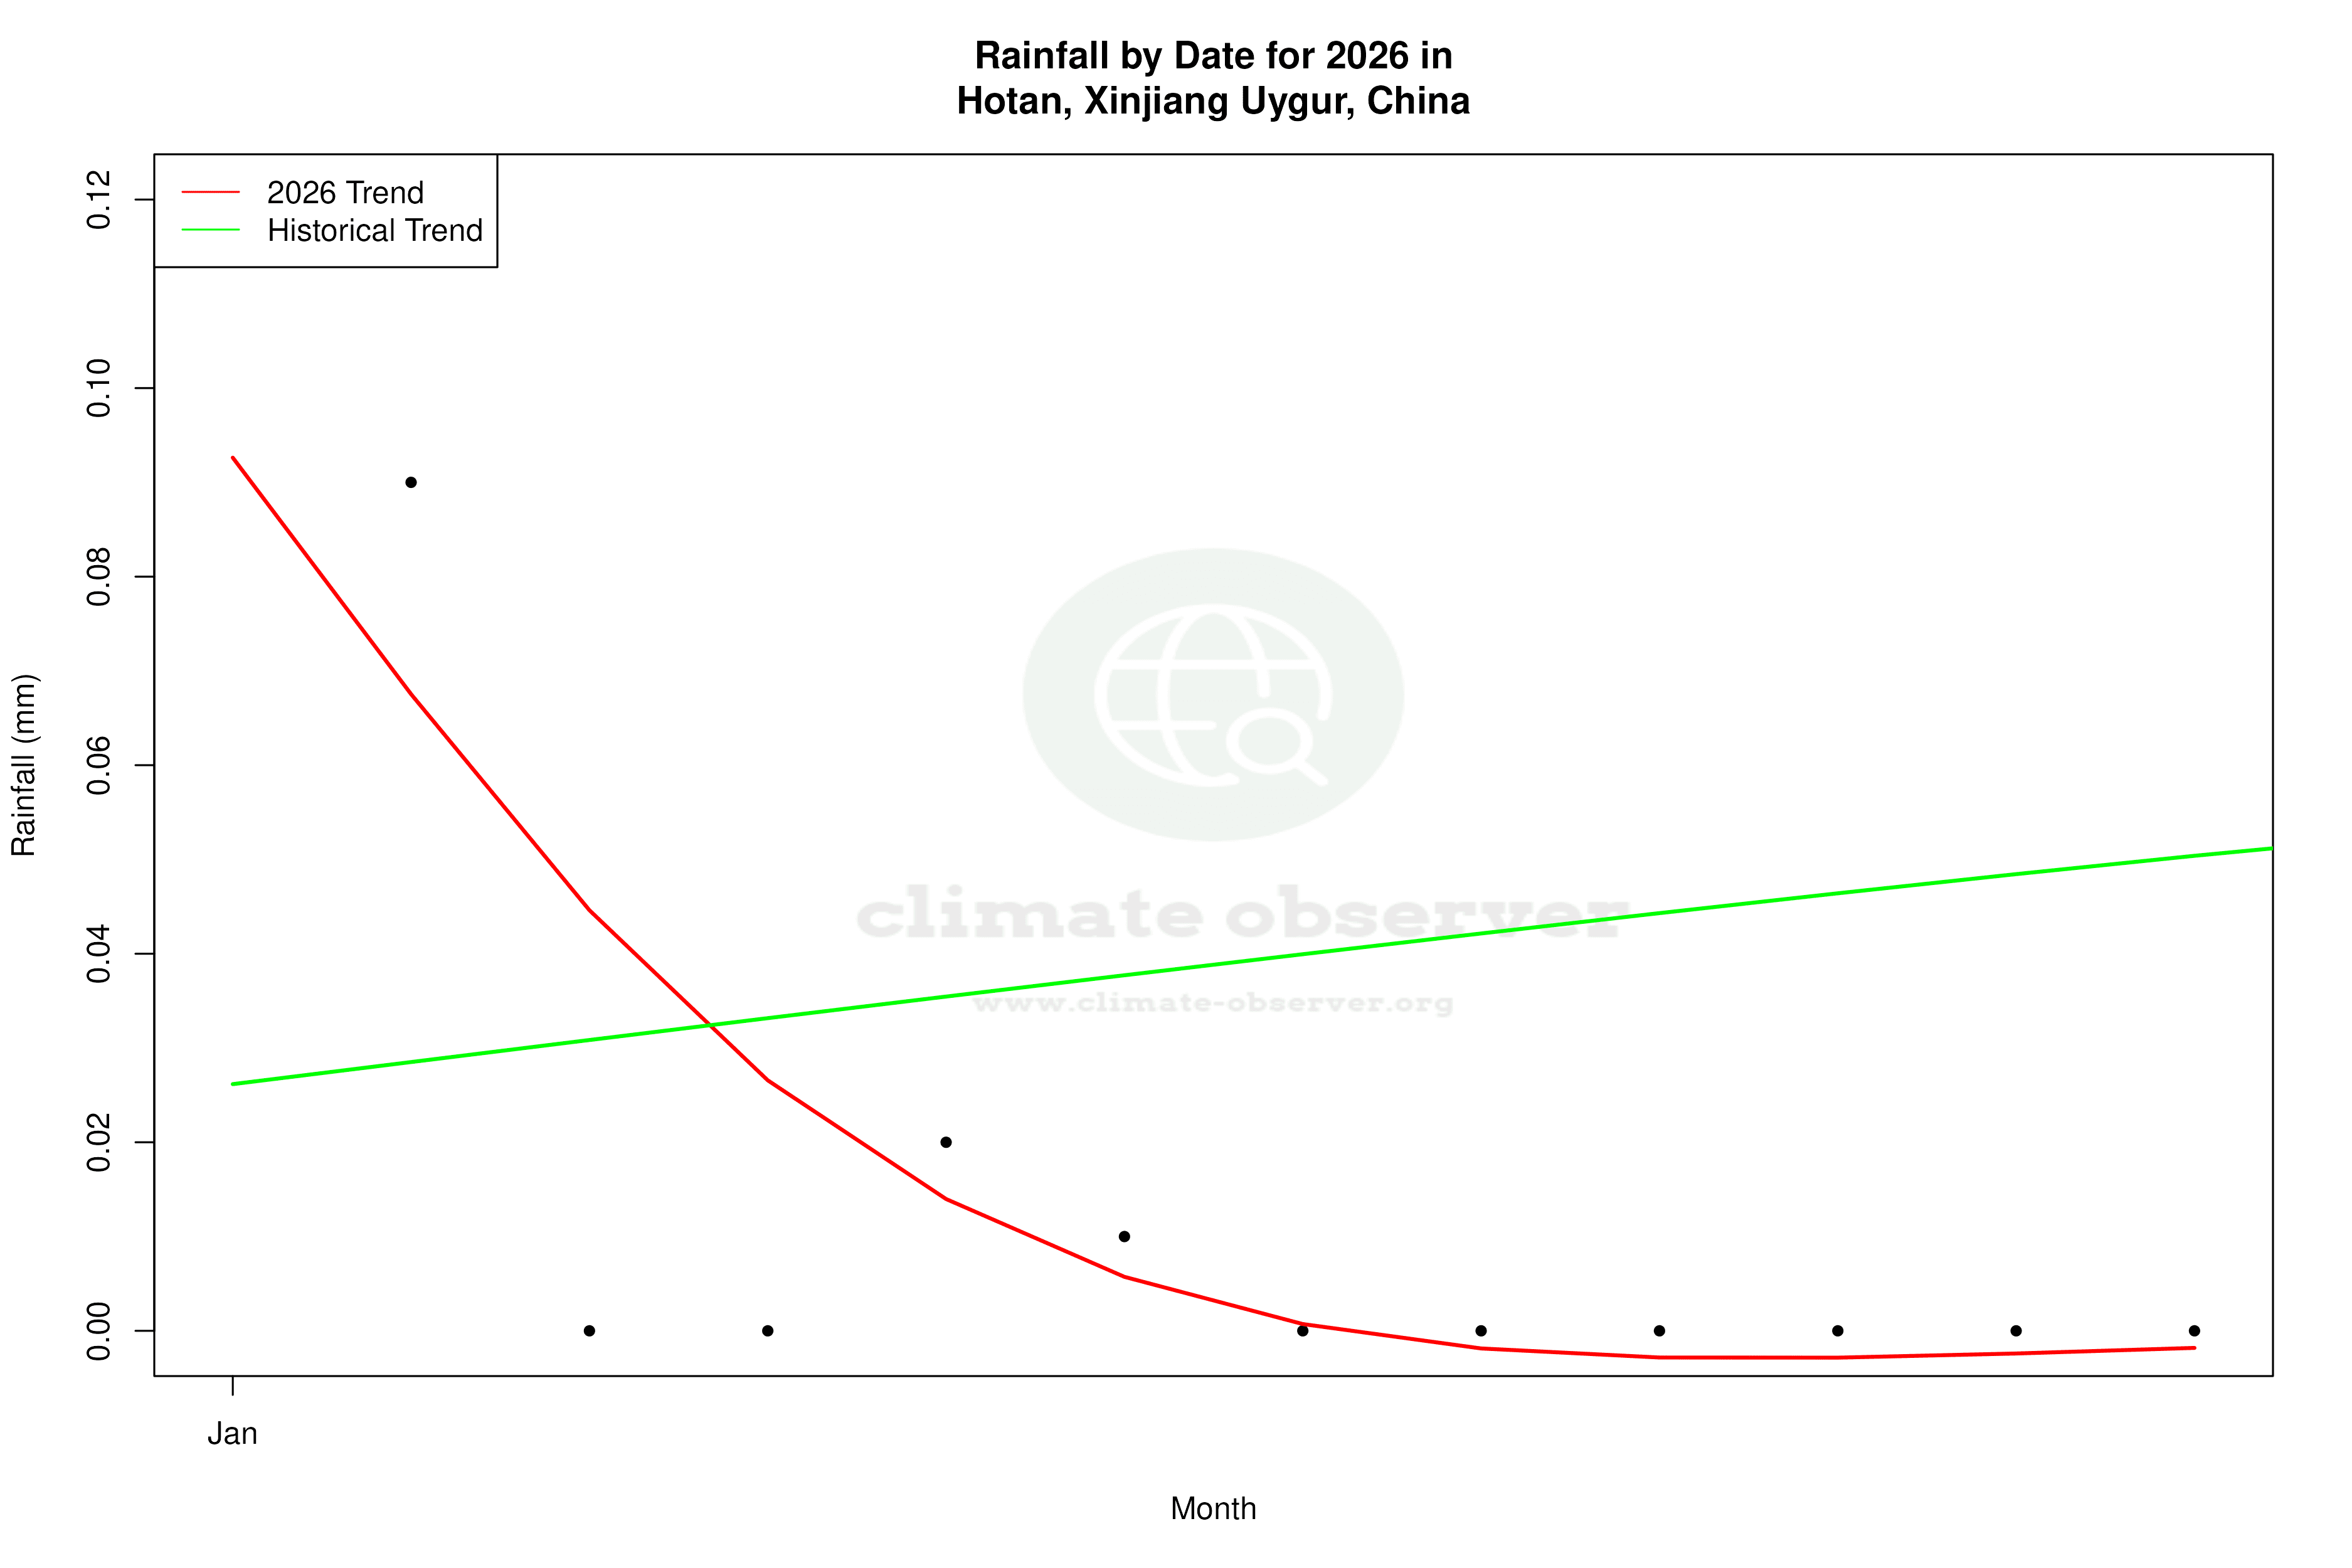
Shifting Precipitation Patterns
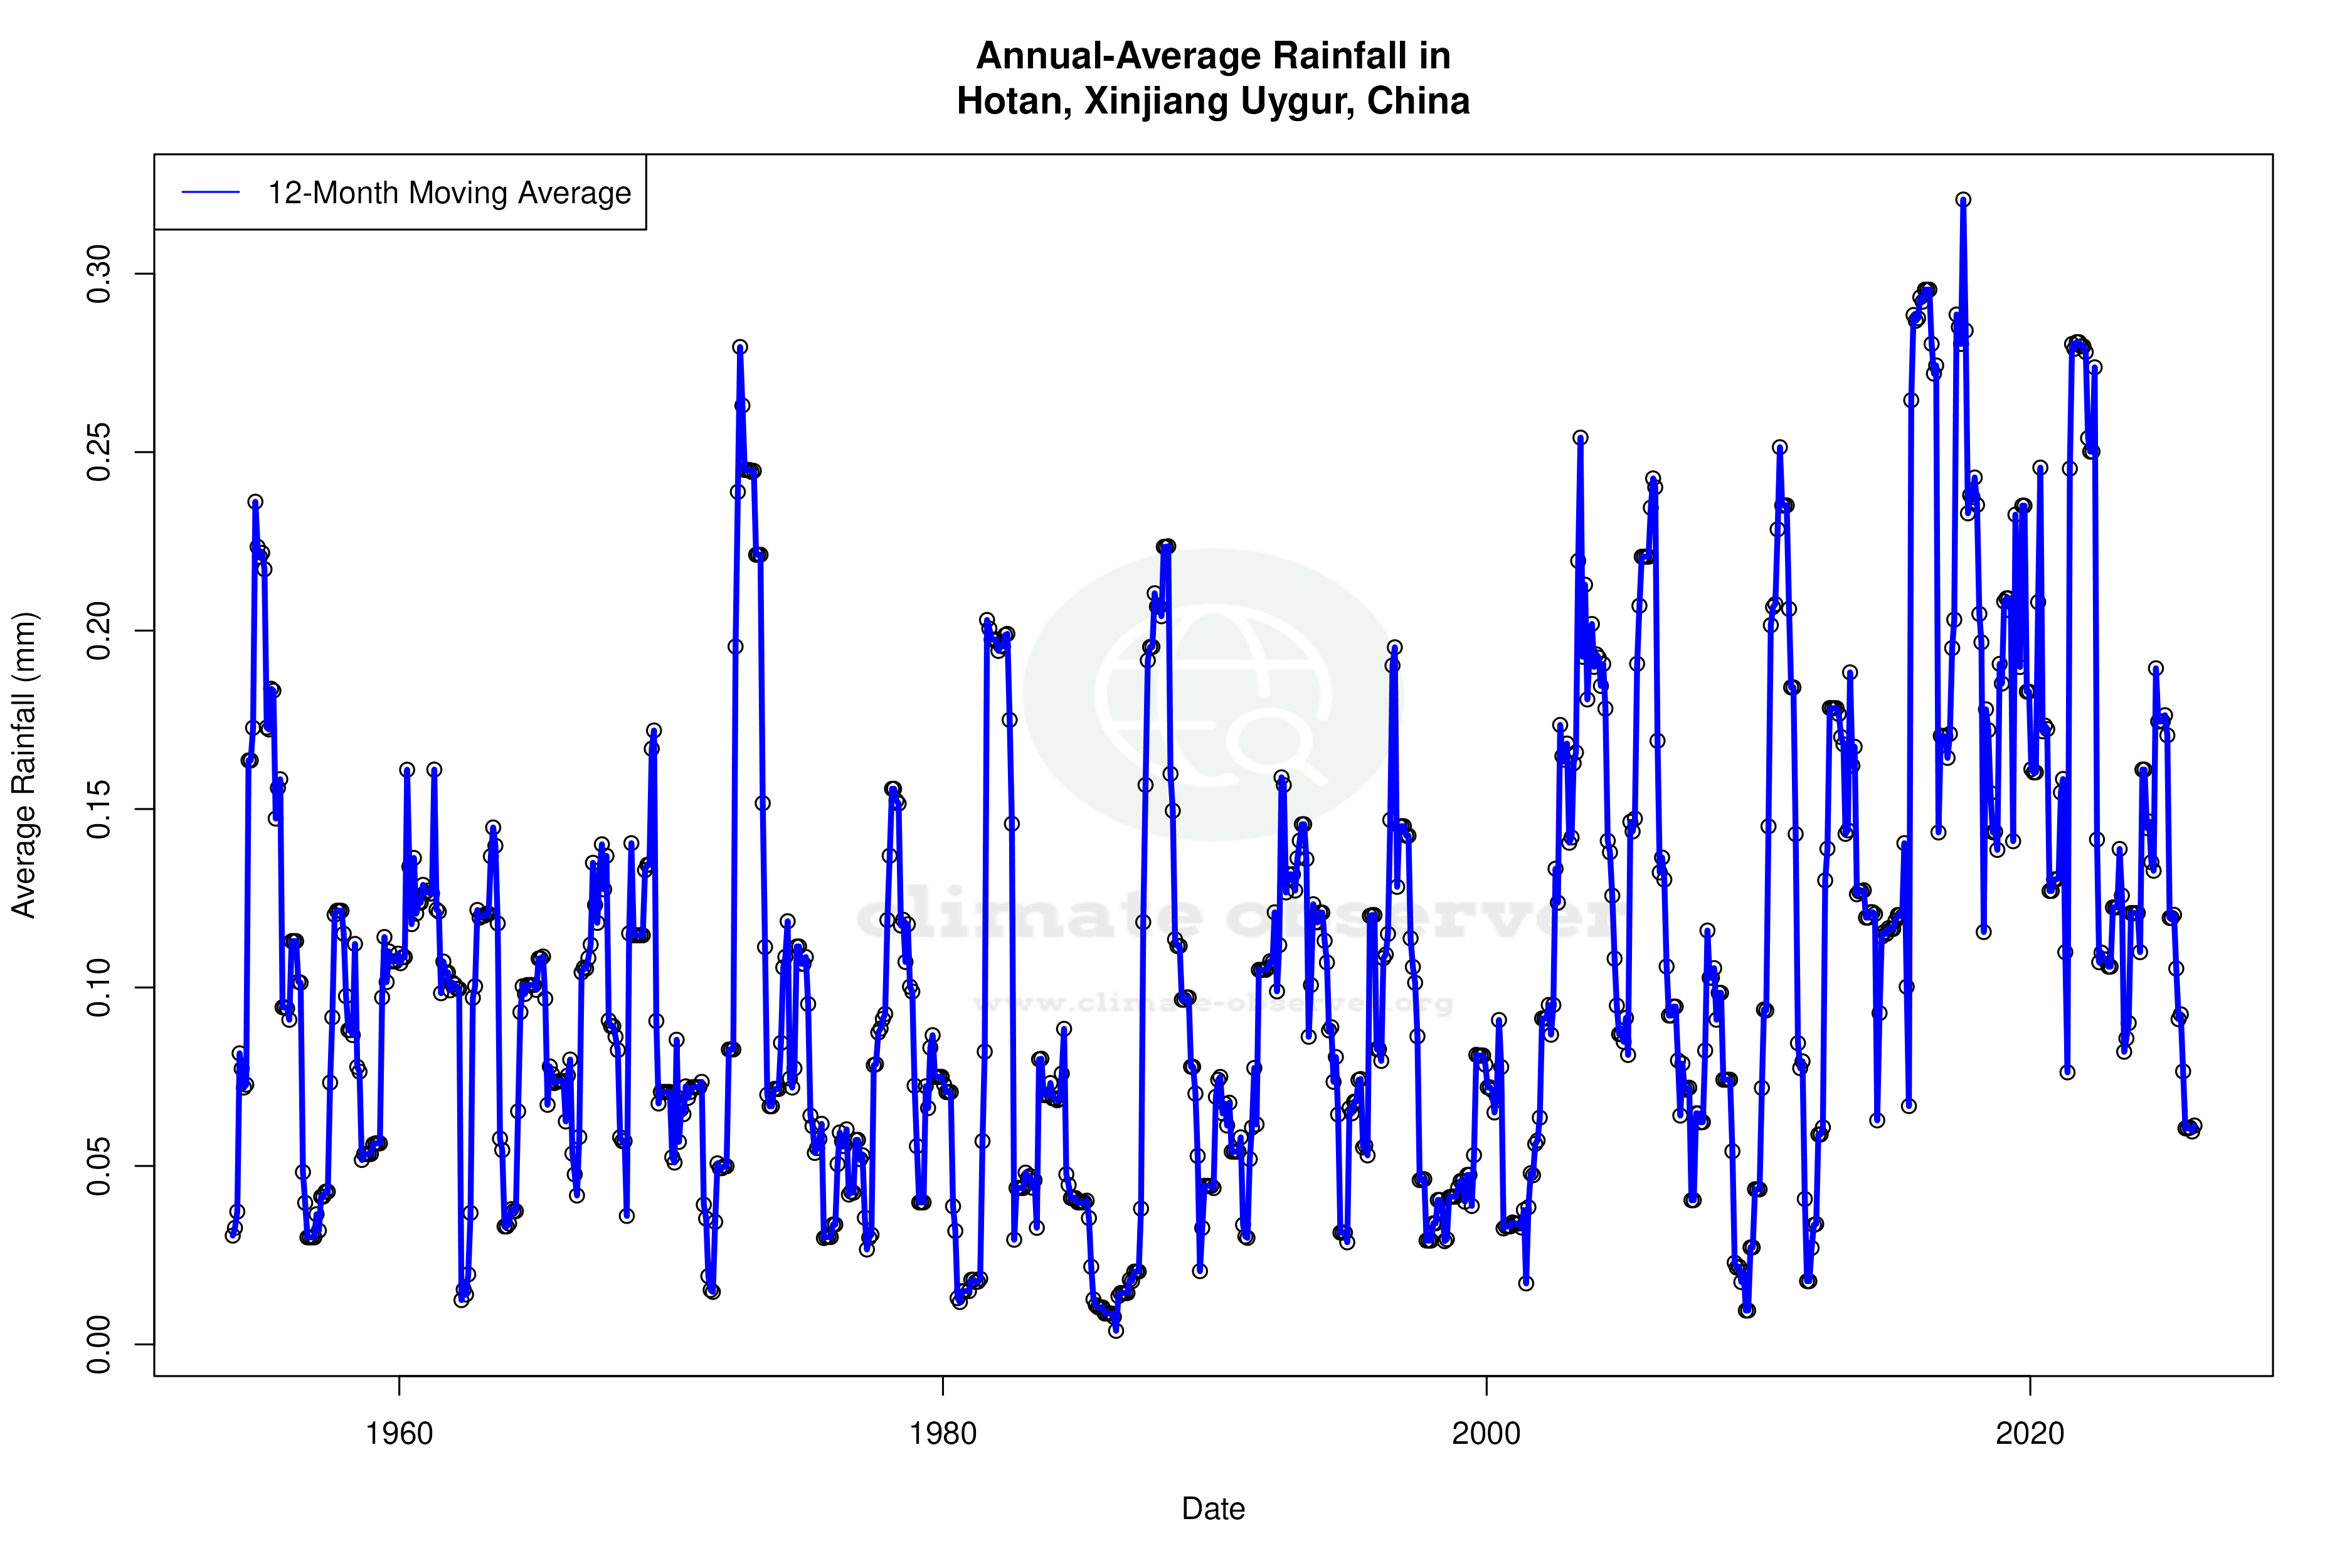
The Precipitation Concentration Index (PCI) in Hotan has increased from a baseline of 31.6 to a current value of 48.8, indicating a significant shift towards more concentrated rainfall events. This means precipitation is occurring in fewer, more intense bursts, which can lead to challenges such as flash flooding and soil erosion. Such concentrated rainfall can strain local infrastructure and water management systems, requiring adaptive measures to mitigate potential impacts.
Implications for Regional Climate Goals
China's regional climate goals focus on sustainable development and climate resilience. The trends observed in Hotan, particularly the accelerated warming and altered precipitation patterns, underscore the need for targeted strategies to address these changes. As China aims to balance economic growth with environmental sustainability, understanding and adapting to these climatic shifts will be crucial. The data from Hotan provides valuable insights into the broader climatic trends affecting the region, highlighting areas where intervention may be necessary to ensure long-term resilience.
Station Statistics
10-Year Trend
High: +2.71 °F/decade
Low: +0.83 °F/decade
Rain: -0.005 in/decade
25-Year Trend
High: -0.39 °F/decade
Low: -0.48 °F/decade
Rain: +0.001 in/decade
50-Year Trend
High: +0.68 °F/decade
Low: +1.23 °F/decade
Rain: +0.001 in/decade
All-Time Trend
High: +0.55 °F/decade
Low: +1.00 °F/decade
Rain: +0.000 in/decade
Percentage Above-Average Days
Last 12 Months: 56.7%
This Year: 62.3%
Precipitation Concentration Index (PCI) ℹ️
Last 12 Months: 23.2
Historical Average: 33.4
Percentile Rank of Last 12 Months ℹ️
High: 61st percentile
Low: 97th percentile
Rain: 41st percentile
Change in Variance ℹ️
High: -6.2%
Low: +2.5%
Intraday: -6.6%
Data Coverage
100.0%
First Year of Data
1953
Station Location
Historical Weather Records
| Max High | Avg High | Min High | Max Avg | Avg Avg | Min Avg | Max Low | Avg Low | Min Low | Max Precipitation | Avg Precipitation | Max Snow | Avg Snow | |
|---|---|---|---|---|---|---|---|---|---|---|---|---|---|
| Record | 105.98 °F | — | 6.08 °F | 93.20 °F | — | -0.58 °F | 83.48 °F | — | -6.88 °F | 2.61 in | — | — | — |
| January | 68.90 °F | 33.78 °F | 6.08 °F | 51.98 °F | 24.11 °F | -0.58 °F | 41.36 °F | 15.93 °F | -6.88 °F | 0.24 in | 0.00 in | — | — |
| February | 71.60 °F | 43.76 °F | 13.10 °F | 55.04 °F | 33.84 °F | 4.82 °F | 45.86 °F | 25.14 °F | -2.74 °F | 0.38 in | 0.00 in | — | — |
| March | 87.98 °F | 60.64 °F | 30.92 °F | 74.30 °F | 49.63 °F | 24.44 °F | 68.18 °F | 39.24 °F | 19.40 °F | 0.31 in | 0.00 in | — | — |
| April | 95.72 °F | 74.39 °F | 44.06 °F | 82.22 °F | 62.60 °F | 36.68 °F | 71.06 °F | 51.29 °F | 31.64 °F | 0.62 in | 0.00 in | — | — |
| May | 99.68 °F | 81.73 °F | 48.92 °F | 84.56 °F | 70.01 °F | 43.88 °F | 79.16 °F | 58.96 °F | 35.06 °F | 0.66 in | 0.01 in | — | — |
| June | 103.64 °F | 87.79 °F | 61.88 °F | 90.14 °F | 75.92 °F | 54.68 °F | 83.48 °F | 65.07 °F | 46.58 °F | 1.70 in | 0.01 in | — | — |
| July | 105.98 °F | 91.03 °F | 67.28 °F | 93.20 °F | 78.85 °F | 59.90 °F | 83.48 °F | 68.13 °F | 52.52 °F | 0.63 in | 0.01 in | — | — |
| August | 104.36 °F | 88.57 °F | 63.68 °F | 91.04 °F | 76.53 °F | 58.10 °F | 83.48 °F | 66.27 °F | 48.20 °F | 2.61 in | 0.01 in | — | — |
| September | 96.62 °F | 81.18 °F | 50.90 °F | 82.22 °F | 68.79 °F | 45.86 °F | 75.56 °F | 57.92 °F | 39.74 °F | 0.82 in | 0.00 in | — | — |
| October | 87.62 °F | 68.89 °F | 40.10 °F | 73.22 °F | 55.72 °F | 34.16 °F | 63.86 °F | 44.35 °F | 24.80 °F | 0.34 in | 0.00 in | — | — |
| November | 77.00 °F | 52.32 °F | 19.76 °F | 62.78 °F | 40.61 °F | 15.62 °F | 52.34 °F | 31.10 °F | 8.06 °F | 0.42 in | 0.00 in | — | — |
| December | 70.16 °F | 37.34 °F | 9.14 °F | 52.52 °F | 27.54 °F | 3.02 °F | 41.00 °F | 19.71 °F | -2.74 °F | 0.23 in | 0.00 in | — | — |
Data Visualisations
Remove WatermarksCurrent Year Climate Trends vs Historical

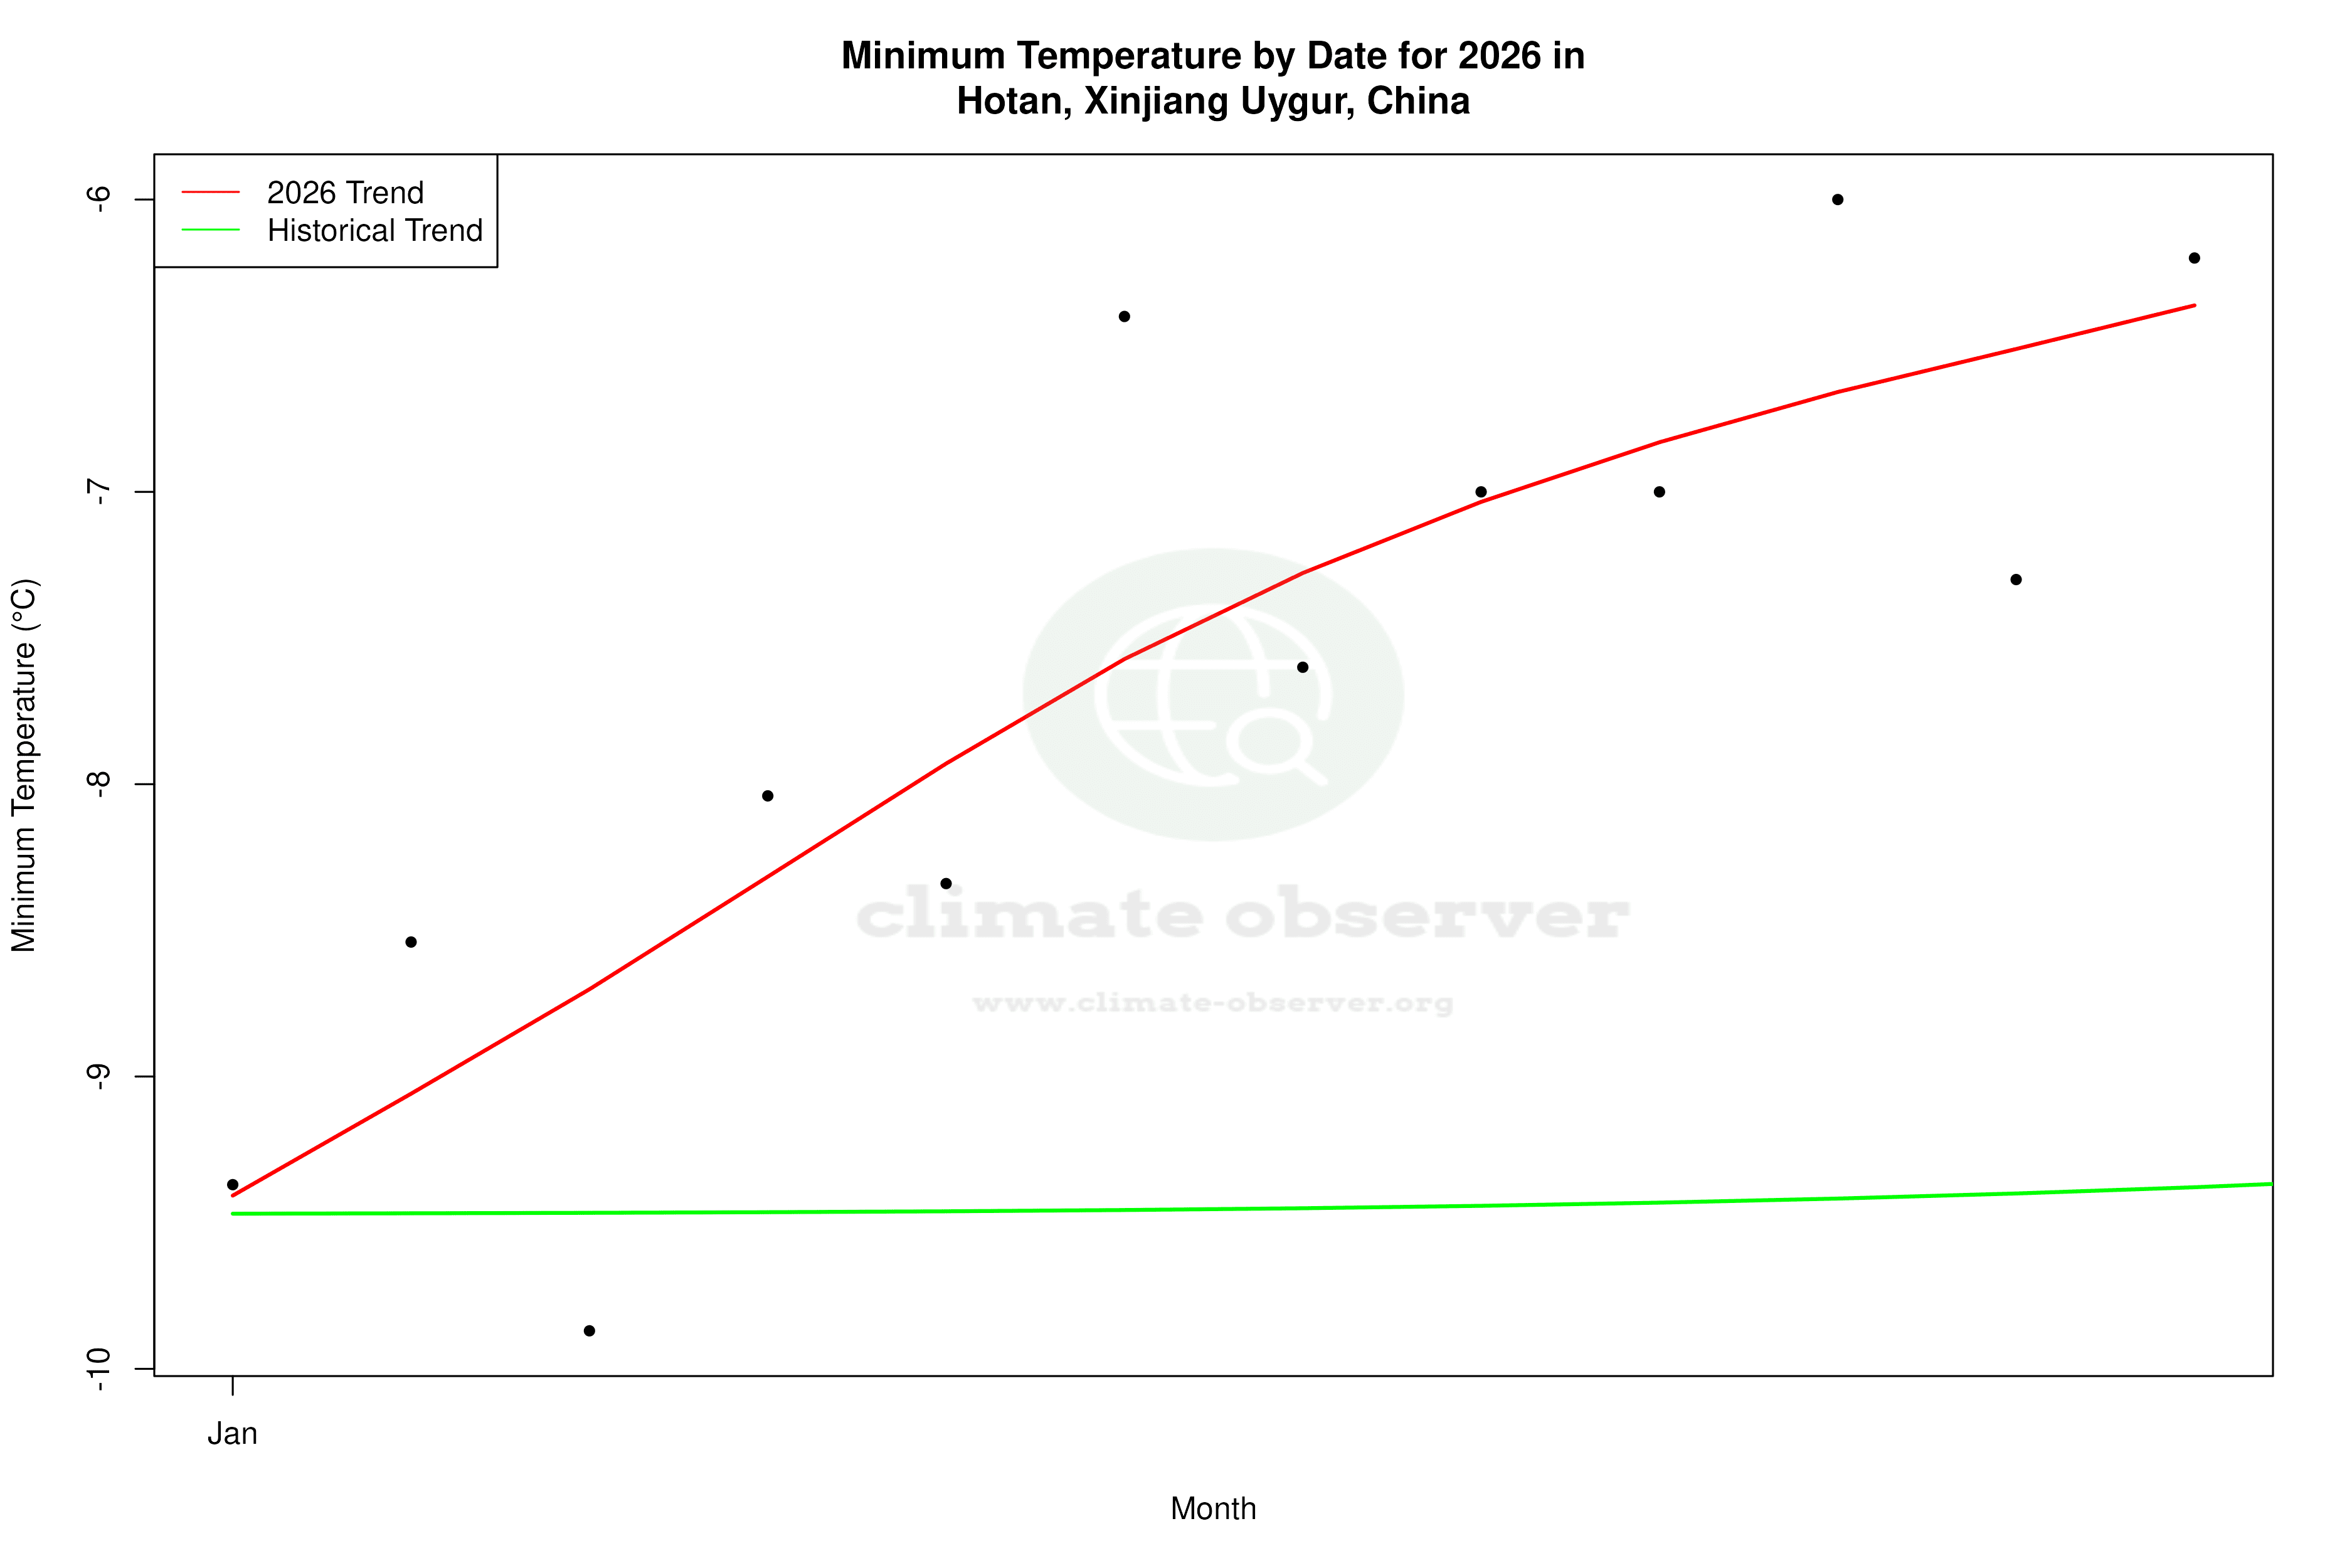


Max Temperature this Year | 1 of 6
Climate 12-Month Moving Averages


Max Temperature 12-Month MA | 1 of 6
Daily Data Points and Averages Throughout the Year
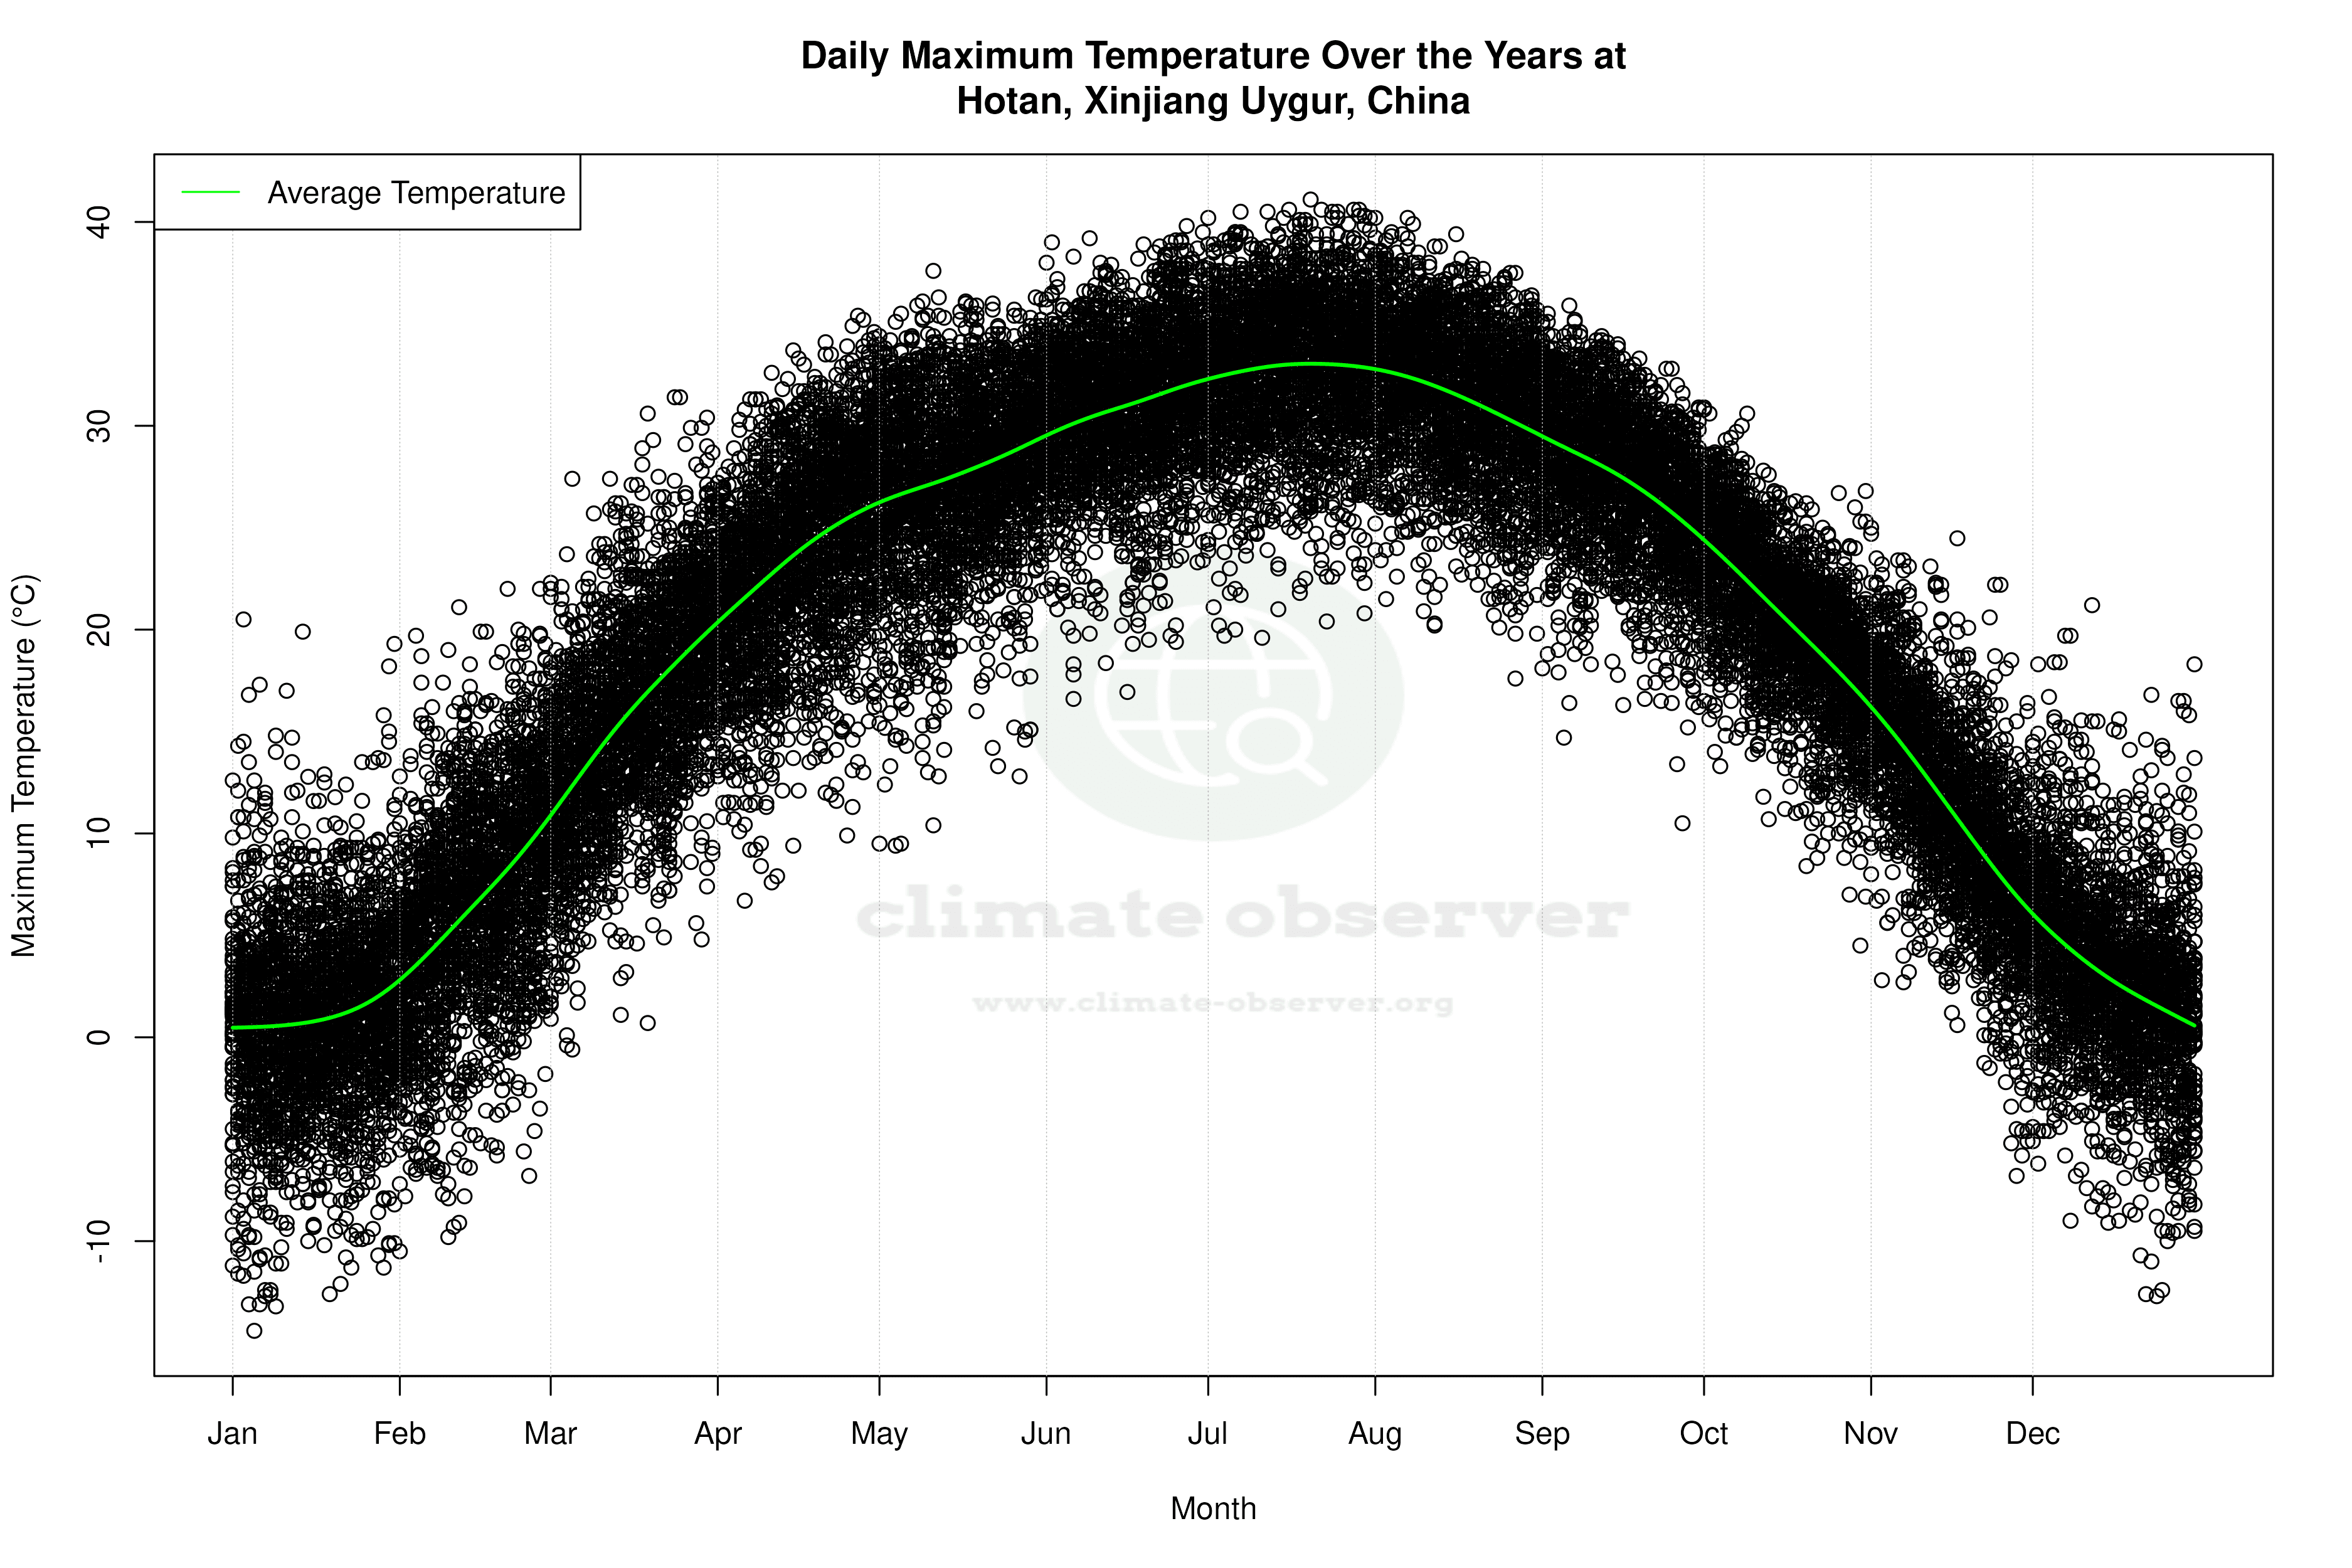
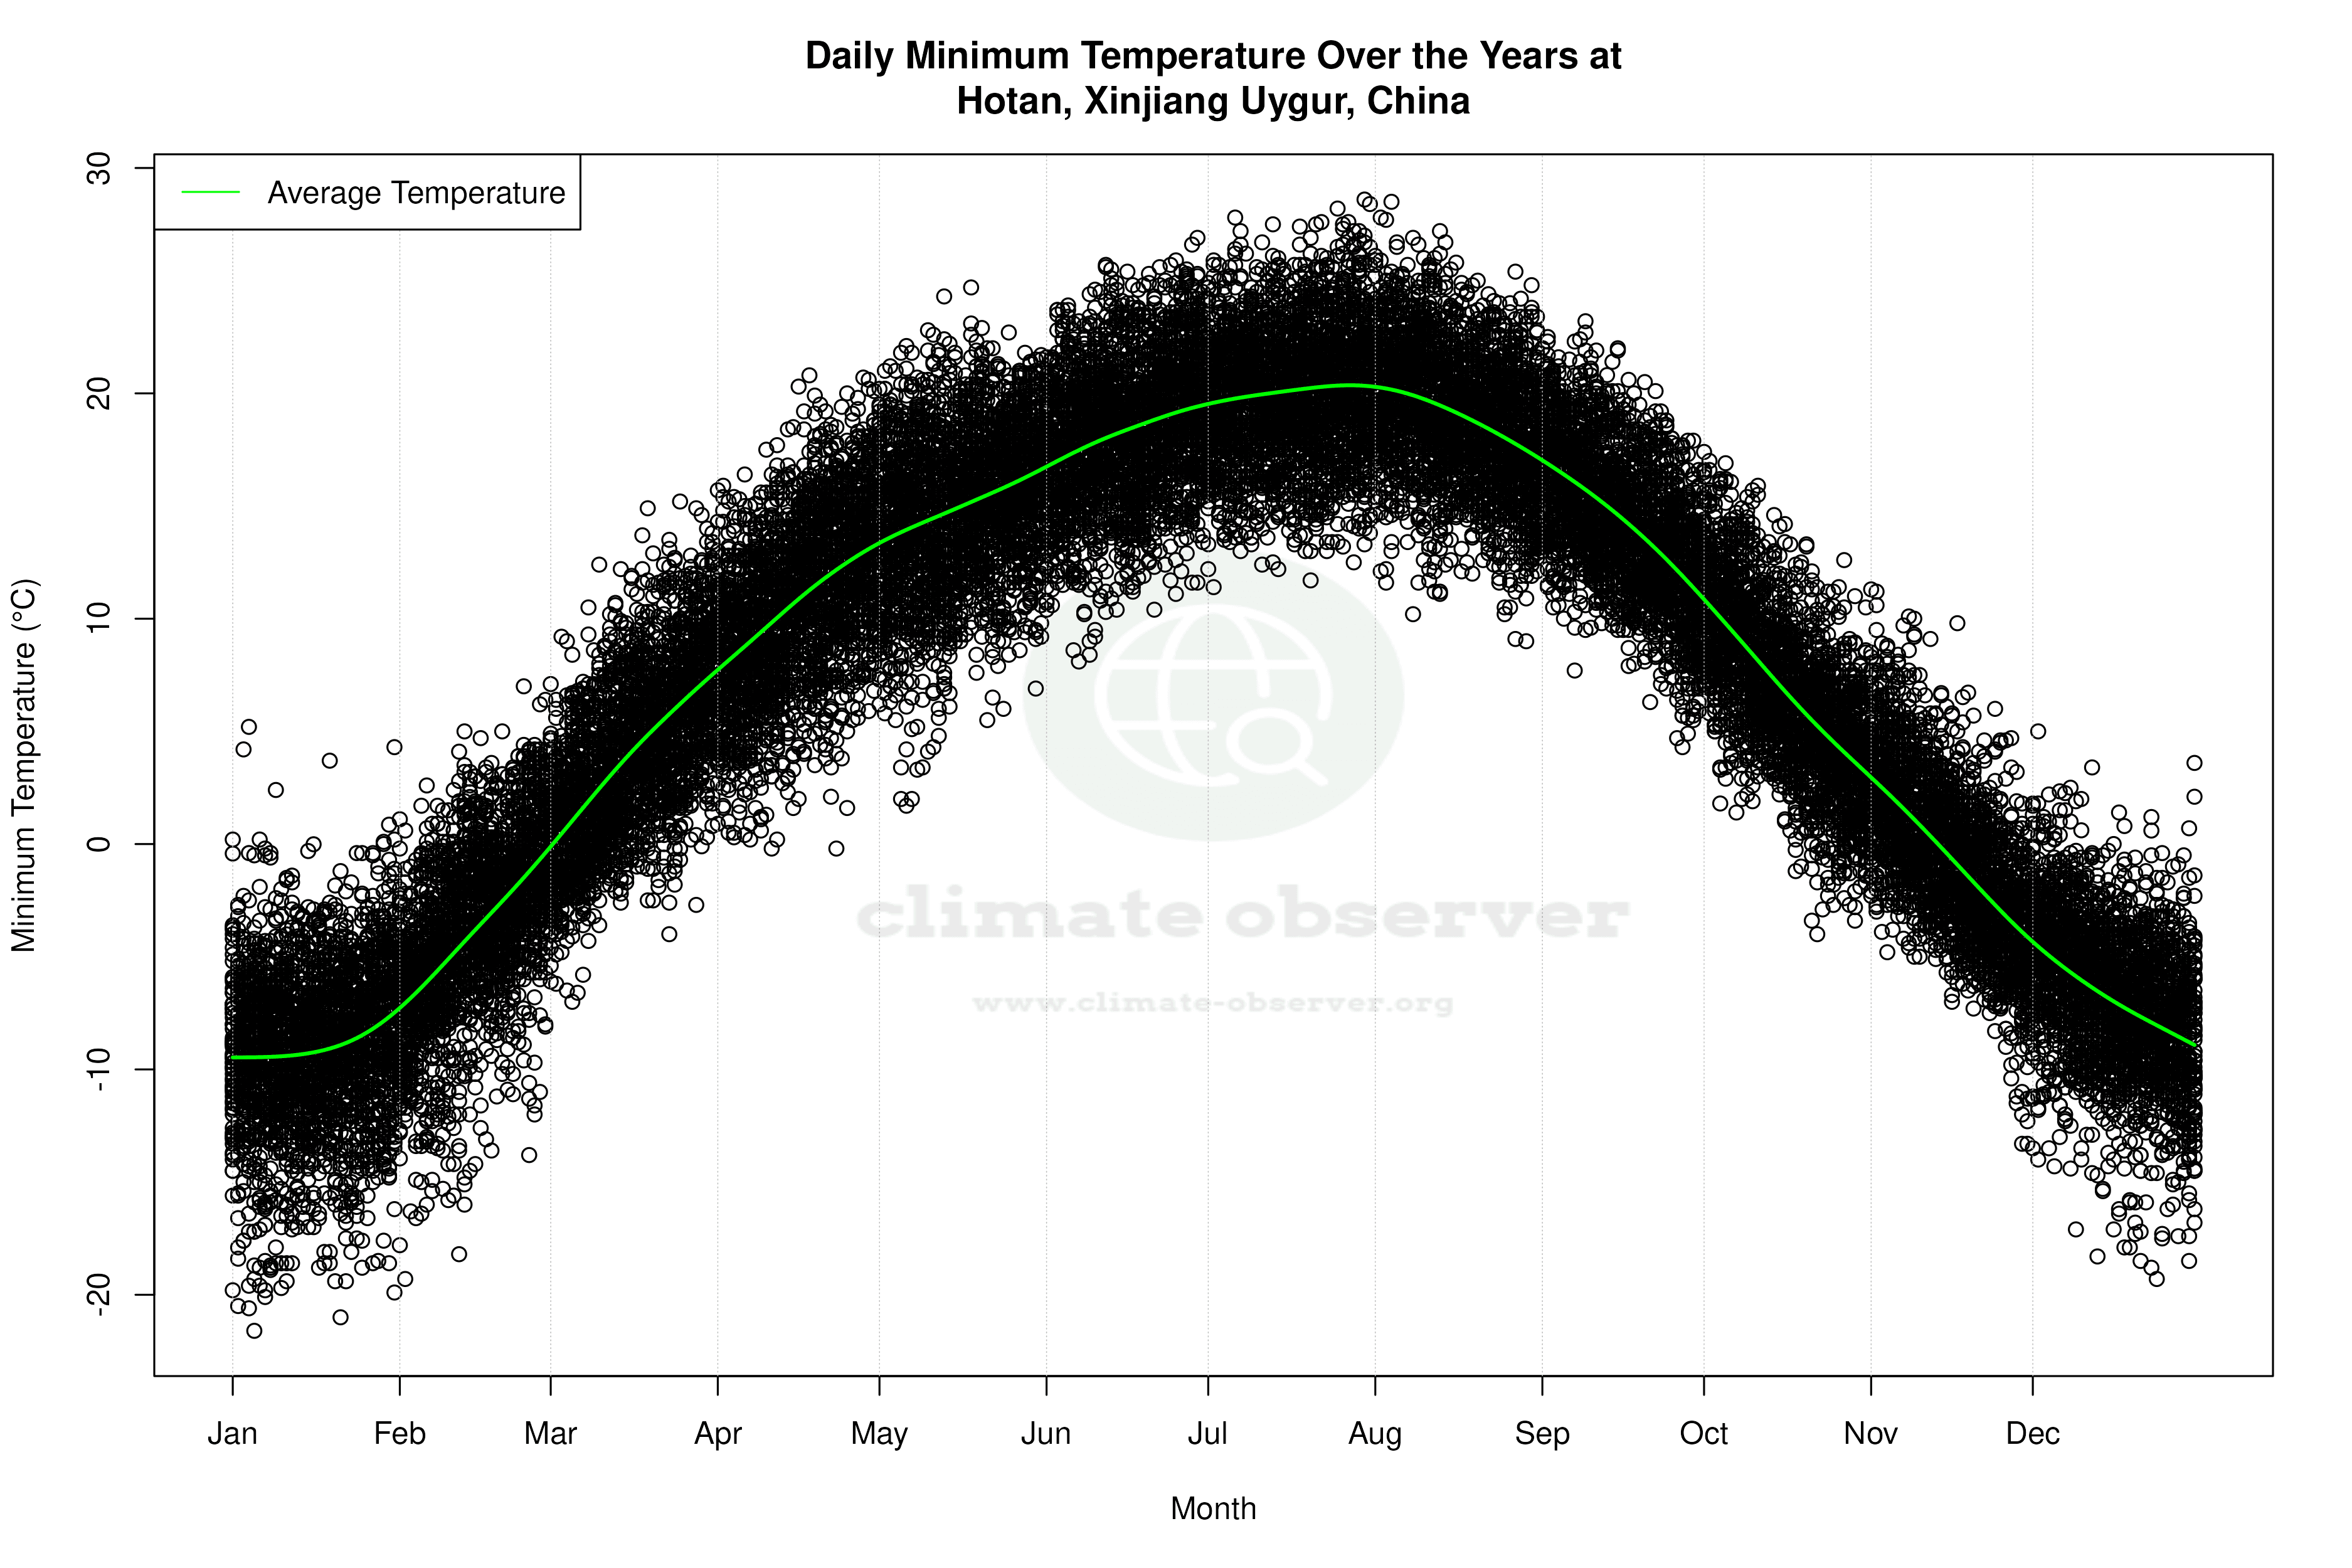
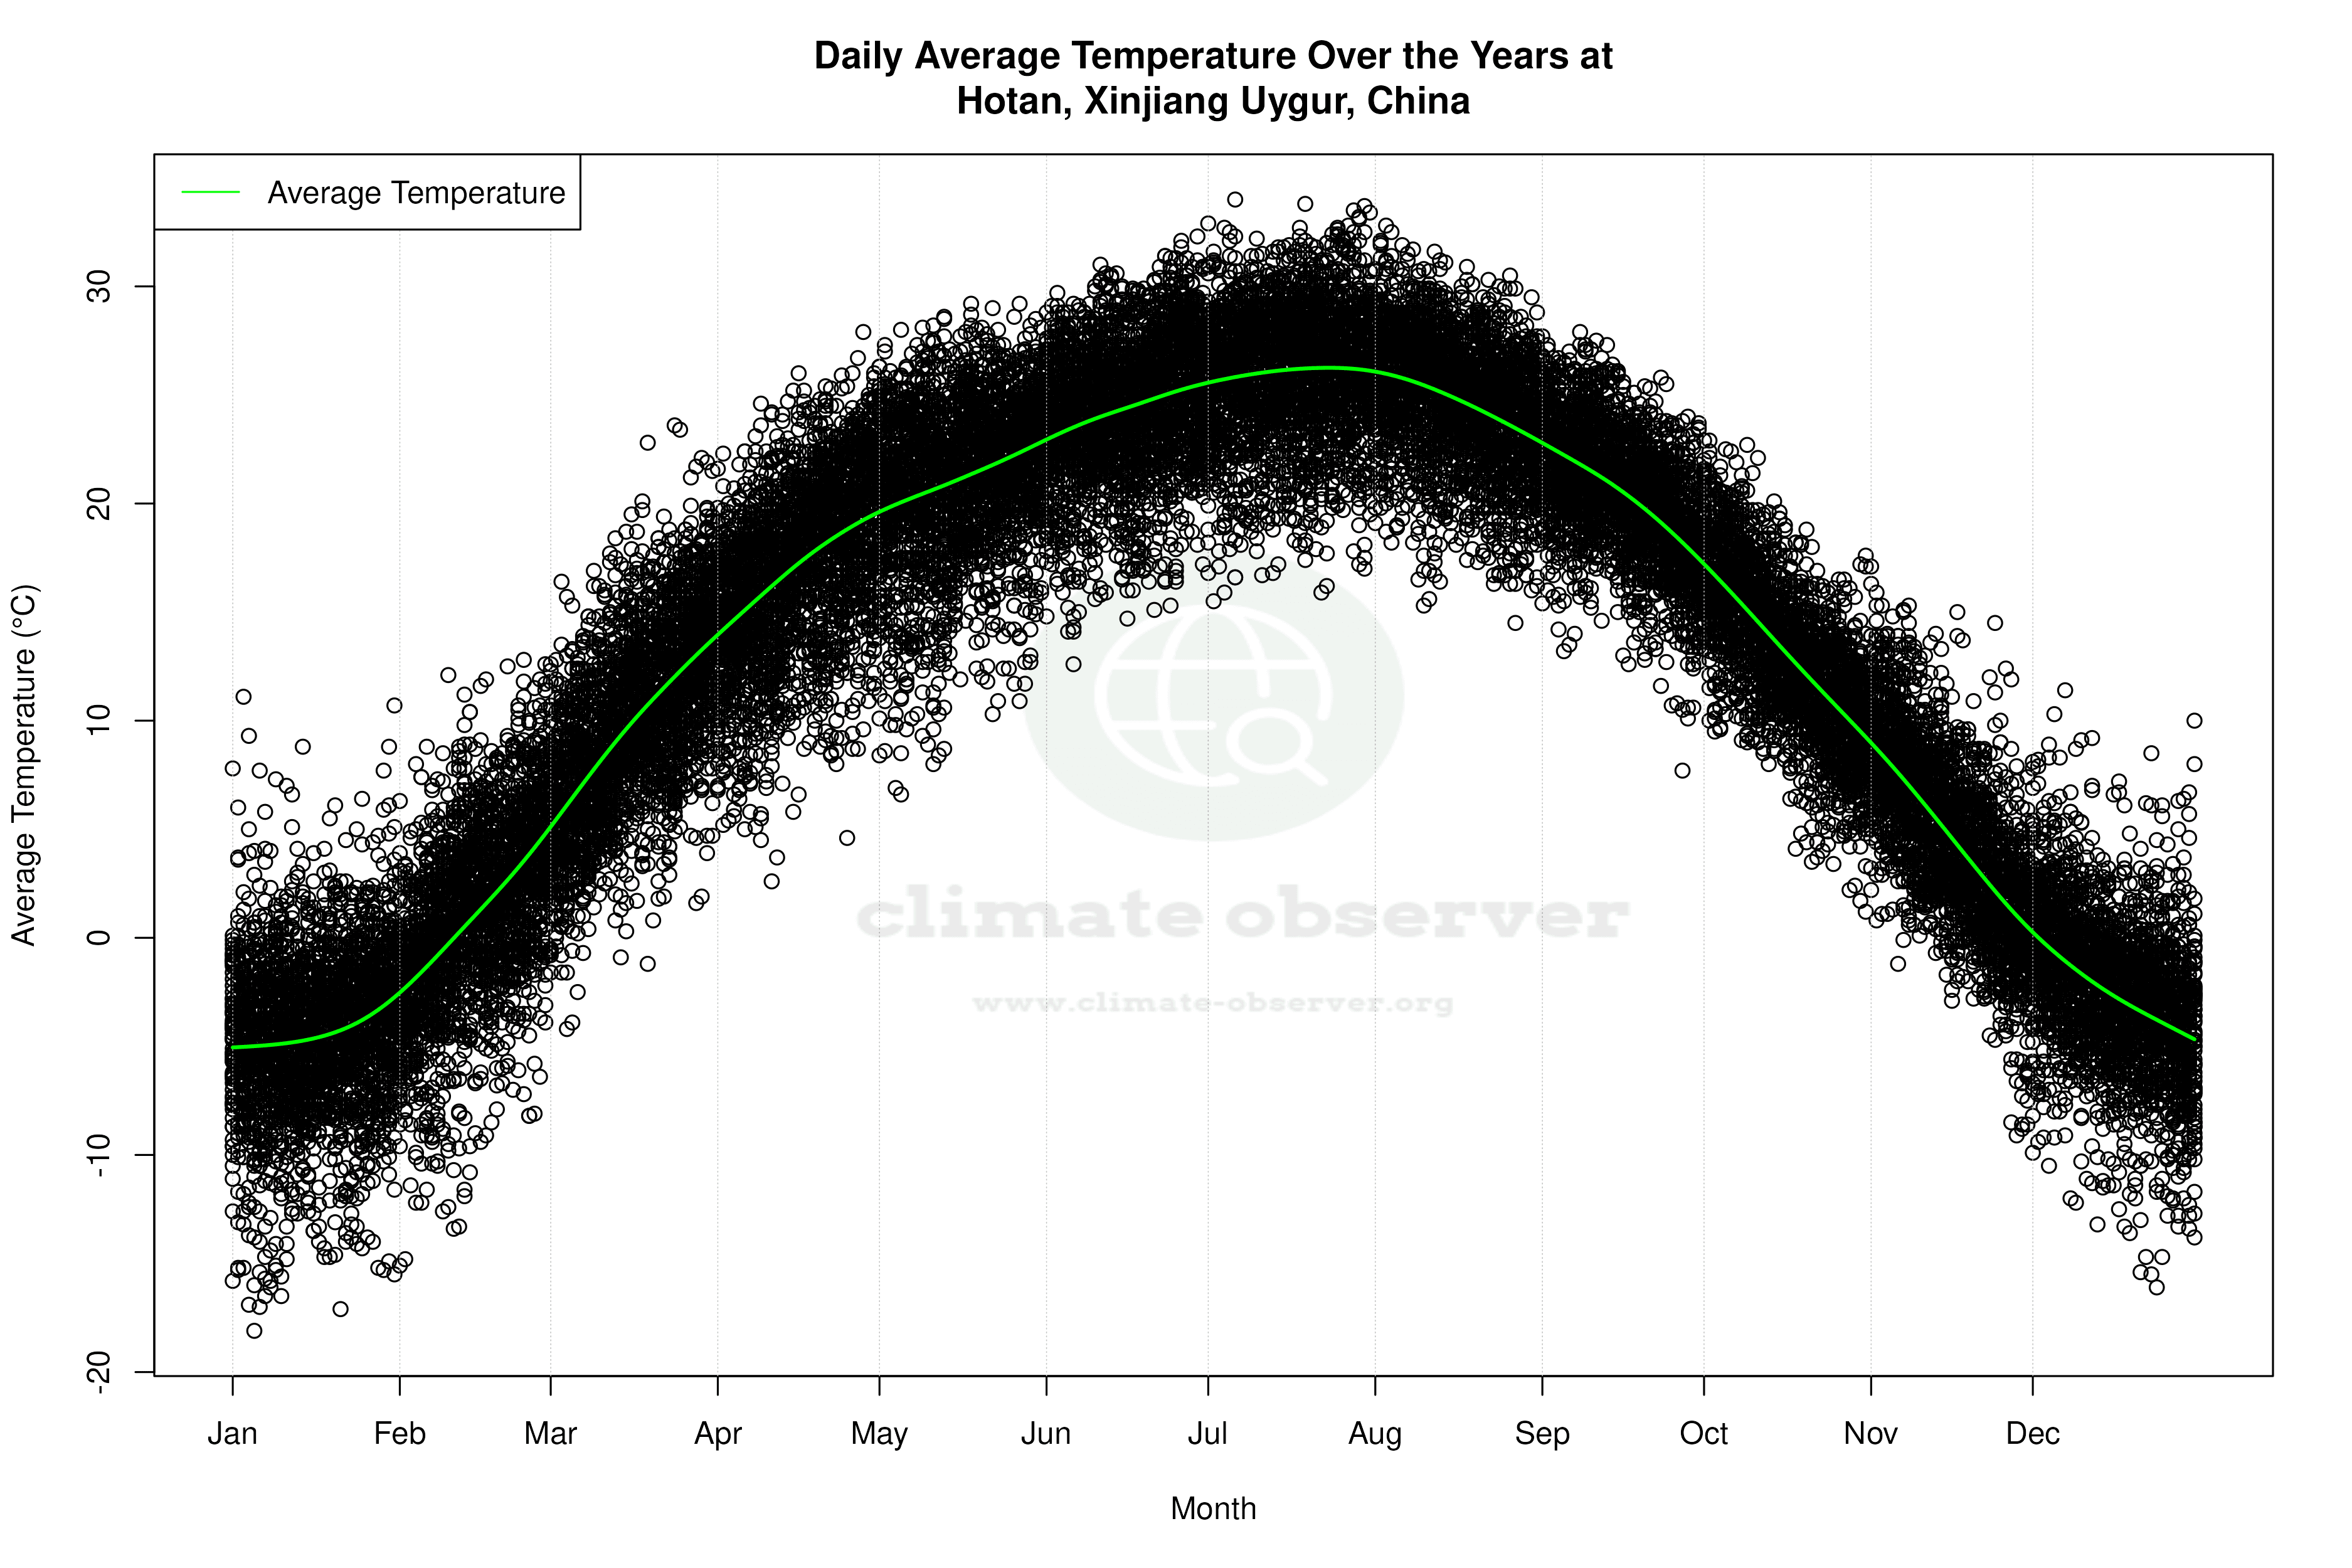


Average Max Temperature Throughout Year | 1 of 5
