Climate for Station: Jiuquan, Gansu, China
Loading live weather...
Climate Analysis & Overview
Jiuquan's climate is marked by a long-term warming trend in high temperatures and a cooling trend in lows over the past decade. The region experiences less concentrated precipitation now compared to historical norms, indicating a shift towards more evenly distributed rainfall.
Köppen Classification and Local Geography
Jiuquan, located in the Gansu province of China, falls under the BSk category of the Köppen climate classification, indicative of a cold semi-arid climate. The city's geographical position, nestled between mountain ranges and desert landscapes, heavily influences its weather patterns. These natural barriers contribute to significant temperature variations and limited precipitation, typical of semi-arid regions.
Temperature Trends: A Tale of Two Extremes
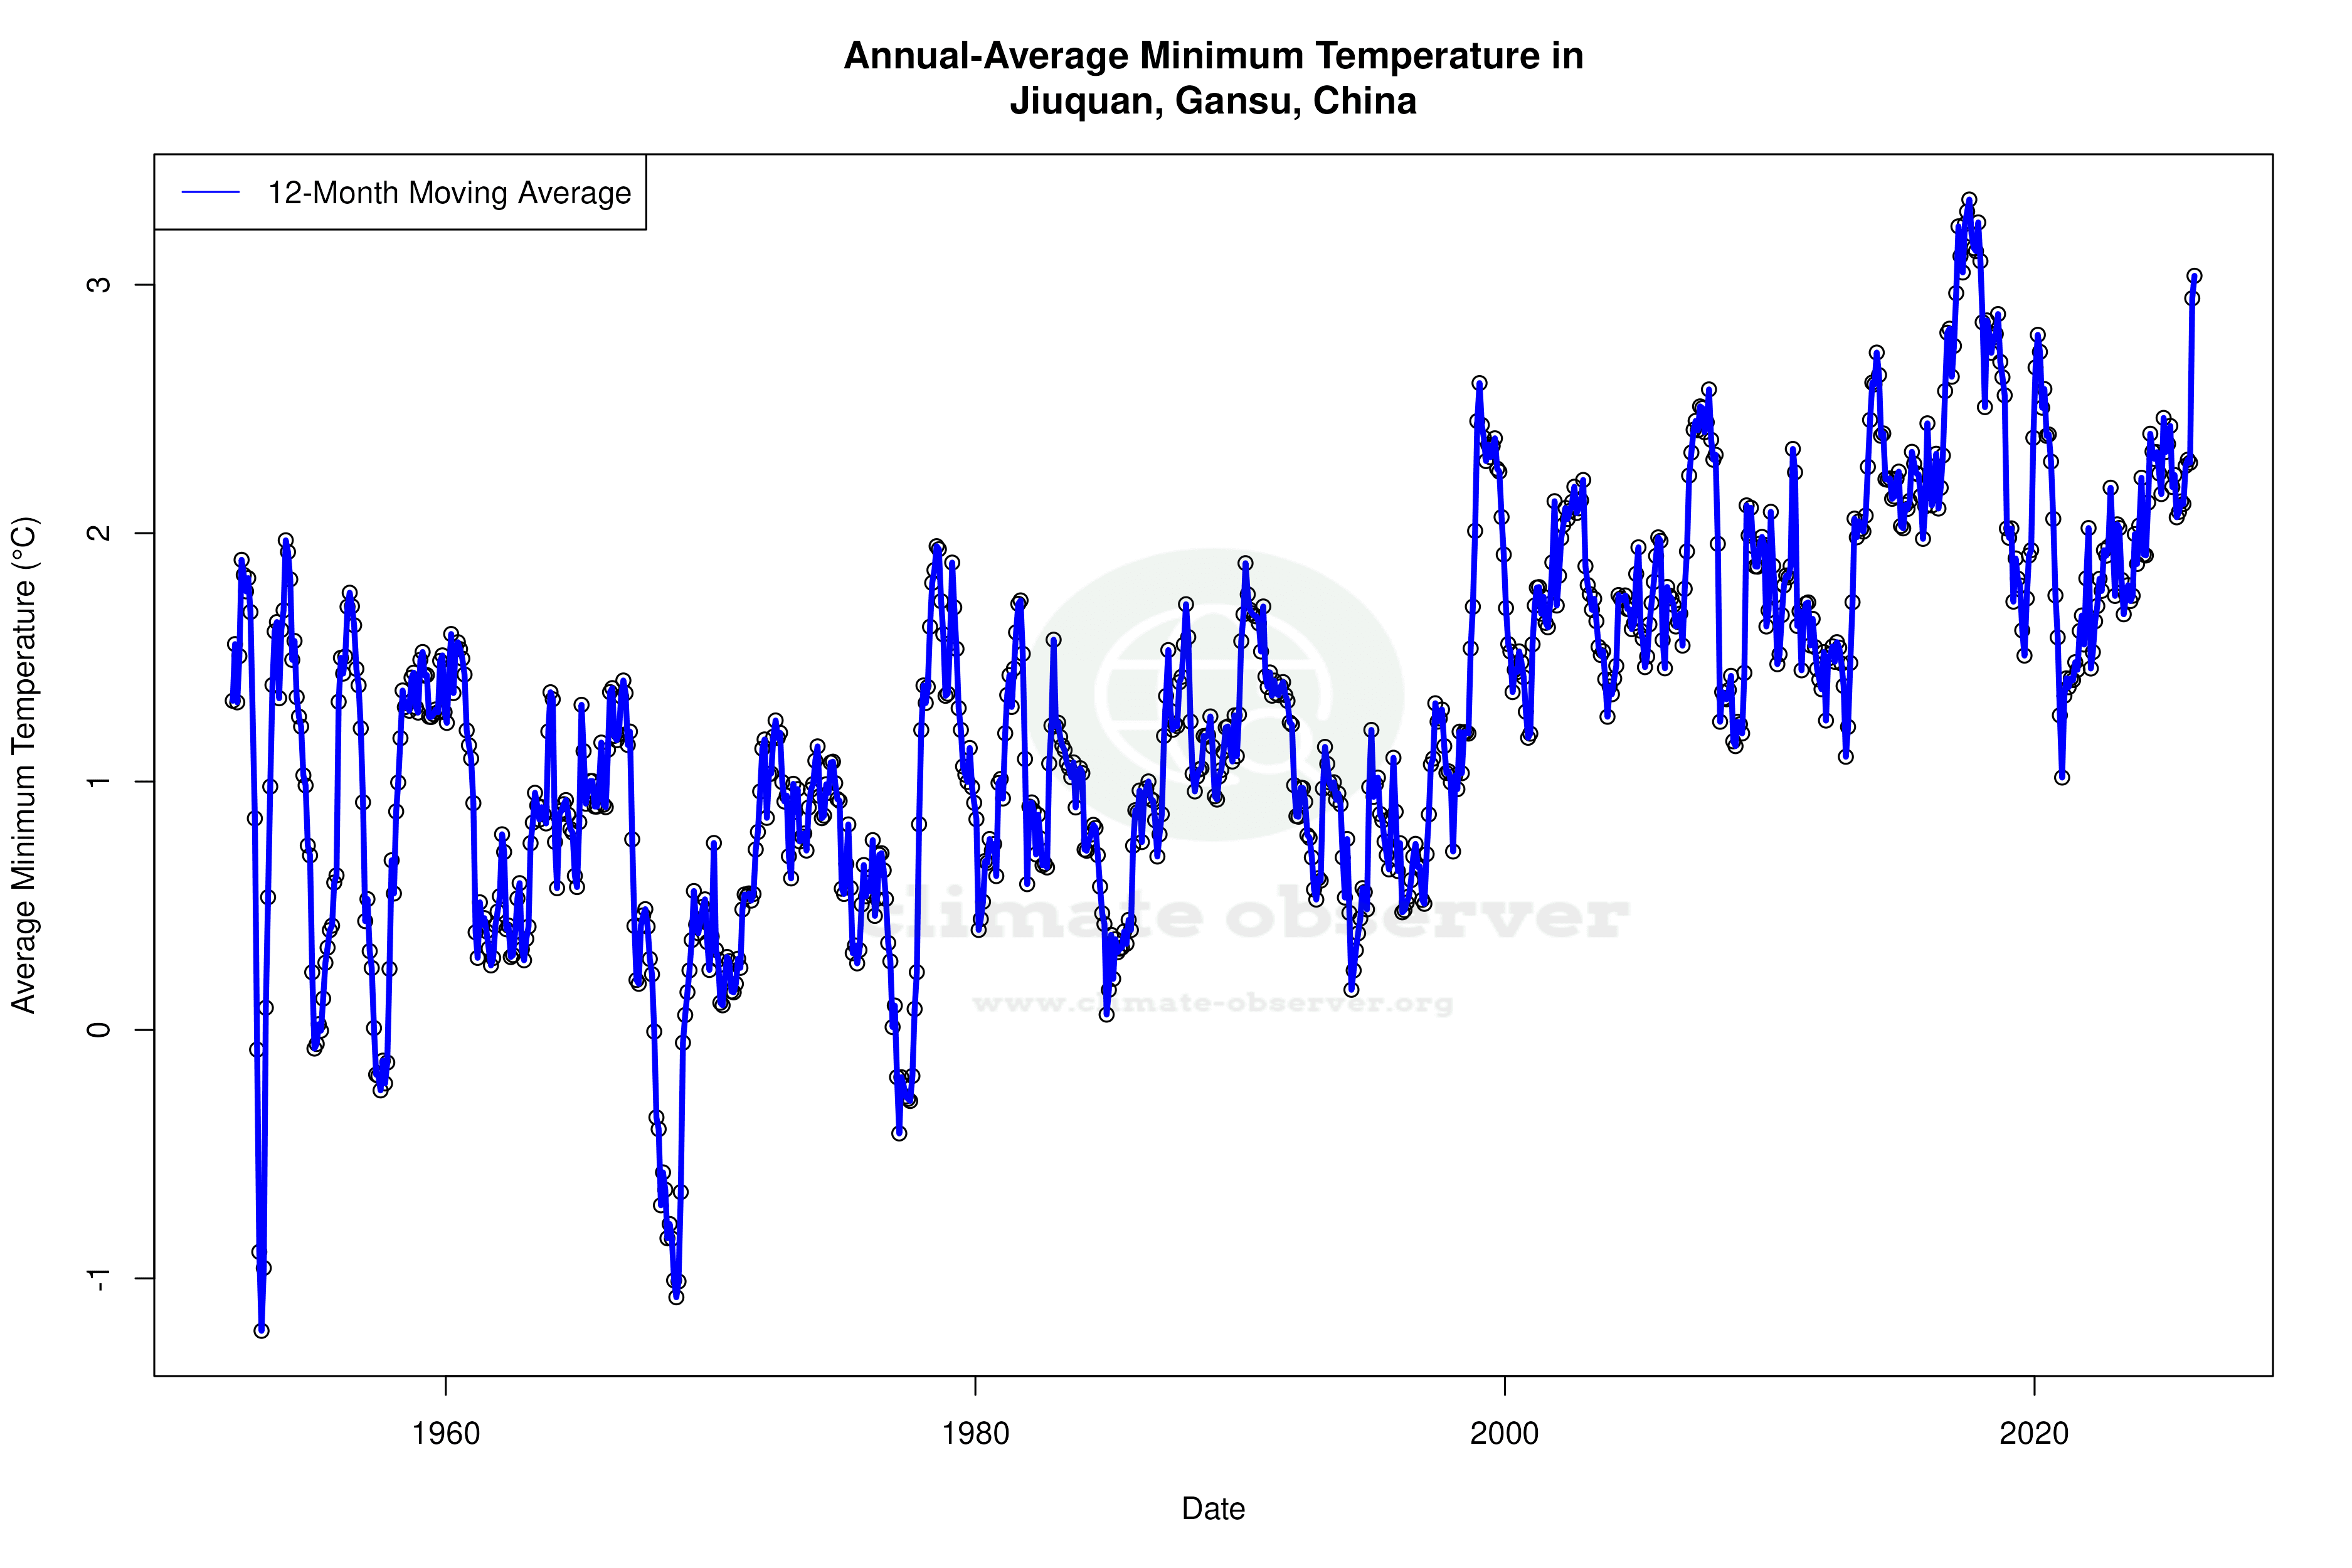
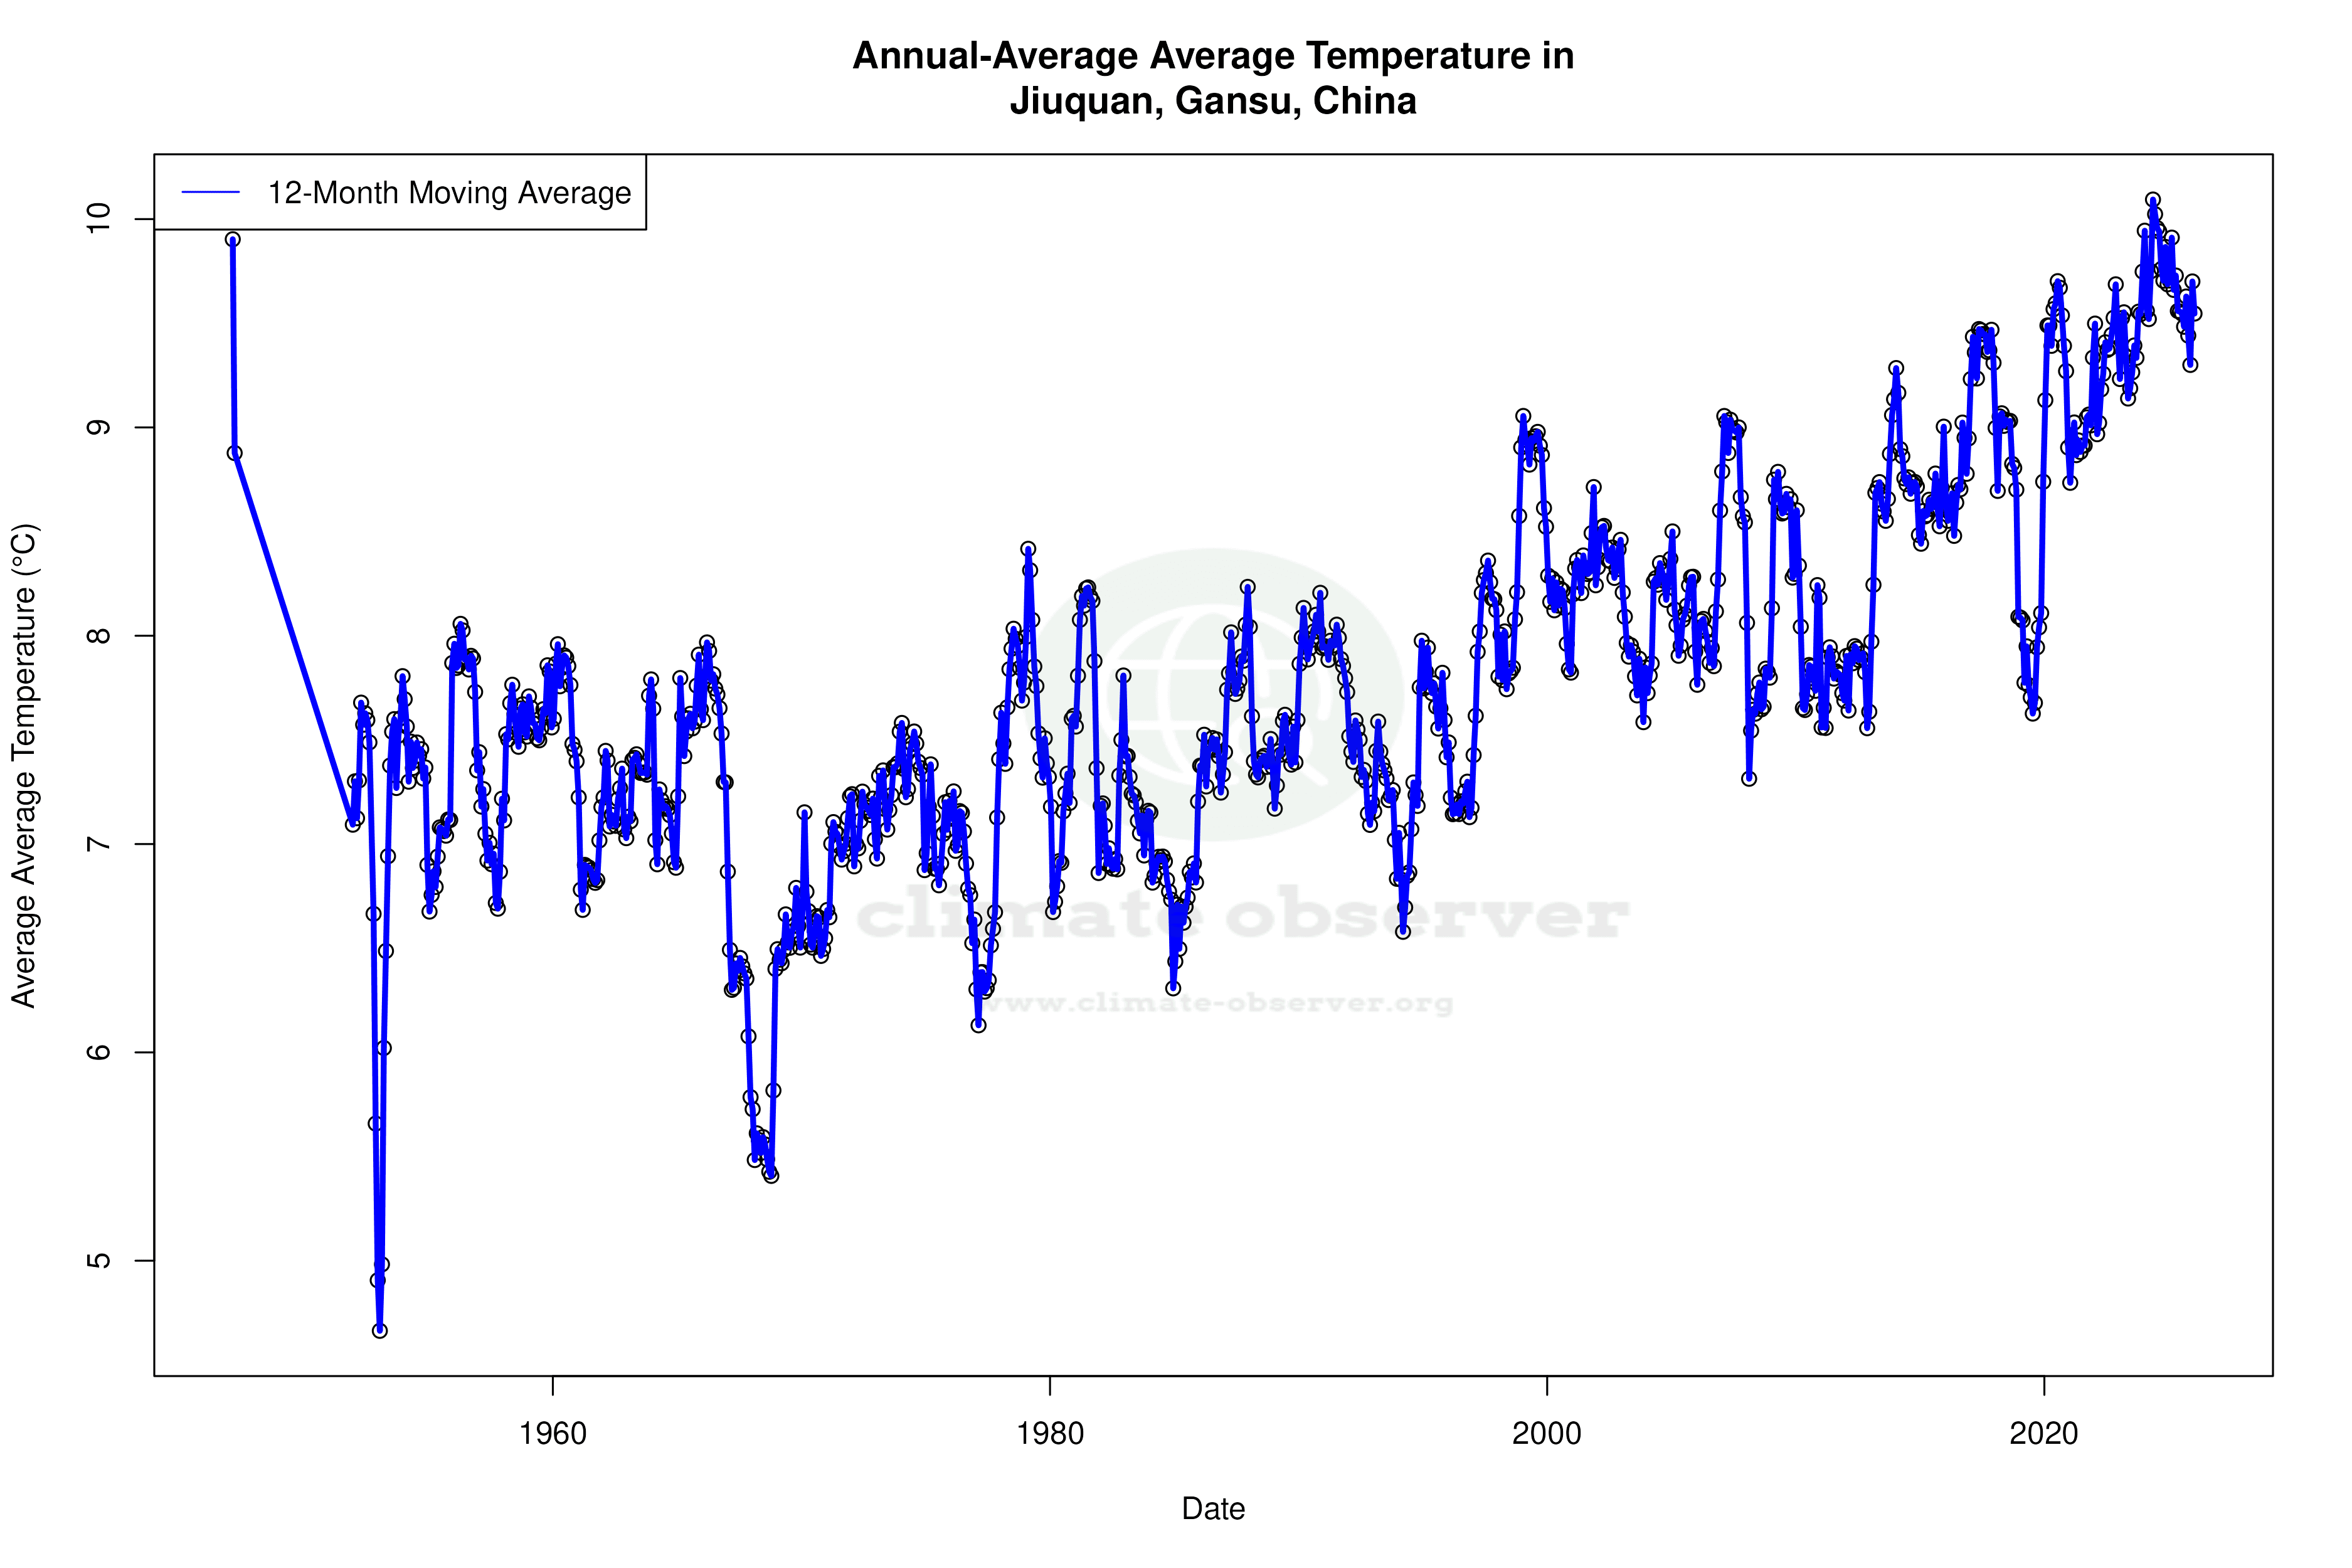
Over the long term, Jiuquan has experienced a warming trend in high temperatures, with an increase of 0.34°C (0.61°F). This suggests a gradual rise in daytime temperatures, potentially impacting local agriculture and water resources. In contrast, the past decade shows a cooling trend in low temperatures, with a decrease of 0.69°C (1.24°F). This divergence between day and night temperatures could lead to more pronounced diurnal temperature ranges, affecting both natural ecosystems and human activities.
Precipitation Patterns: A Shift Towards Even Distribution
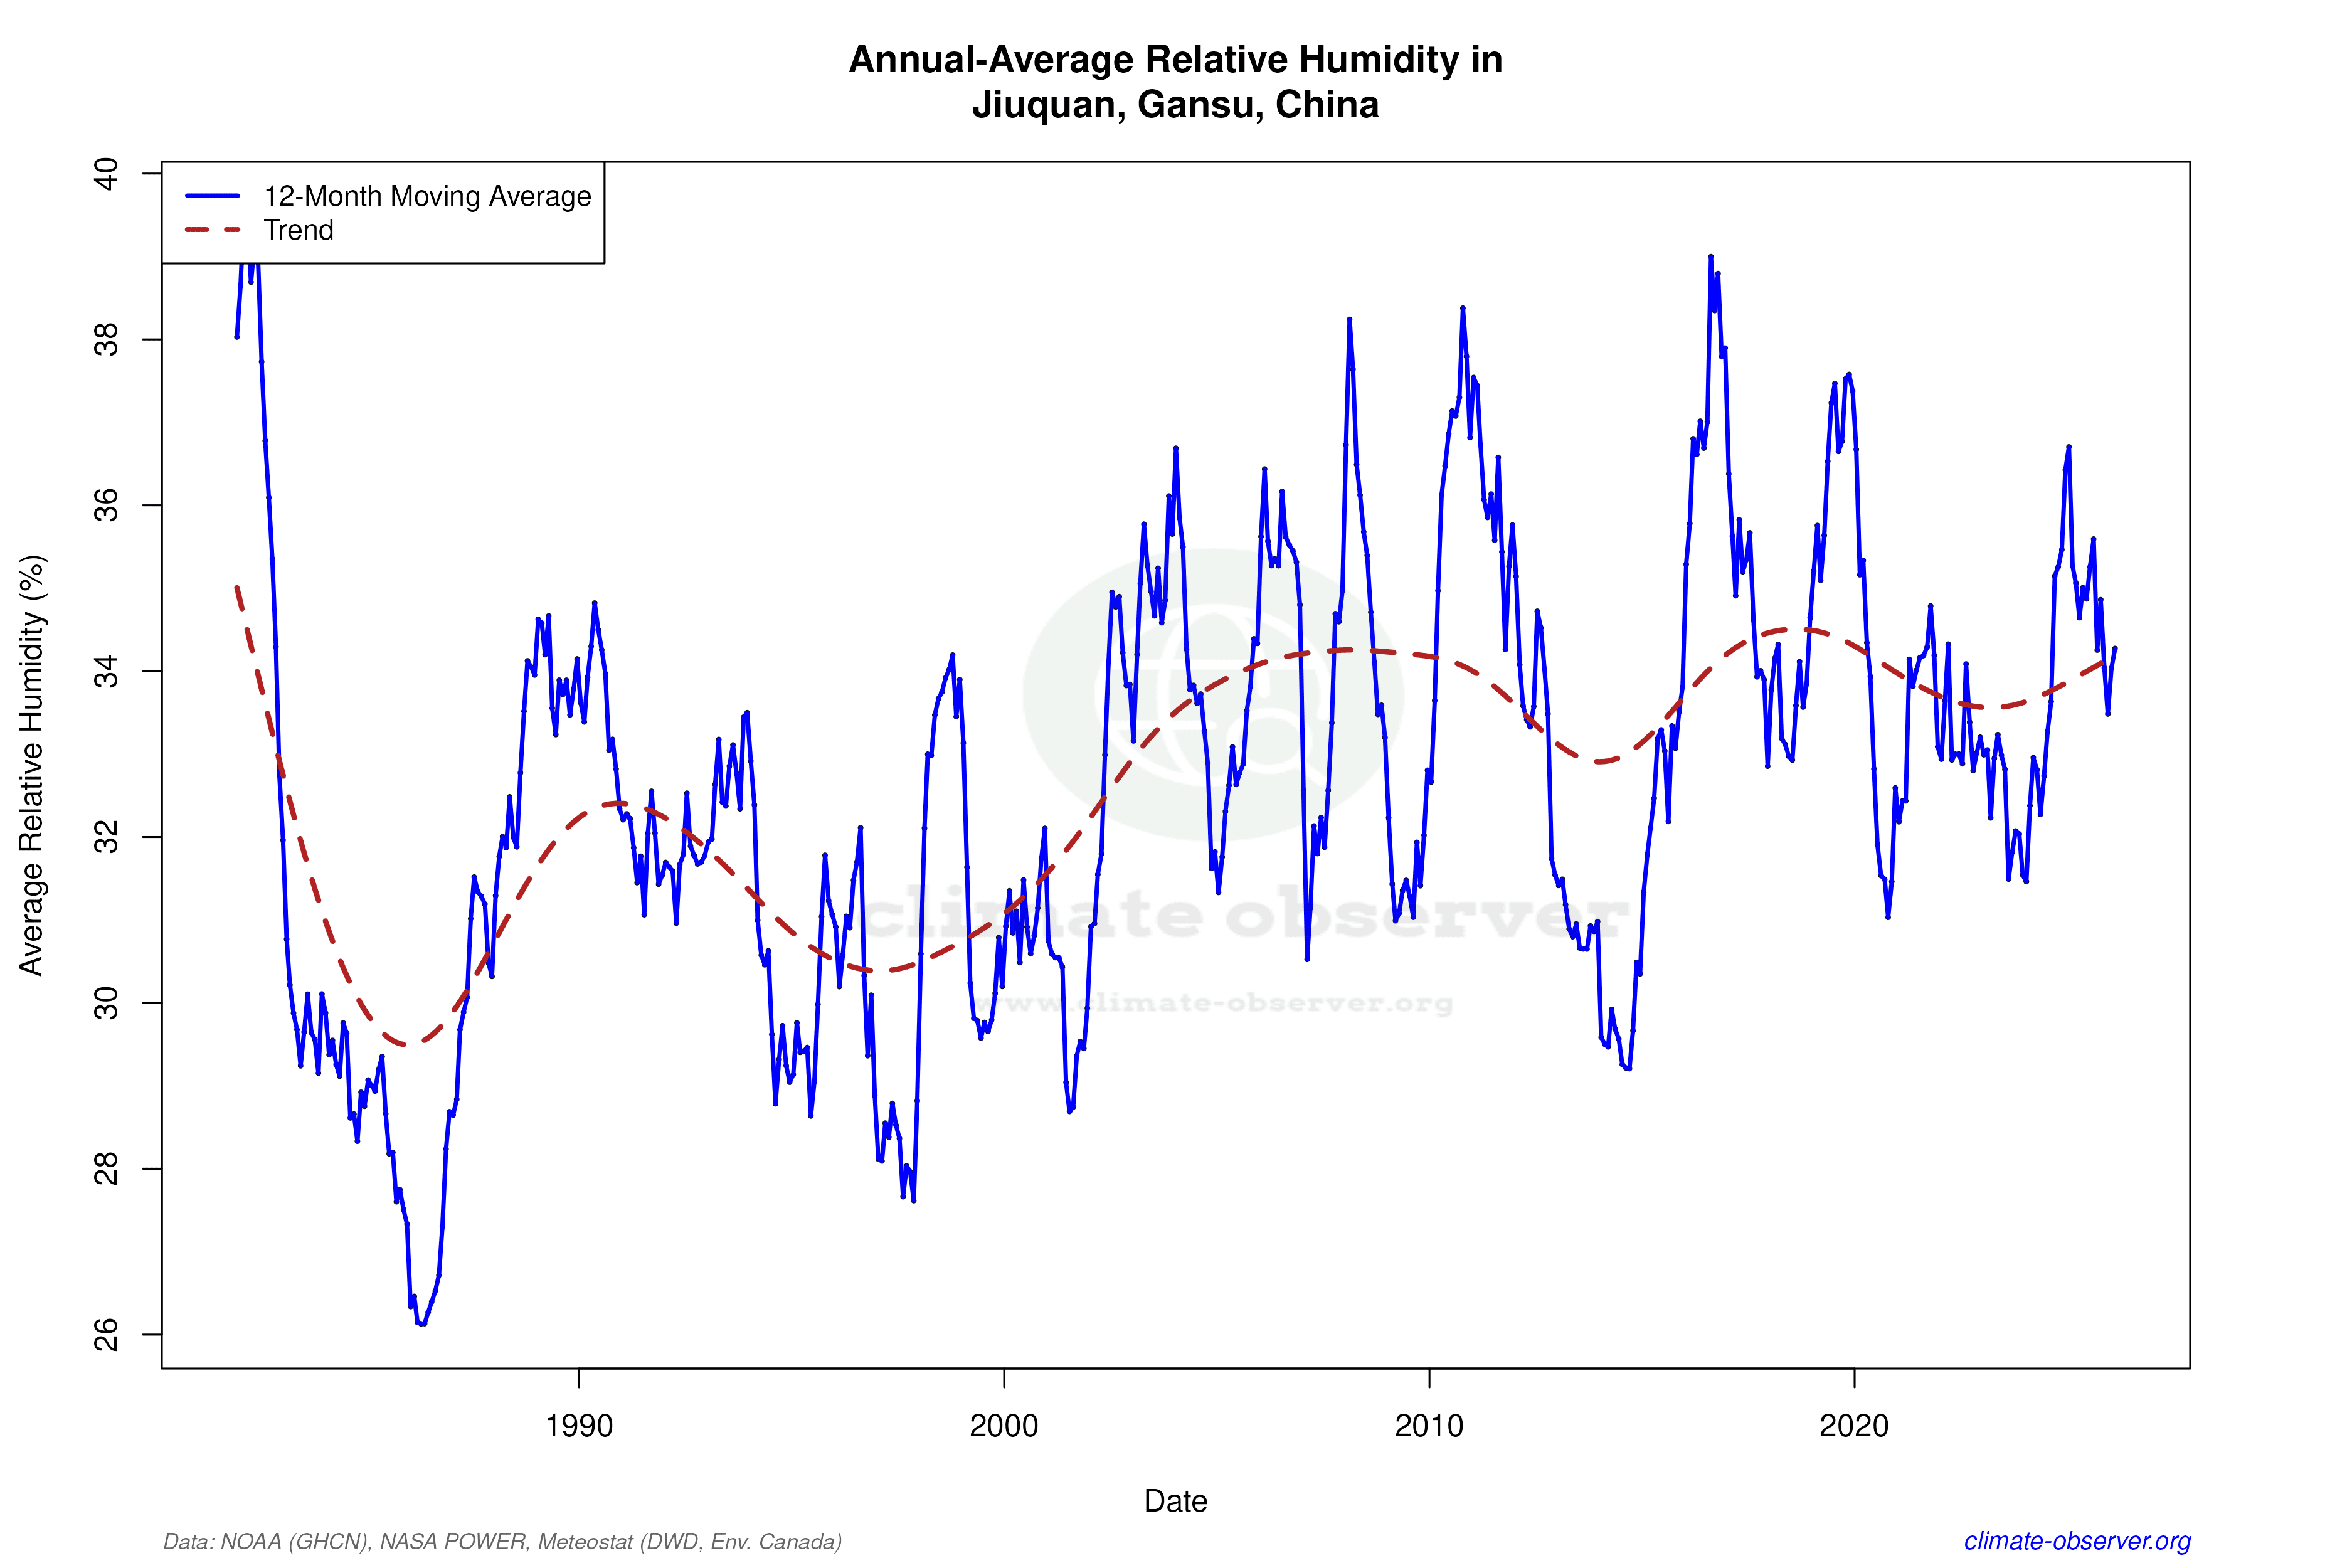
The Precipitation Concentration Index (PCI) for Jiuquan has decreased from a baseline of 21.7 to a current value of 16.9. This indicates a significant shift towards more evenly distributed rainfall events, as a PCI over 20 suggests highly concentrated precipitation. Such changes could mitigate the risks of flash floods and droughts, aligning with China's regional climate adaptation goals to improve water resource management.
Temperature Extremes: Record Highs and Lows
Jiuquan's historical temperature records reveal the extremes of its climate. The highest recorded temperature is 42.26°C (108.07°F), while the lowest is -31.6°C (-24.88°F). These records underscore the region's susceptibility to temperature extremes, which can pose challenges for infrastructure and public health, particularly during heatwaves or cold snaps.
Regional Implications and Climate Goals
The climatic trends observed in Jiuquan are reflective of broader patterns across northwestern China, where efforts are underway to address the impacts of climate change. The warming trend in high temperatures aligns with global observations, while the cooling trend in lows over the last decade may be unique to local geographical and atmospheric conditions. China's climate goals, which include reducing carbon emissions and enhancing climate resilience, are crucial in addressing these challenges and supporting sustainable development in the region.
Station Statistics
10-Year Trend
High: -0.99 °F/decade
Low: -1.44 °F/decade
Rain: -0.013 in/decade
25-Year Trend
High: +2.11 °F/decade
Low: +0.82 °F/decade
Rain: +0.001 in/decade
50-Year Trend
High: +1.00 °F/decade
Low: +0.53 °F/decade
Rain: +0.000 in/decade
All-Time Trend
High: +0.61 °F/decade
Low: +0.41 °F/decade
Rain: +0.000 in/decade
Percentage Above-Average Days
Last 12 Months: 56.7%
This Year: 68.6%
Precipitation Concentration Index (PCI) ℹ️
Last 12 Months: 16.0
Historical Average: 23.0
Percentile Rank of Last 12 Months ℹ️
High: 80th percentile
Low: 82nd percentile
Rain: 54th percentile
Change in Variance ℹ️
High: +7.3%
Low: +5.6%
Intraday: -6.4%
Data Coverage
94.5%
First Year of Data
1946
Station Location
Historical Weather Records
| Max High | Avg High | Min High | Max Avg | Avg Avg | Min Avg | Max Low | Avg Low | Min Low | Max Precipitation | Avg Precipitation | Max Snow | Avg Snow | |
|---|---|---|---|---|---|---|---|---|---|---|---|---|---|
| Record | 108.07 °F | — | -4.36 °F | 85.46 °F | — | -14.44 °F | 77.18 °F | — | -24.88 °F | 1.98 in | — | — | — |
| January | 60.44 °F | 28.93 °F | -2.56 °F | 38.84 °F | 15.62 °F | -10.48 °F | 25.16 °F | 4.92 °F | -19.48 °F | 0.18 in | 0.00 in | — | — |
| February | 61.70 °F | 36.60 °F | 2.30 °F | 46.94 °F | 23.18 °F | -8.14 °F | 37.06 °F | 11.88 °F | -24.88 °F | 0.20 in | 0.00 in | — | — |
| March | 77.36 °F | 50.32 °F | 15.08 °F | 59.90 °F | 36.56 °F | 4.28 °F | 49.64 °F | 24.95 °F | -14.26 °F | 0.39 in | 0.00 in | — | — |
| April | 89.06 °F | 64.25 °F | 28.58 °F | 73.40 °F | 50.40 °F | 19.40 °F | 63.32 °F | 37.57 °F | 12.92 °F | 0.59 in | 0.01 in | — | — |
| May | 98.76 °F | 74.51 °F | 42.62 °F | 79.52 °F | 61.20 °F | 37.04 °F | 67.35 °F | 47.84 °F | 25.88 °F | 1.46 in | 0.01 in | — | — |
| June | 98.96 °F | 81.98 °F | 58.28 °F | 83.48 °F | 69.06 °F | 50.72 °F | 74.61 °F | 55.96 °F | 36.32 °F | 1.98 in | 0.02 in | — | — |
| July | 108.07 °F | 85.18 °F | 59.90 °F | 85.46 °F | 72.08 °F | 54.50 °F | 77.18 °F | 59.56 °F | 45.86 °F | 1.27 in | 0.03 in | — | — |
| August | 107.20 °F | 83.27 °F | 56.12 °F | 84.02 °F | 69.47 °F | 51.26 °F | 76.98 °F | 57.13 °F | 39.92 °F | 1.23 in | 0.02 in | — | — |
| September | 94.80 °F | 73.74 °F | 48.74 °F | 76.46 °F | 59.39 °F | 37.76 °F | 69.03 °F | 47.58 °F | 25.34 °F | 1.54 in | 0.01 in | — | — |
| October | 84.20 °F | 60.37 °F | 31.28 °F | 64.58 °F | 45.88 °F | 15.62 °F | 54.32 °F | 34.64 °F | 1.58 °F | 0.36 in | 0.00 in | — | — |
| November | 68.61 °F | 44.14 °F | 8.06 °F | 51.80 °F | 31.12 °F | -0.40 °F | 41.18 °F | 21.33 °F | -11.56 °F | 0.16 in | 0.00 in | — | — |
| December | 63.14 °F | 31.33 °F | -4.36 °F | 39.74 °F | 18.54 °F | -14.44 °F | 29.12 °F | 8.70 °F | -21.64 °F | 0.13 in | 0.00 in | — | — |
Data Visualisations
Remove WatermarksCurrent Year Climate Trends vs Historical


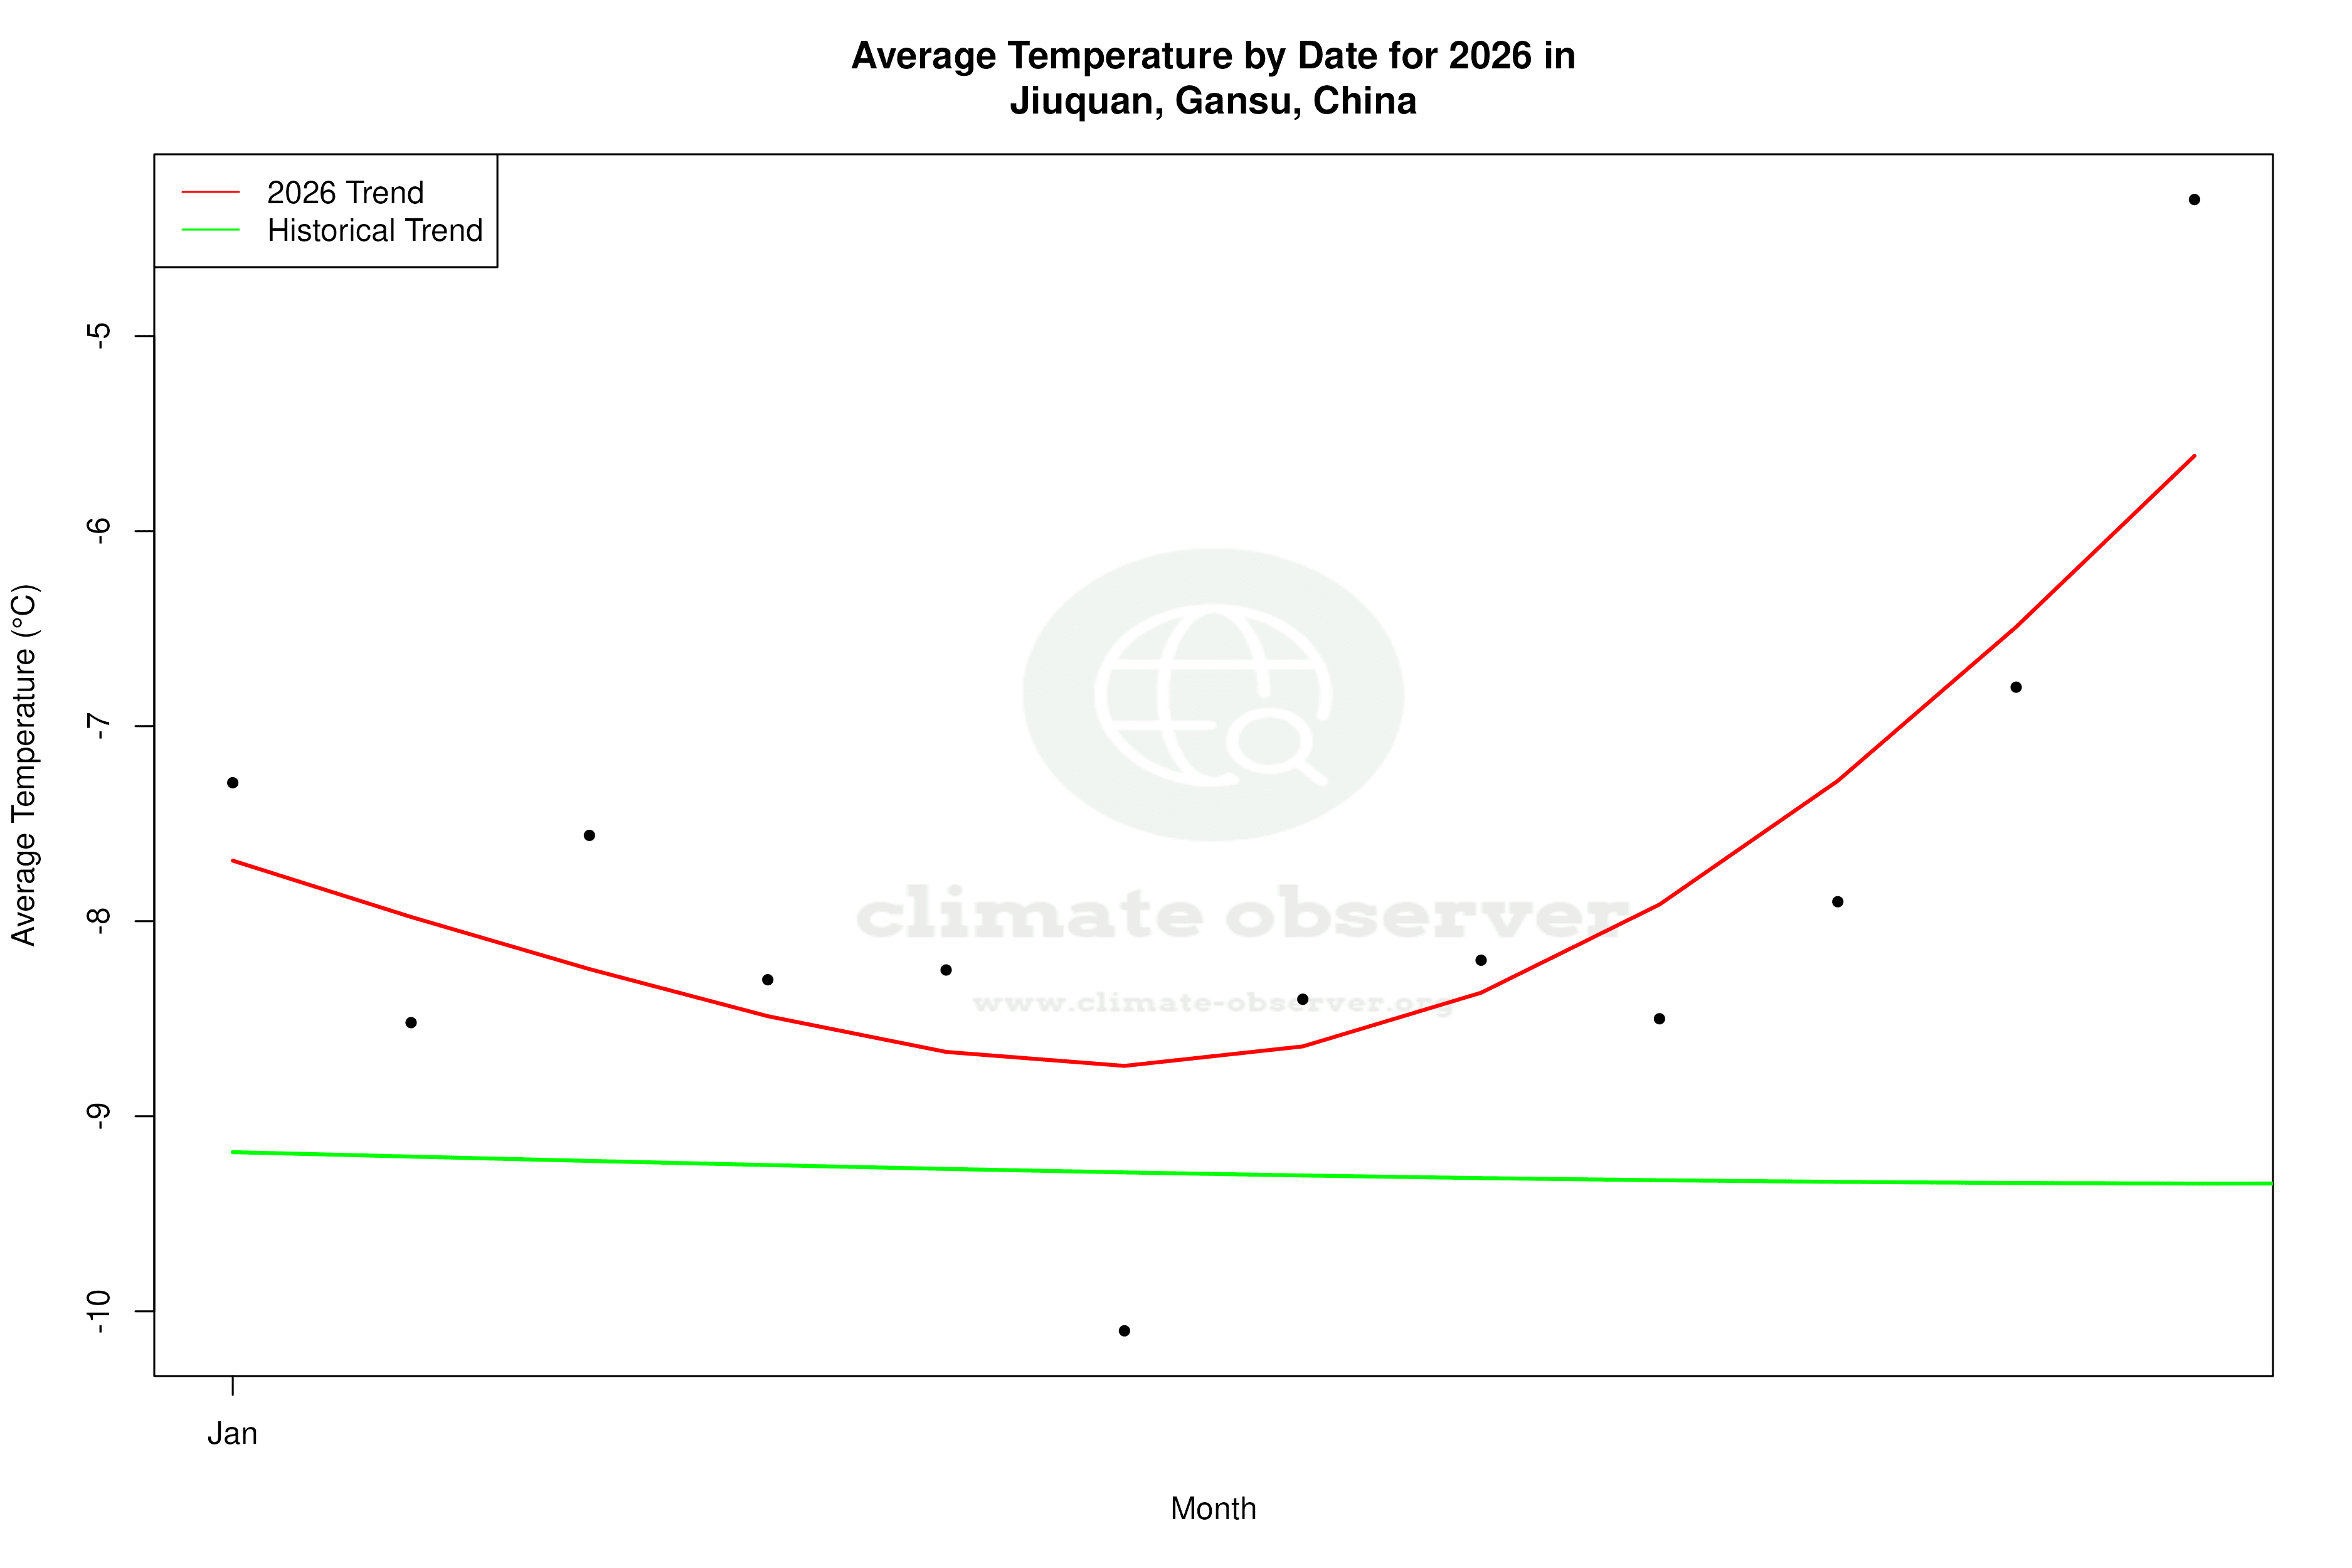

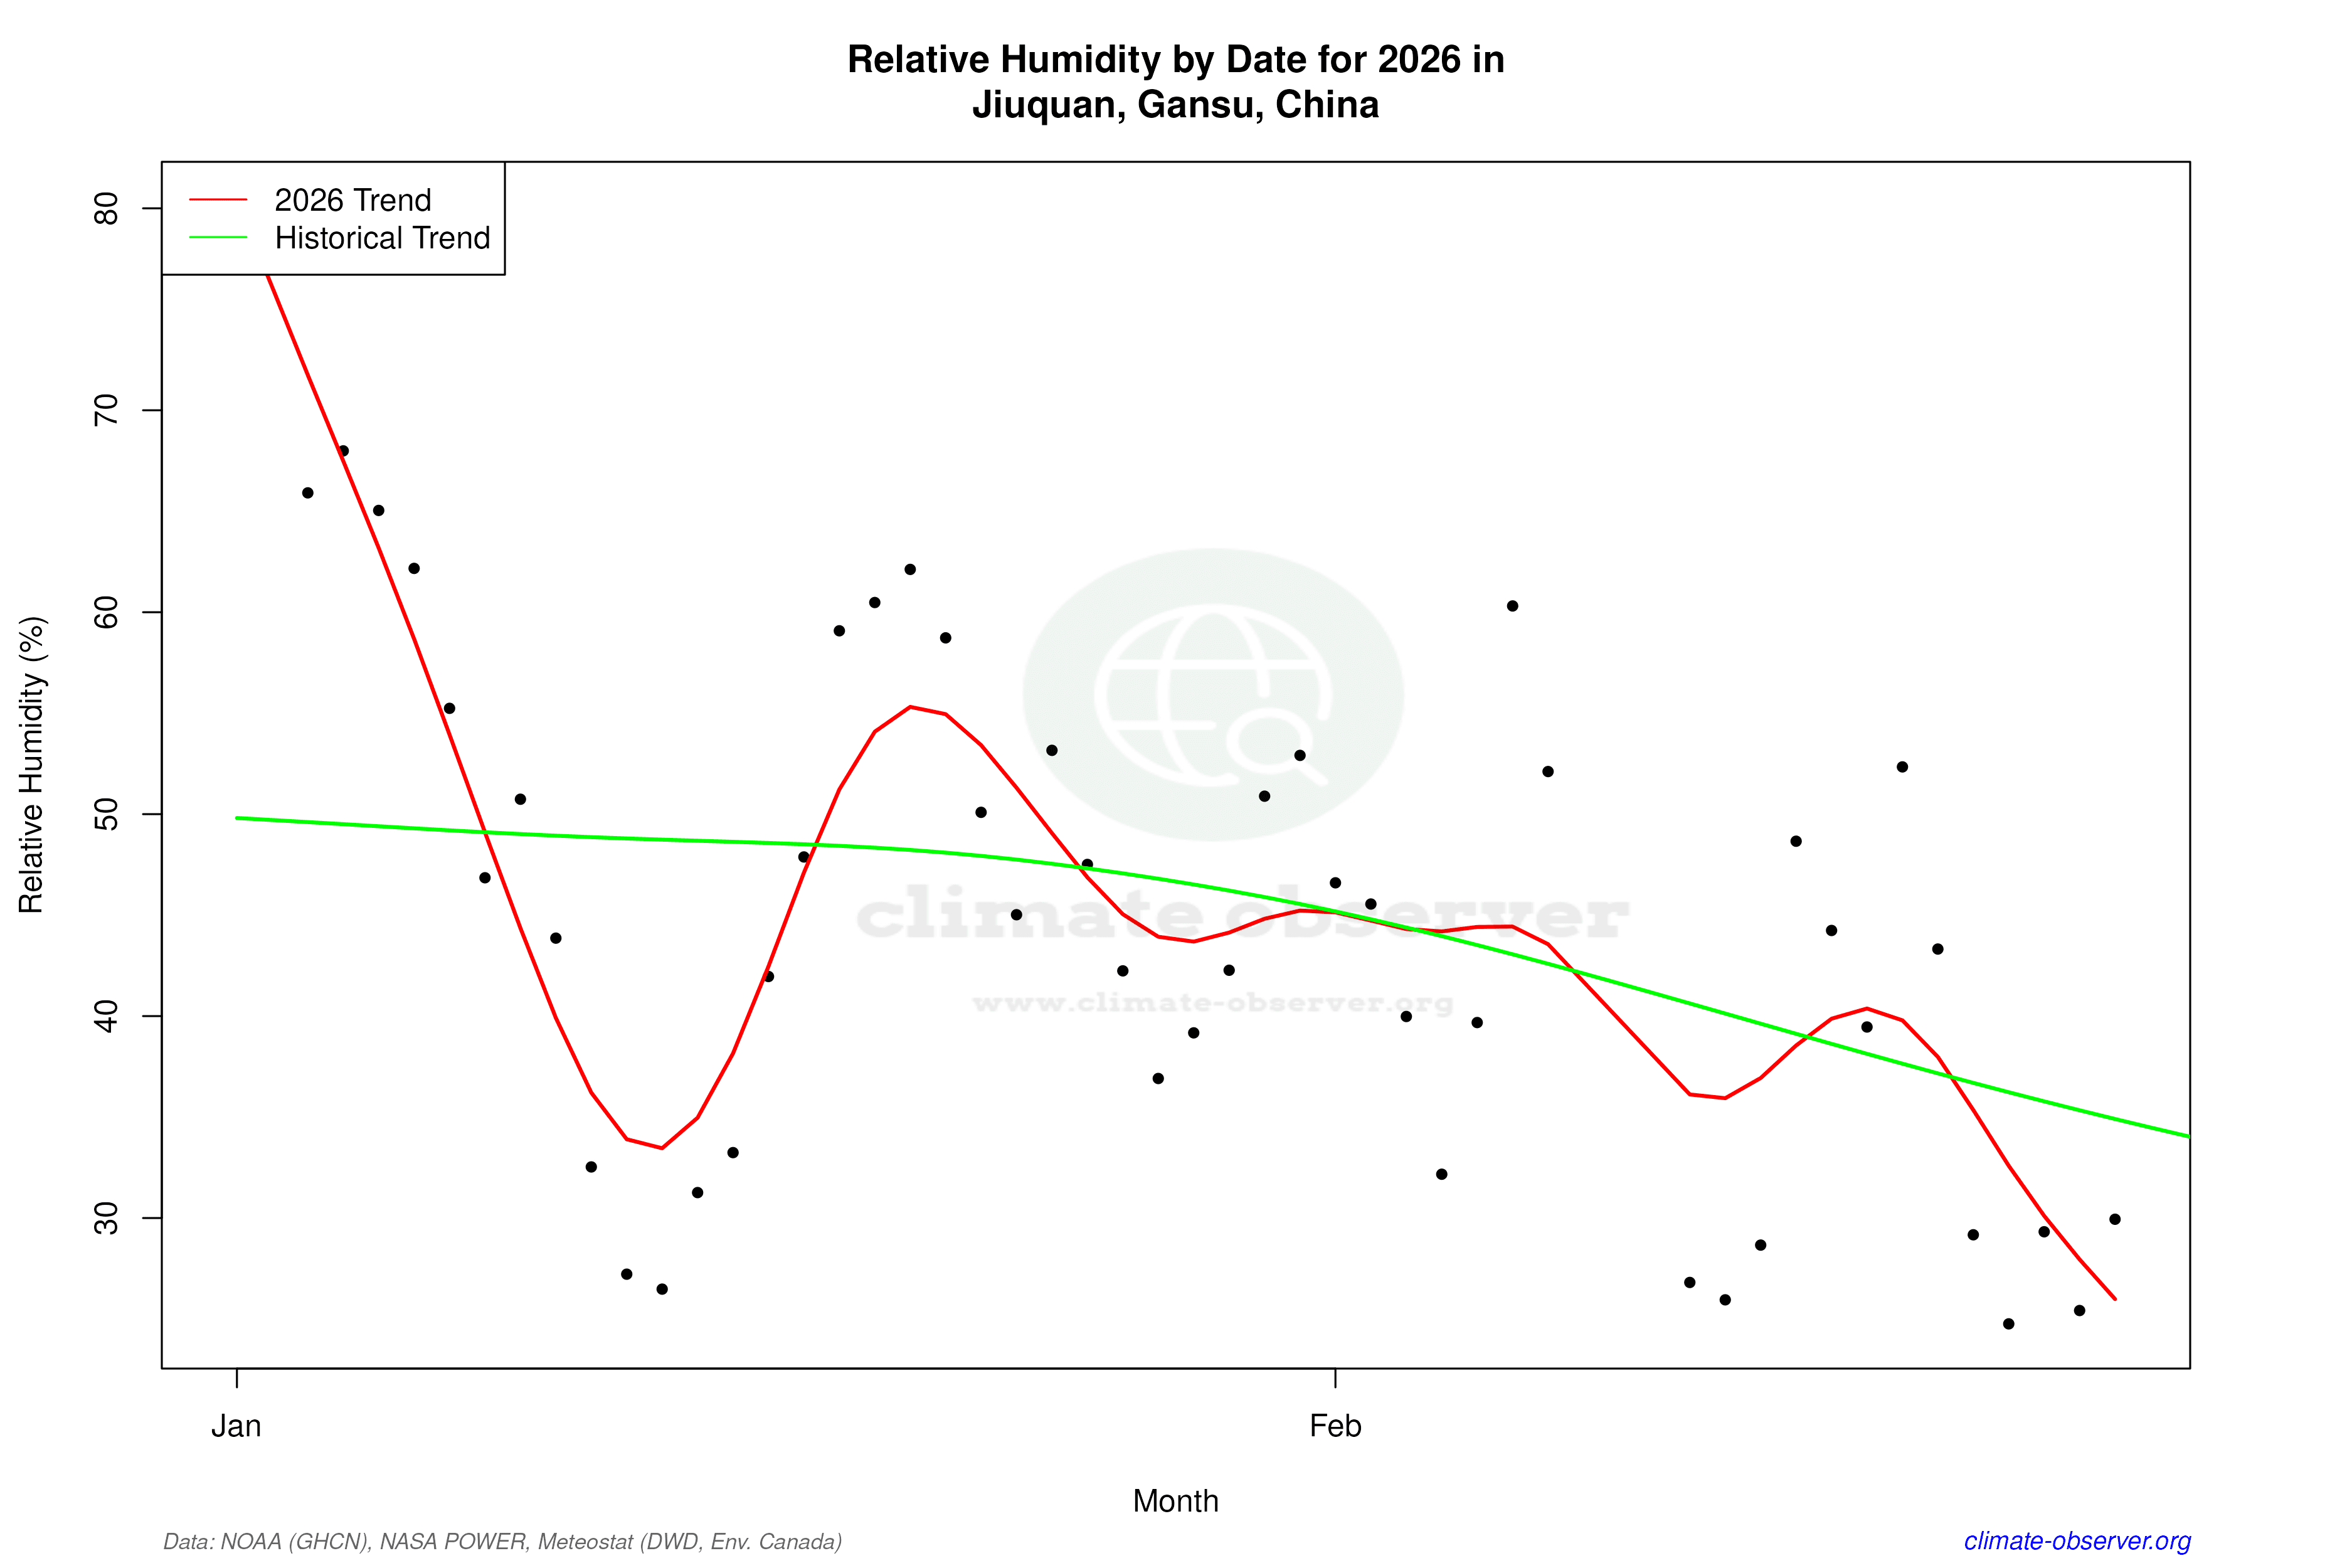

Max Temperature this Year | 1 of 6
Climate 12-Month Moving Averages
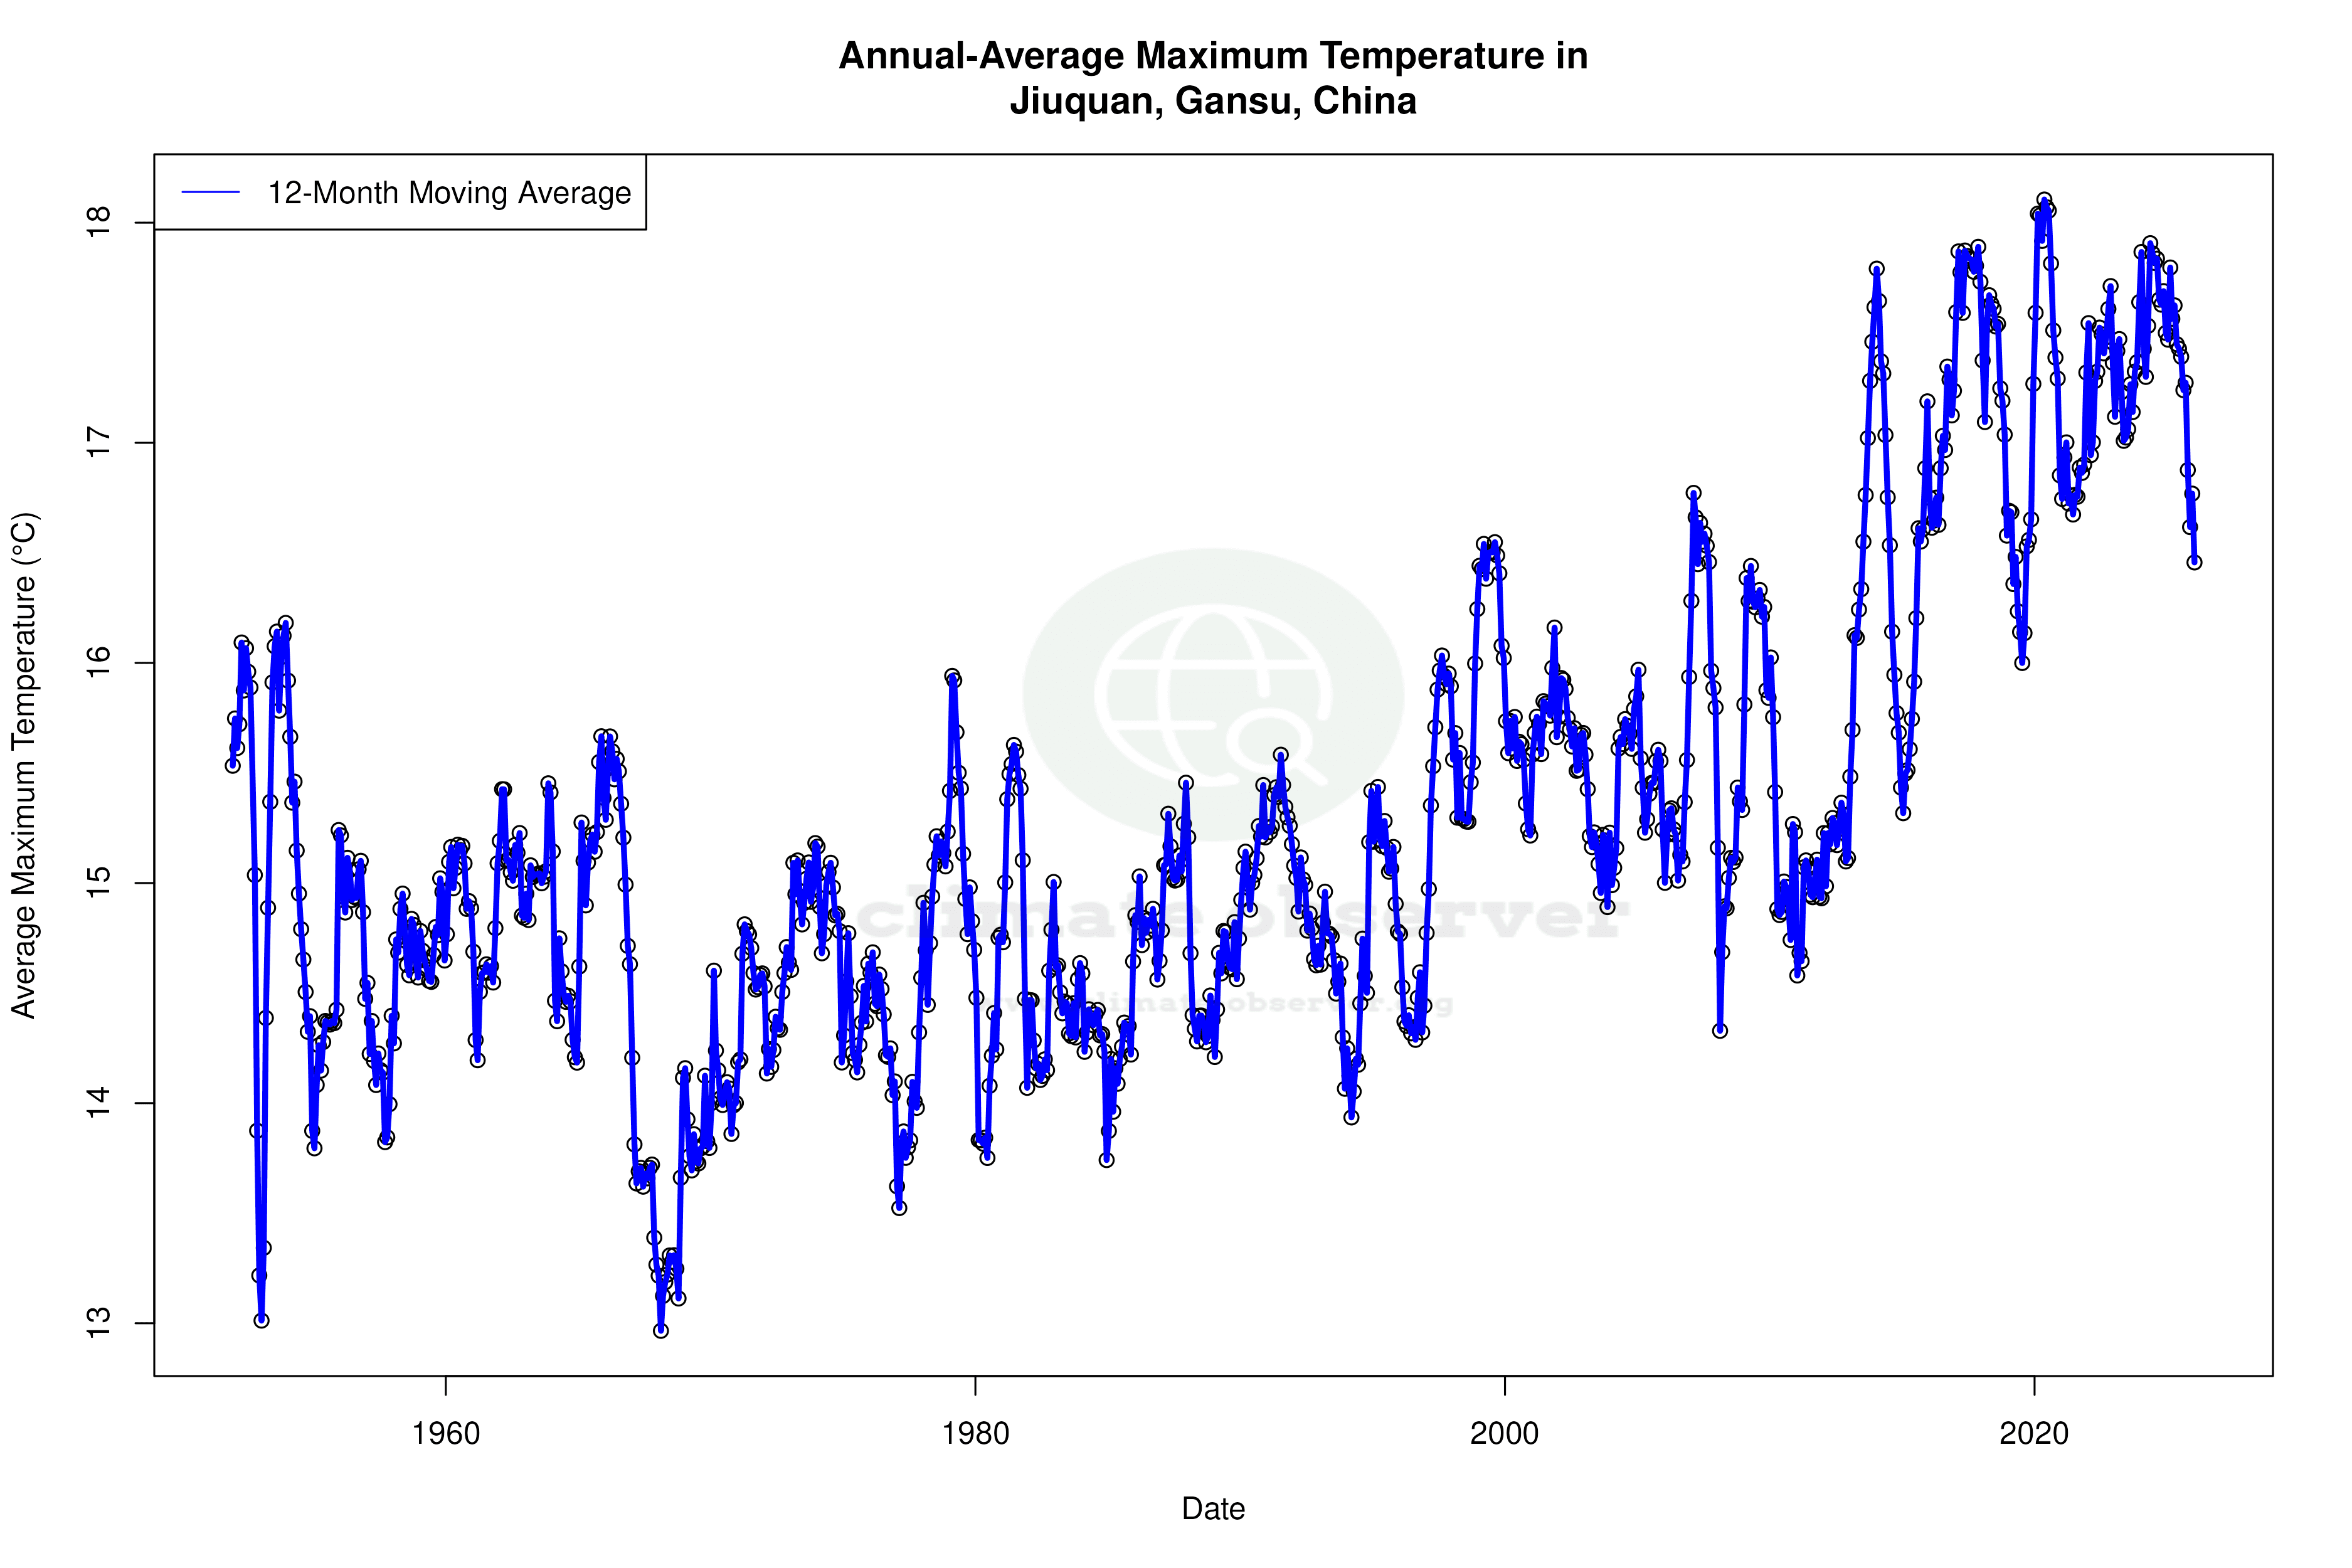


Max Temperature 12-Month MA | 1 of 6
Daily Data Points and Averages Throughout the Year
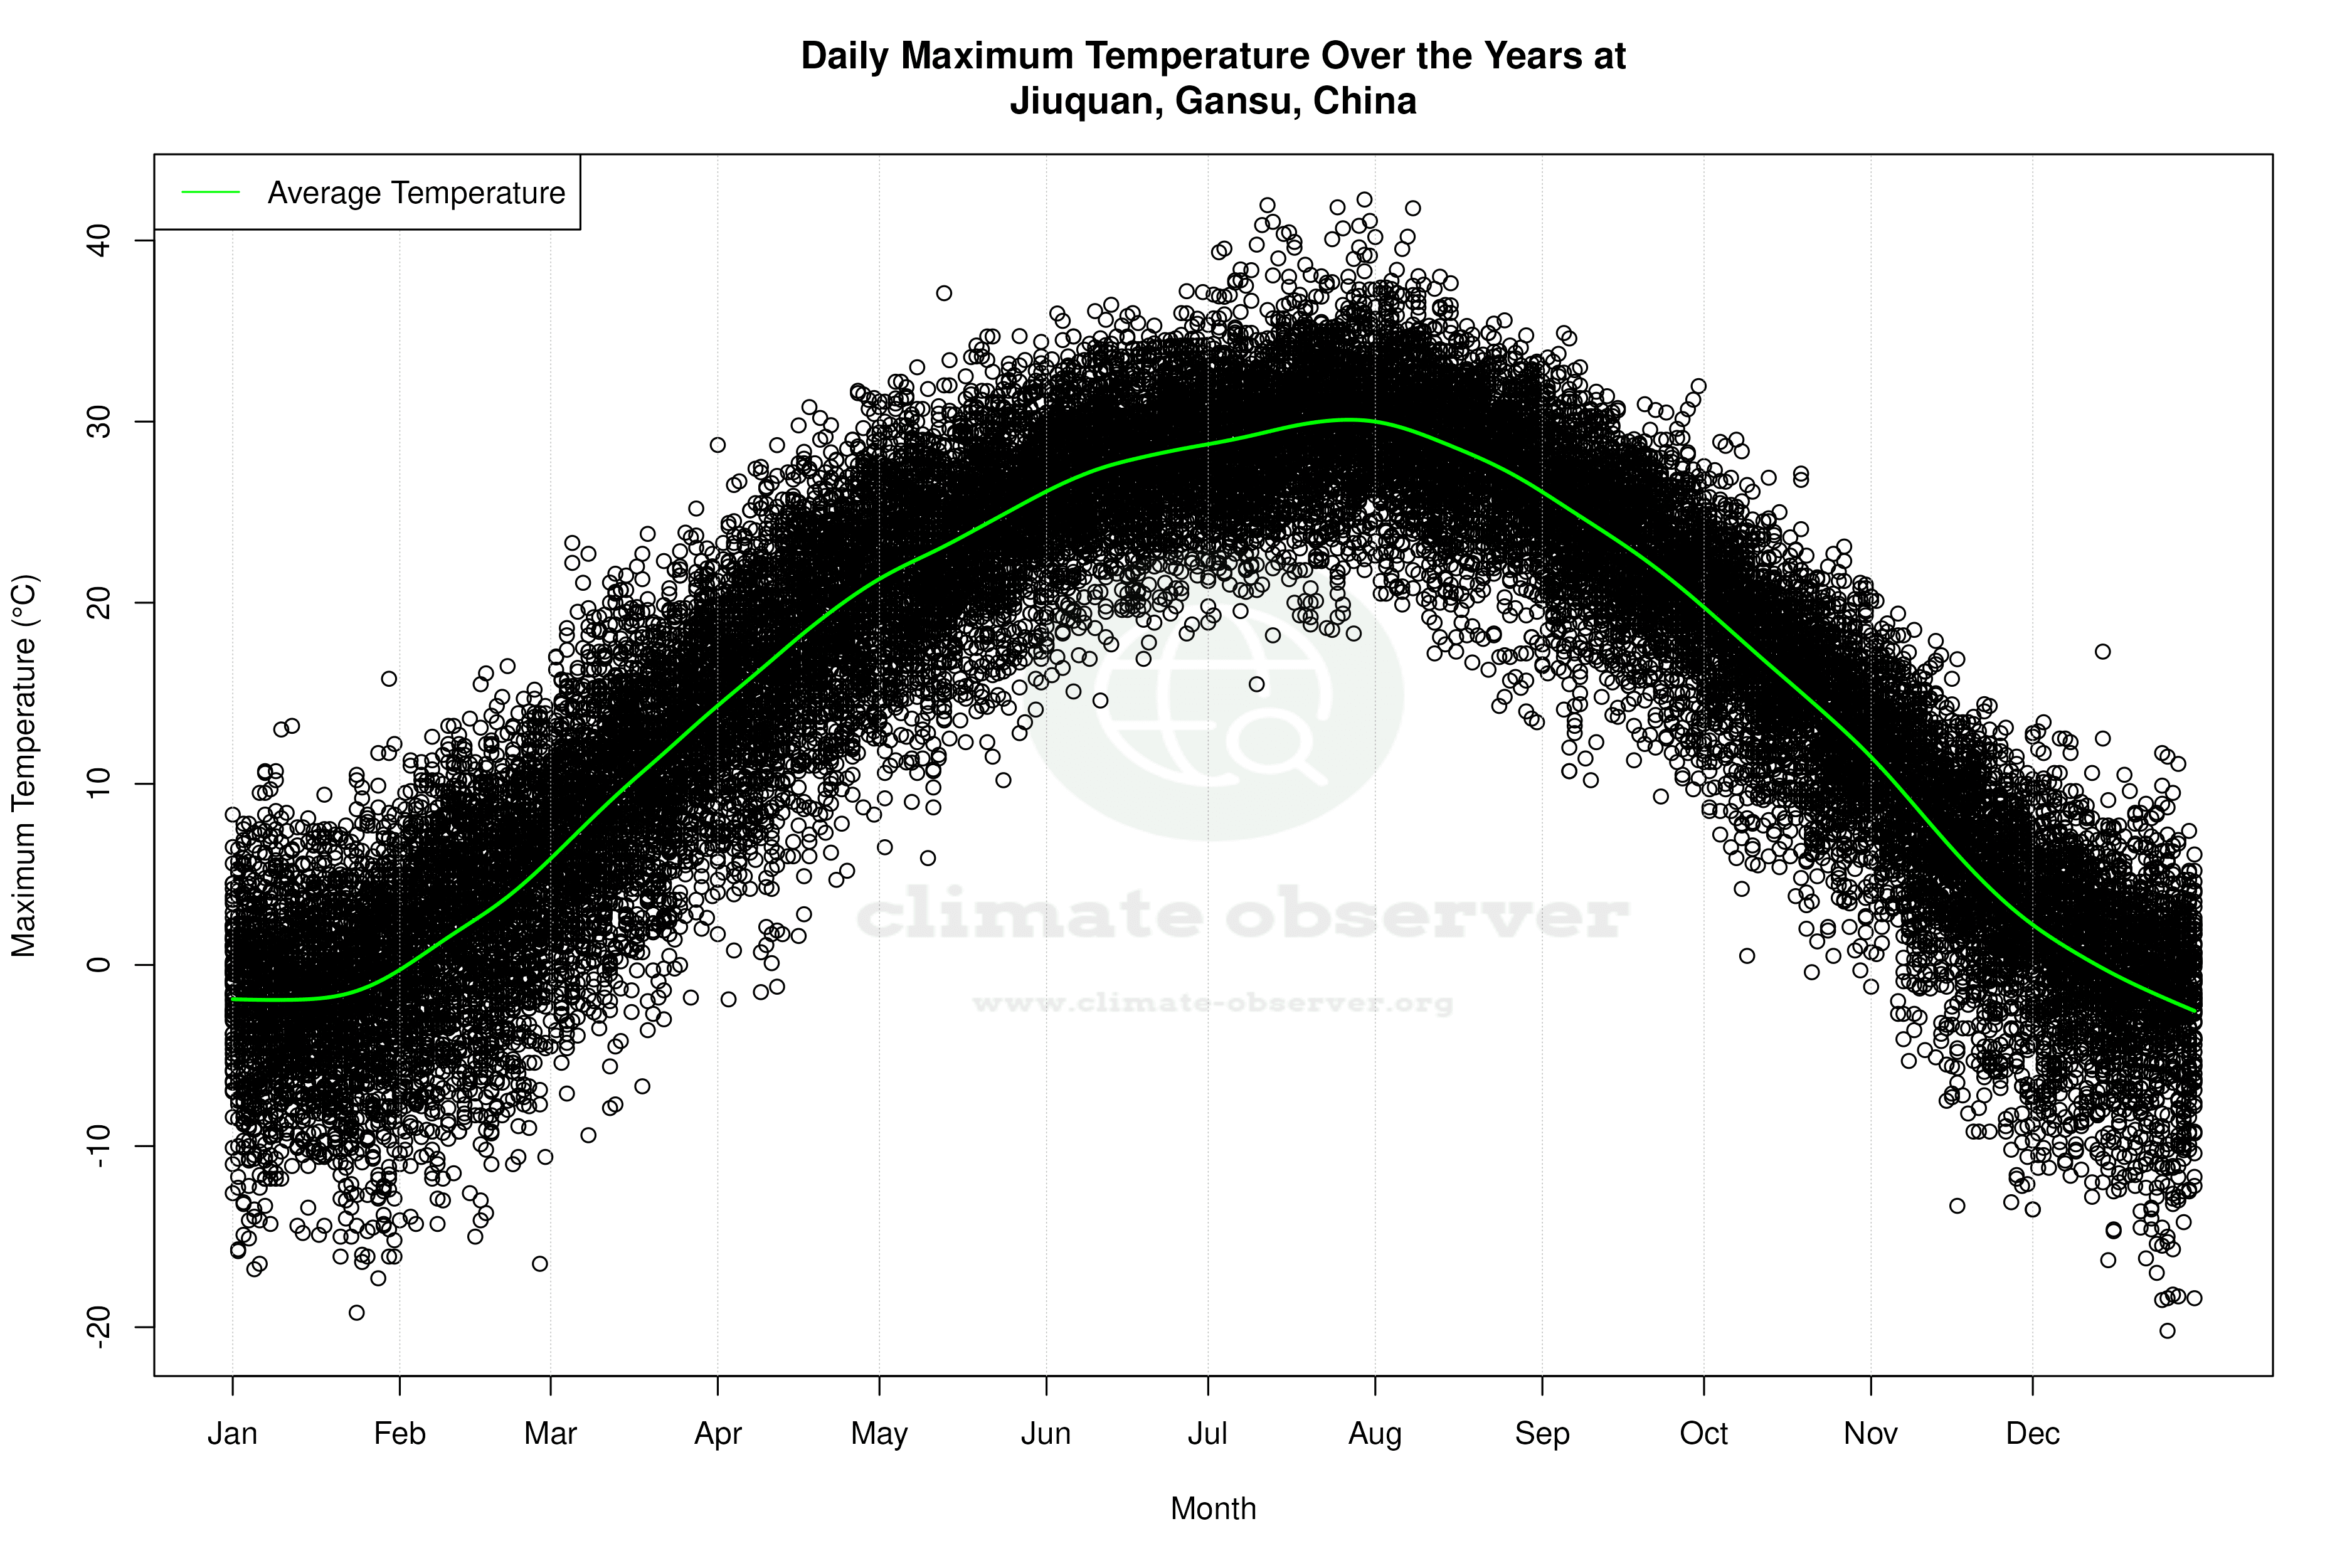

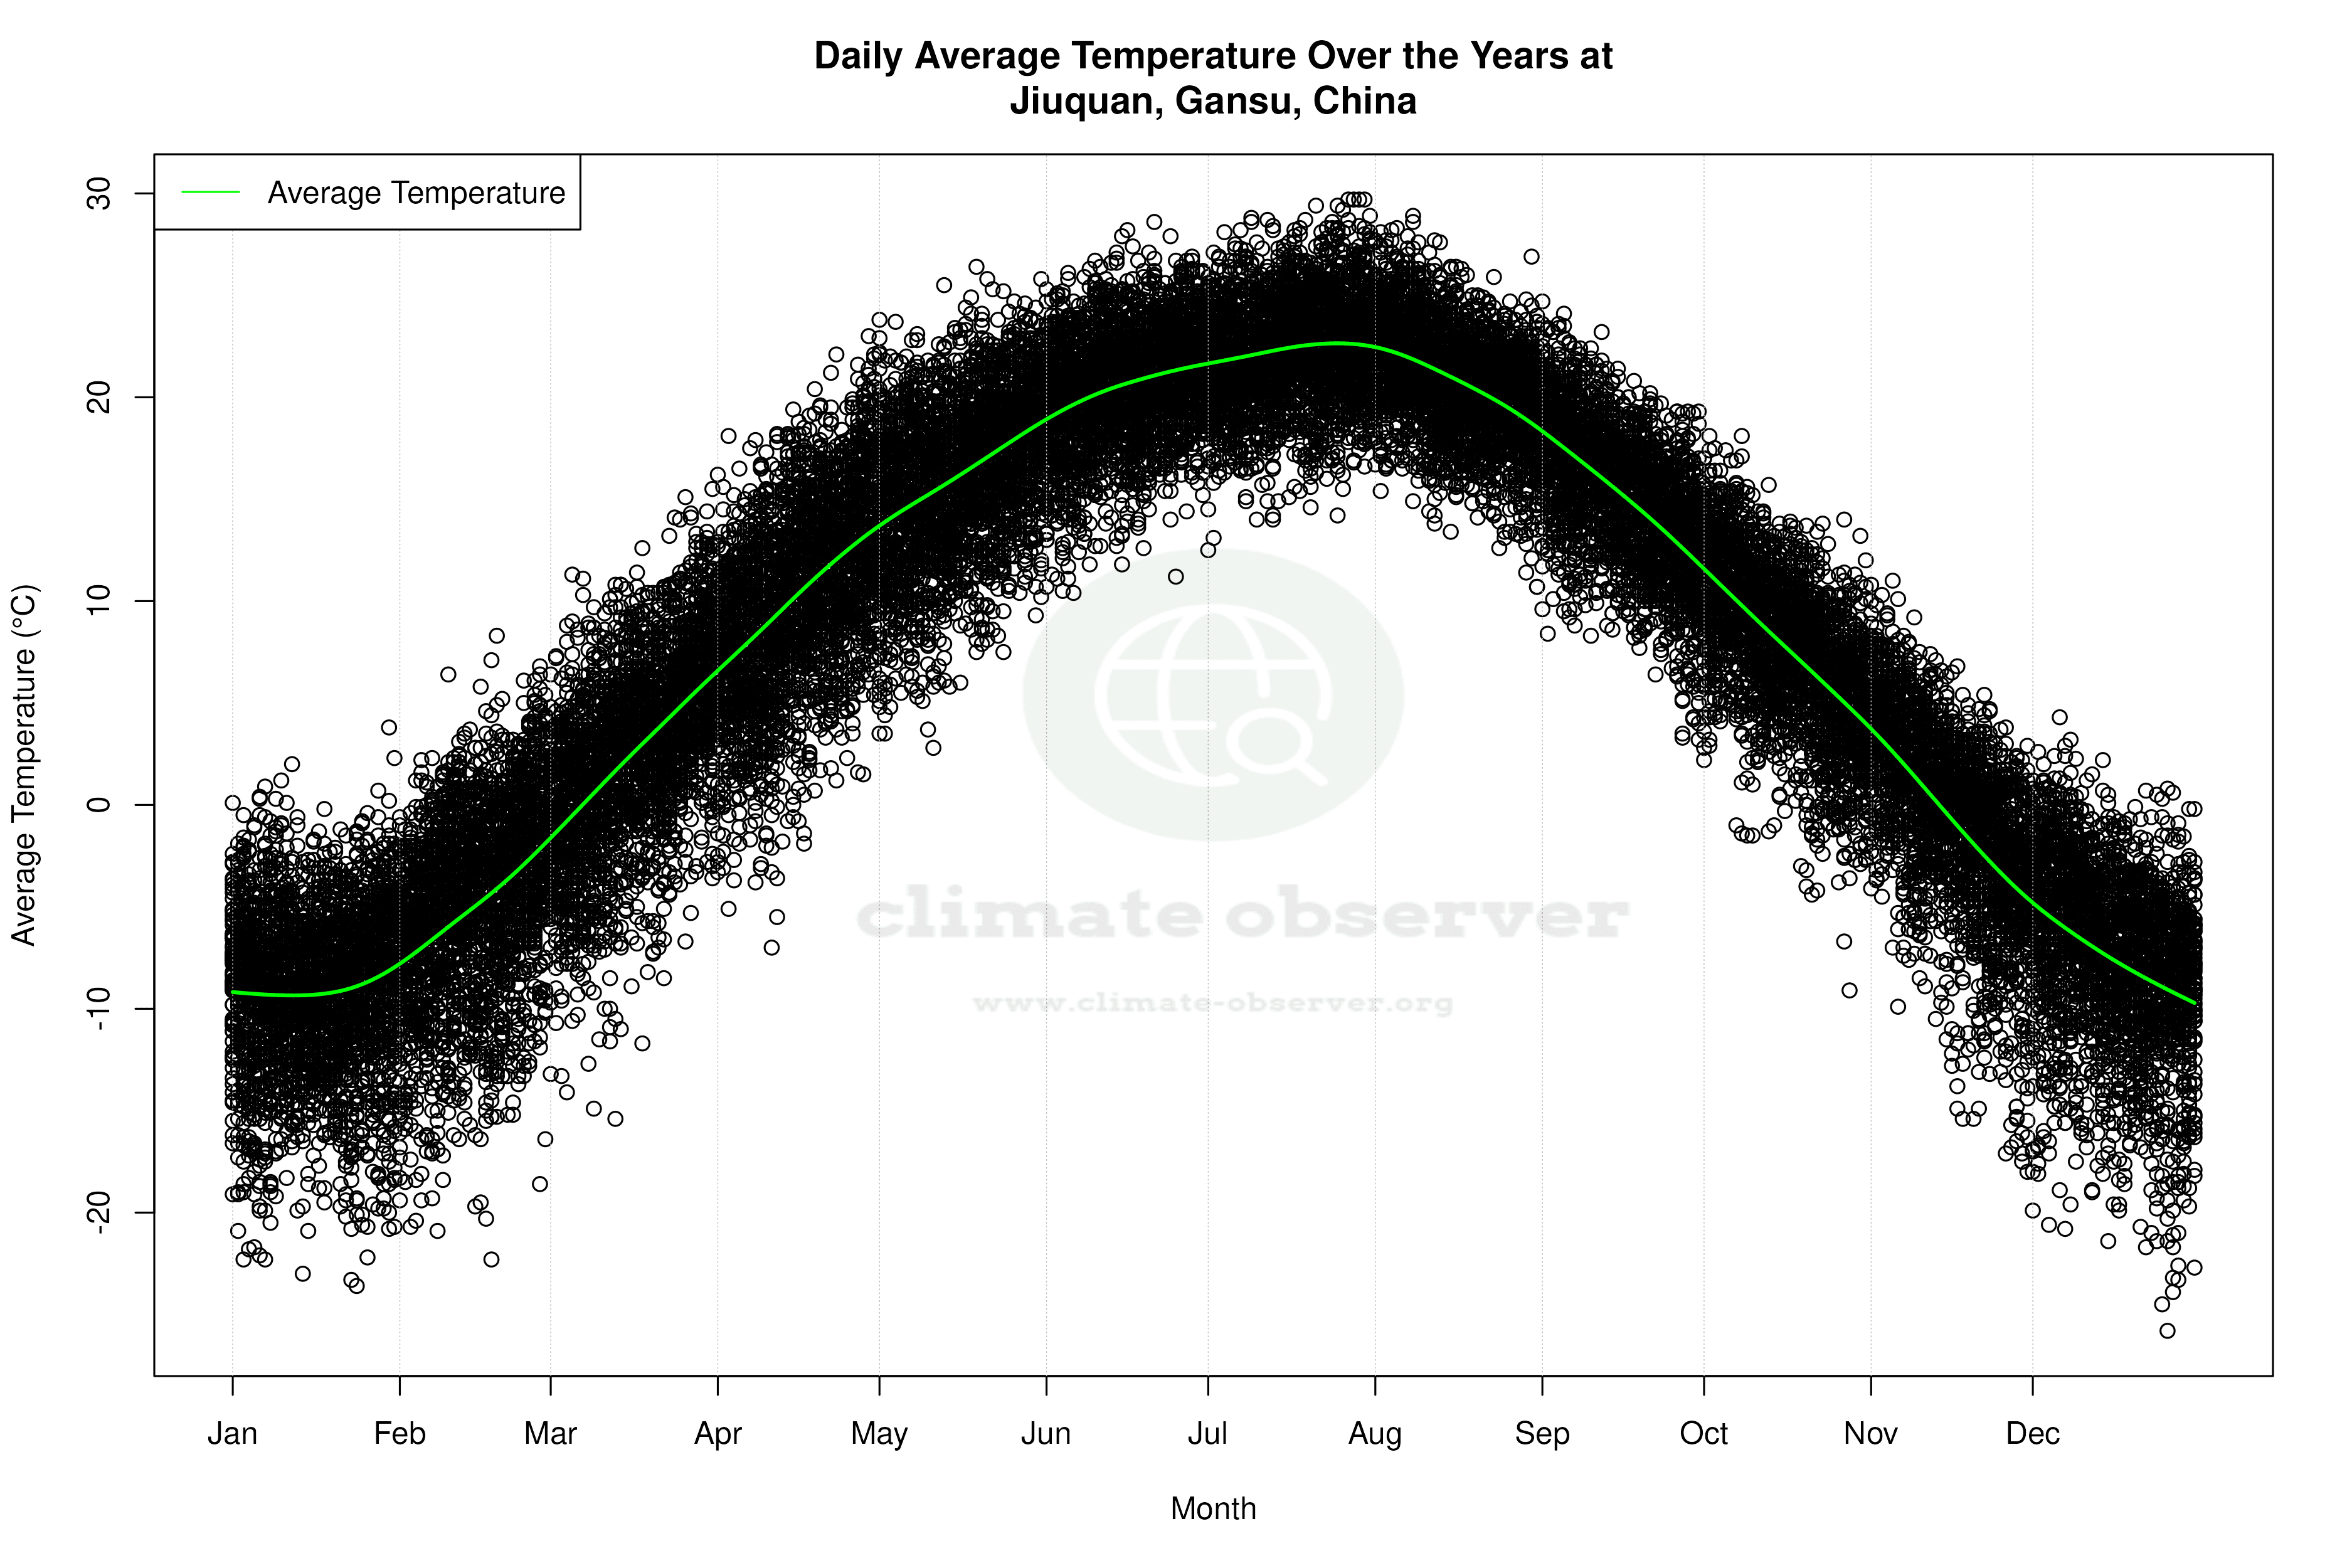
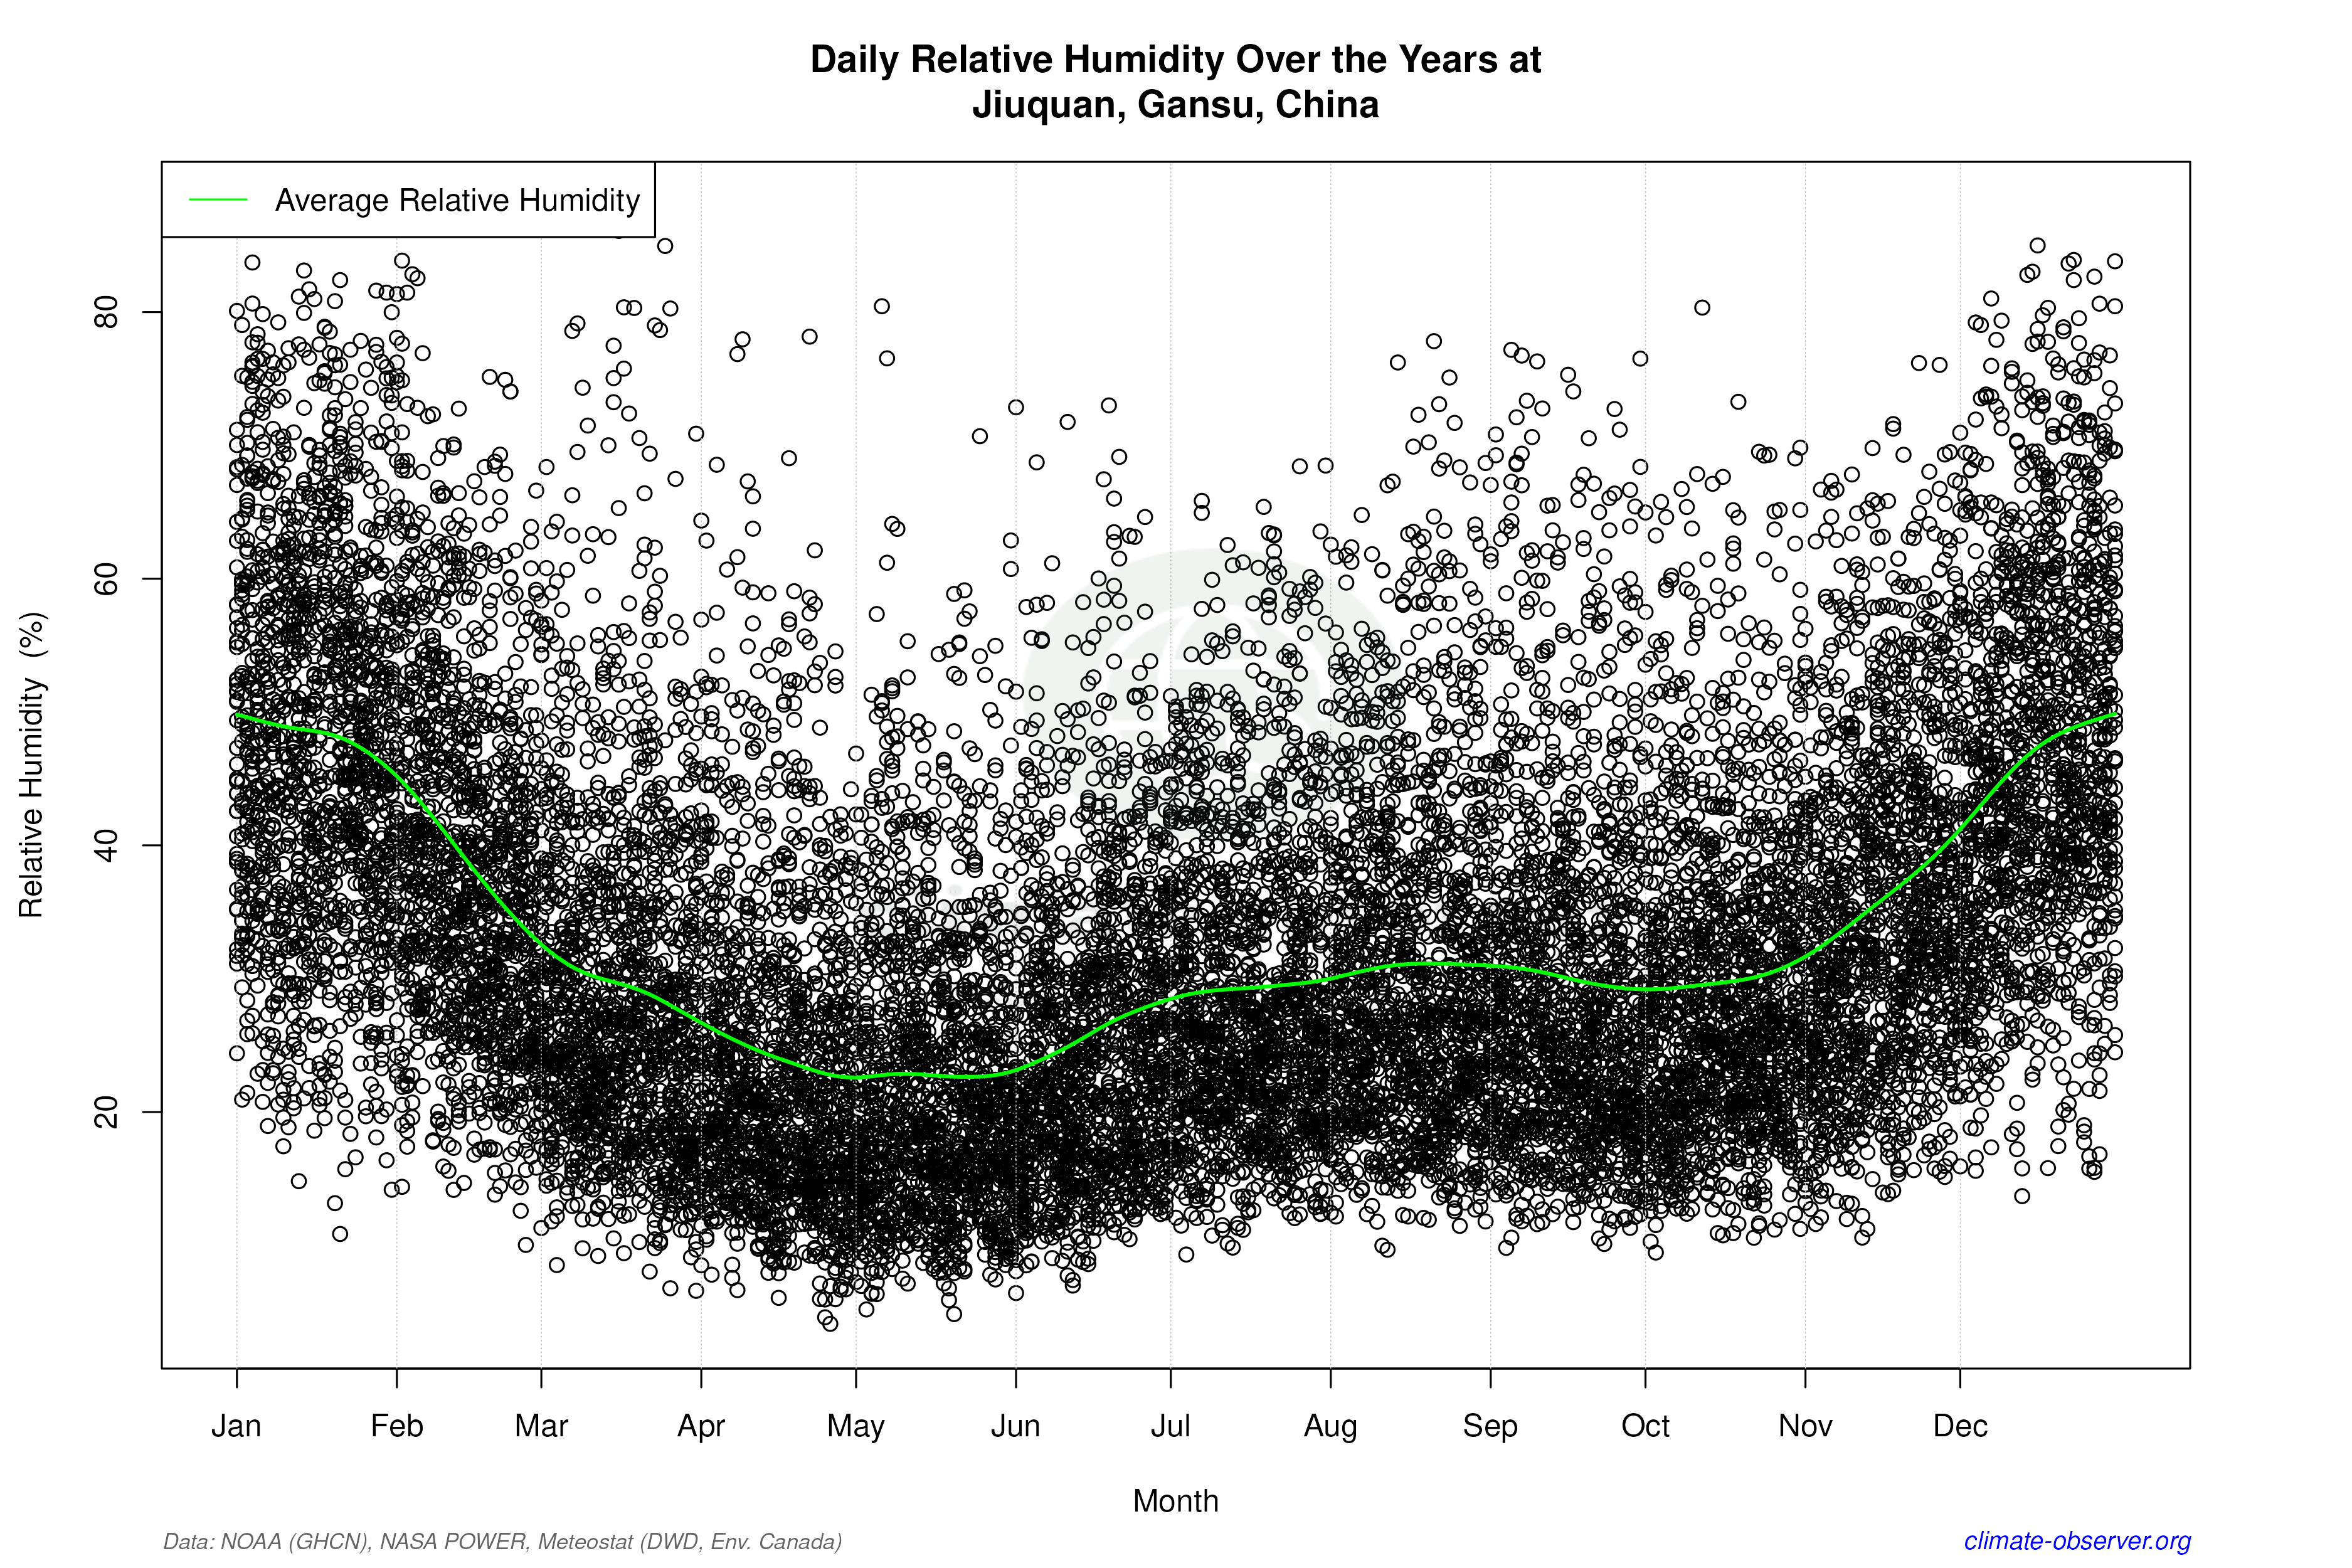

Average Max Temperature Throughout Year | 1 of 5
