Climate for Station: Wushaoling, Gansu, China
Loading live weather...
Climate Analysis & Overview
Wushaoling's climate profile reveals a complex interplay of warming and cooling trends, with a notable rise in high temperatures over the last decade. The region's precipitation has become more evenly distributed, providing a subtle shift in local weather patterns. These changes occur against the backdrop of China's ambitious climate goals, aiming to balance regional development with environmental sustainability.
Geographical Influence and Climate Classification
Wushaoling, situated in the Tianzhu Tibetan Autonomous County within Gansu Province, China, is characterised by a mountainous landscape that significantly influences its climate. The region is classified under the Köppen climate classification as a cold semi-arid climate (BSk), where elevation plays a crucial role in temperature and precipitation patterns. The altitude moderates temperatures, creating a distinct climate profile that differs from the surrounding lowlands.
Temperature Trends: A Decadal Perspective
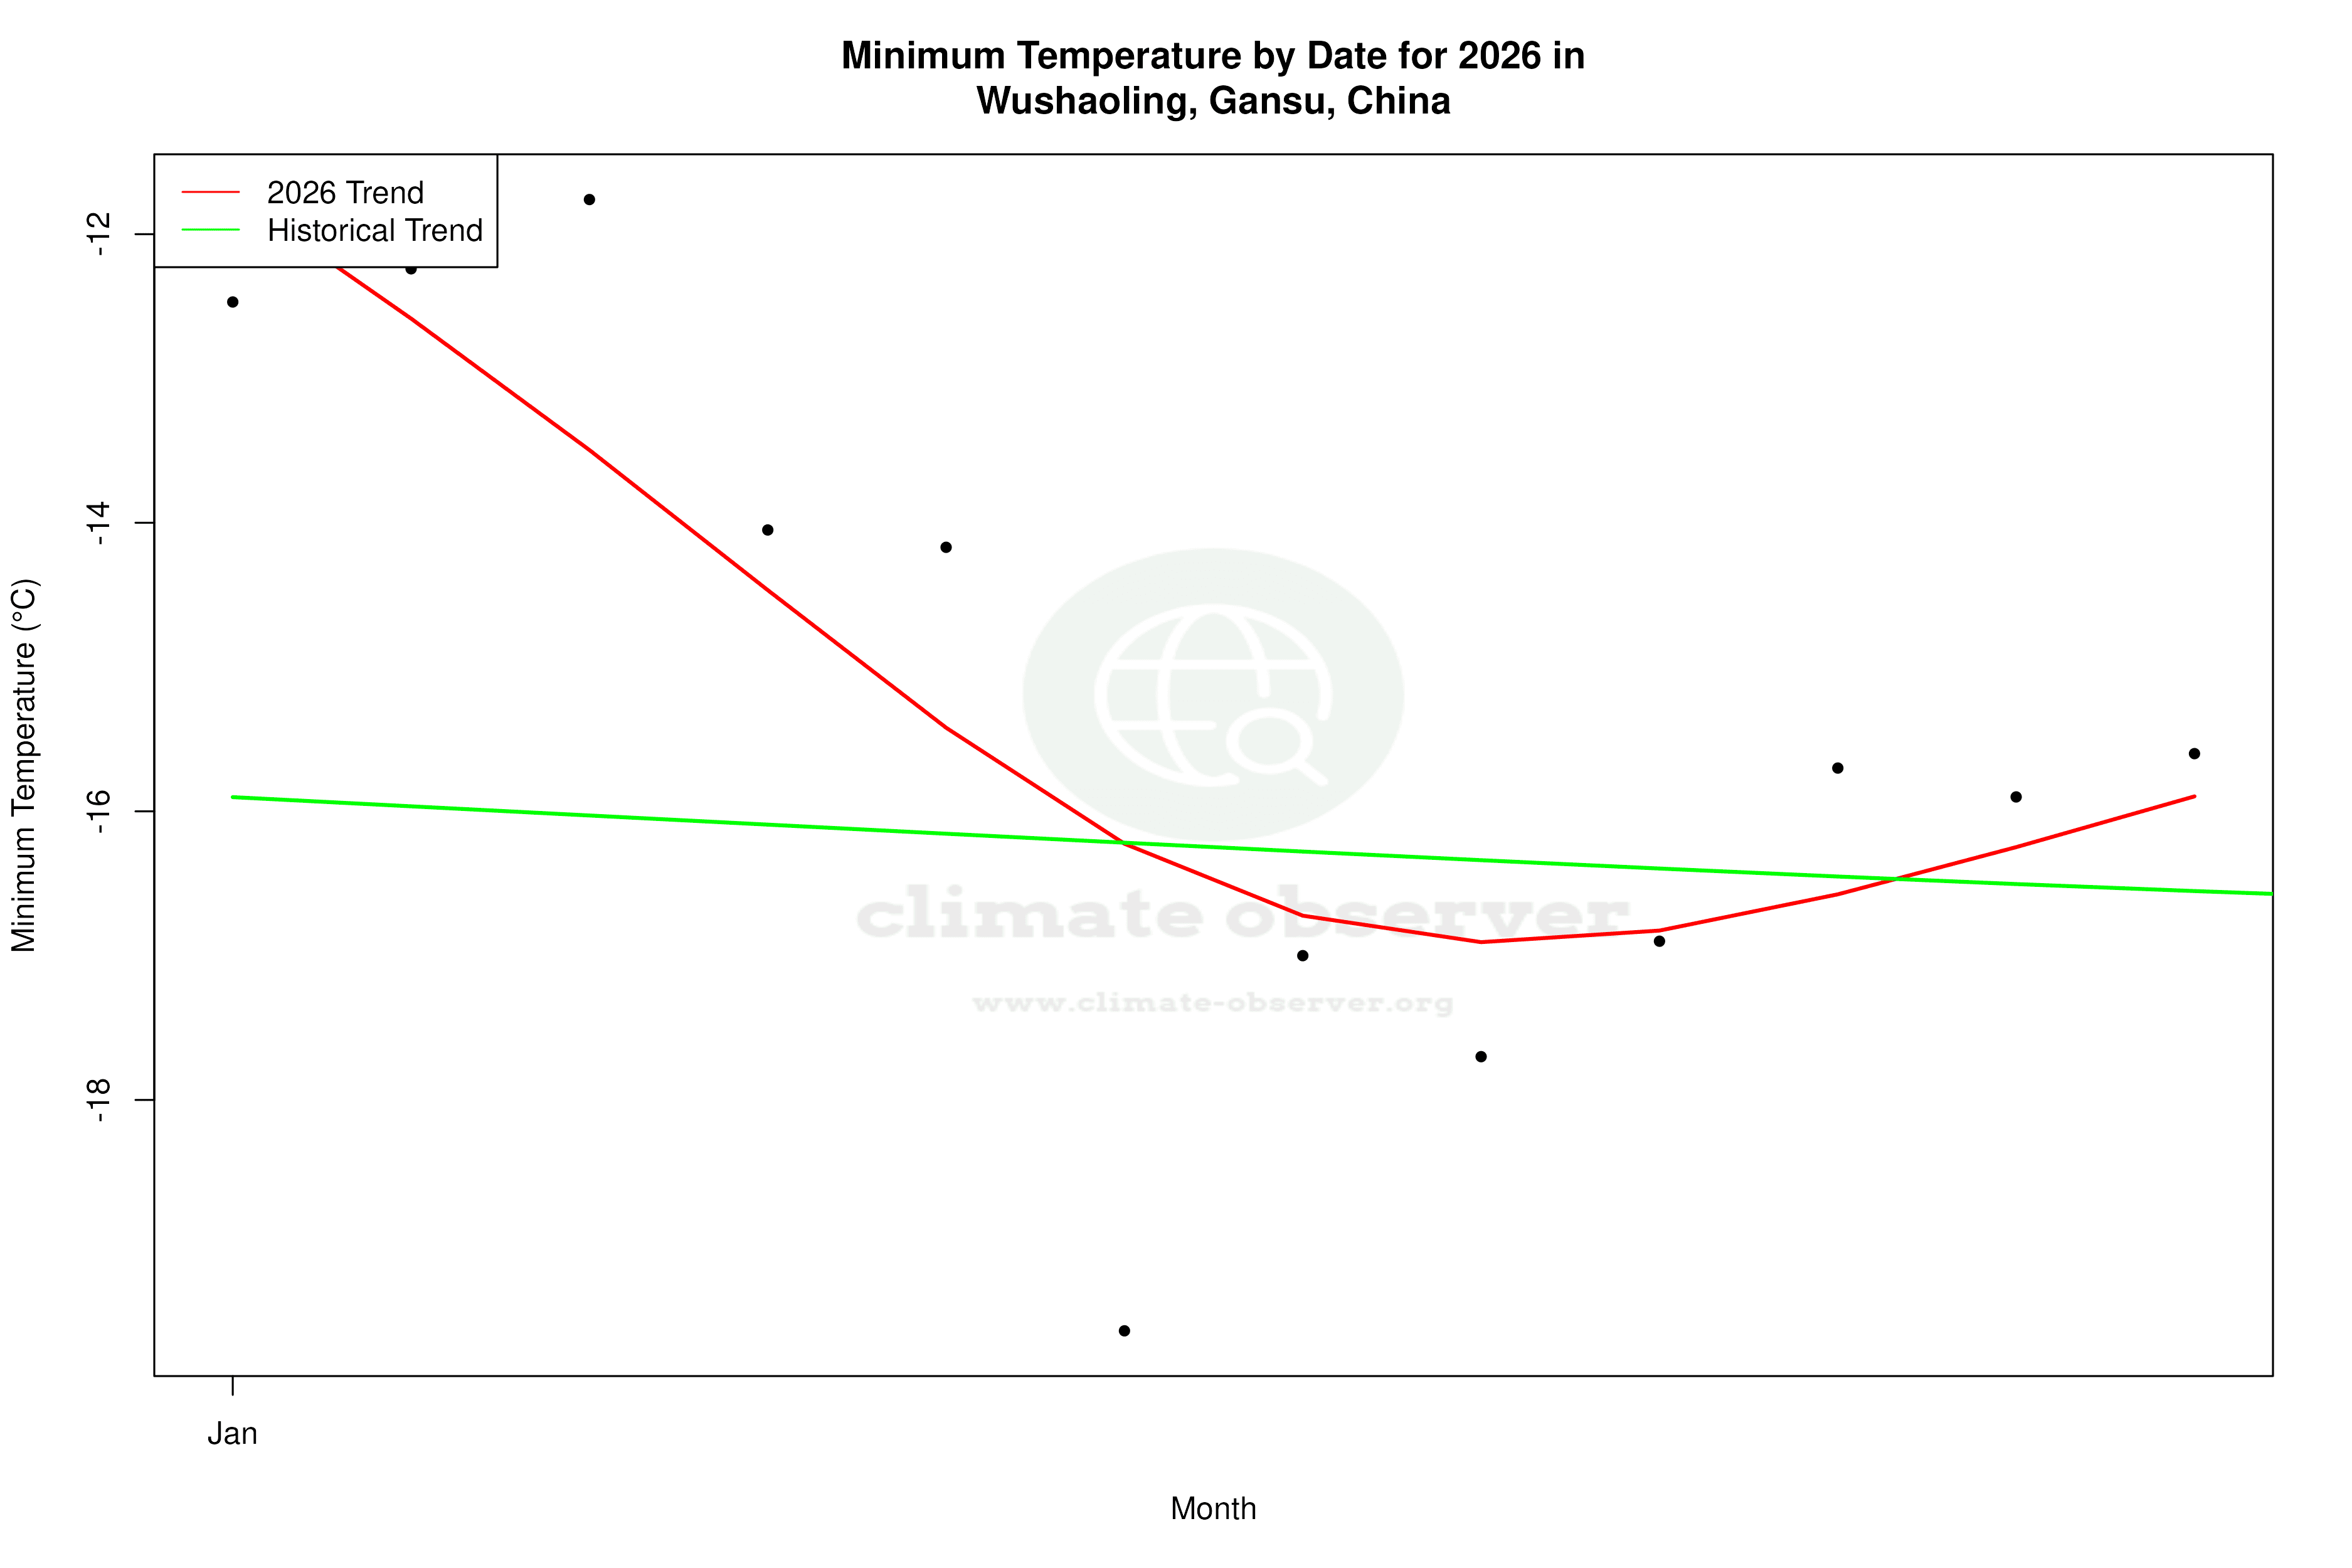
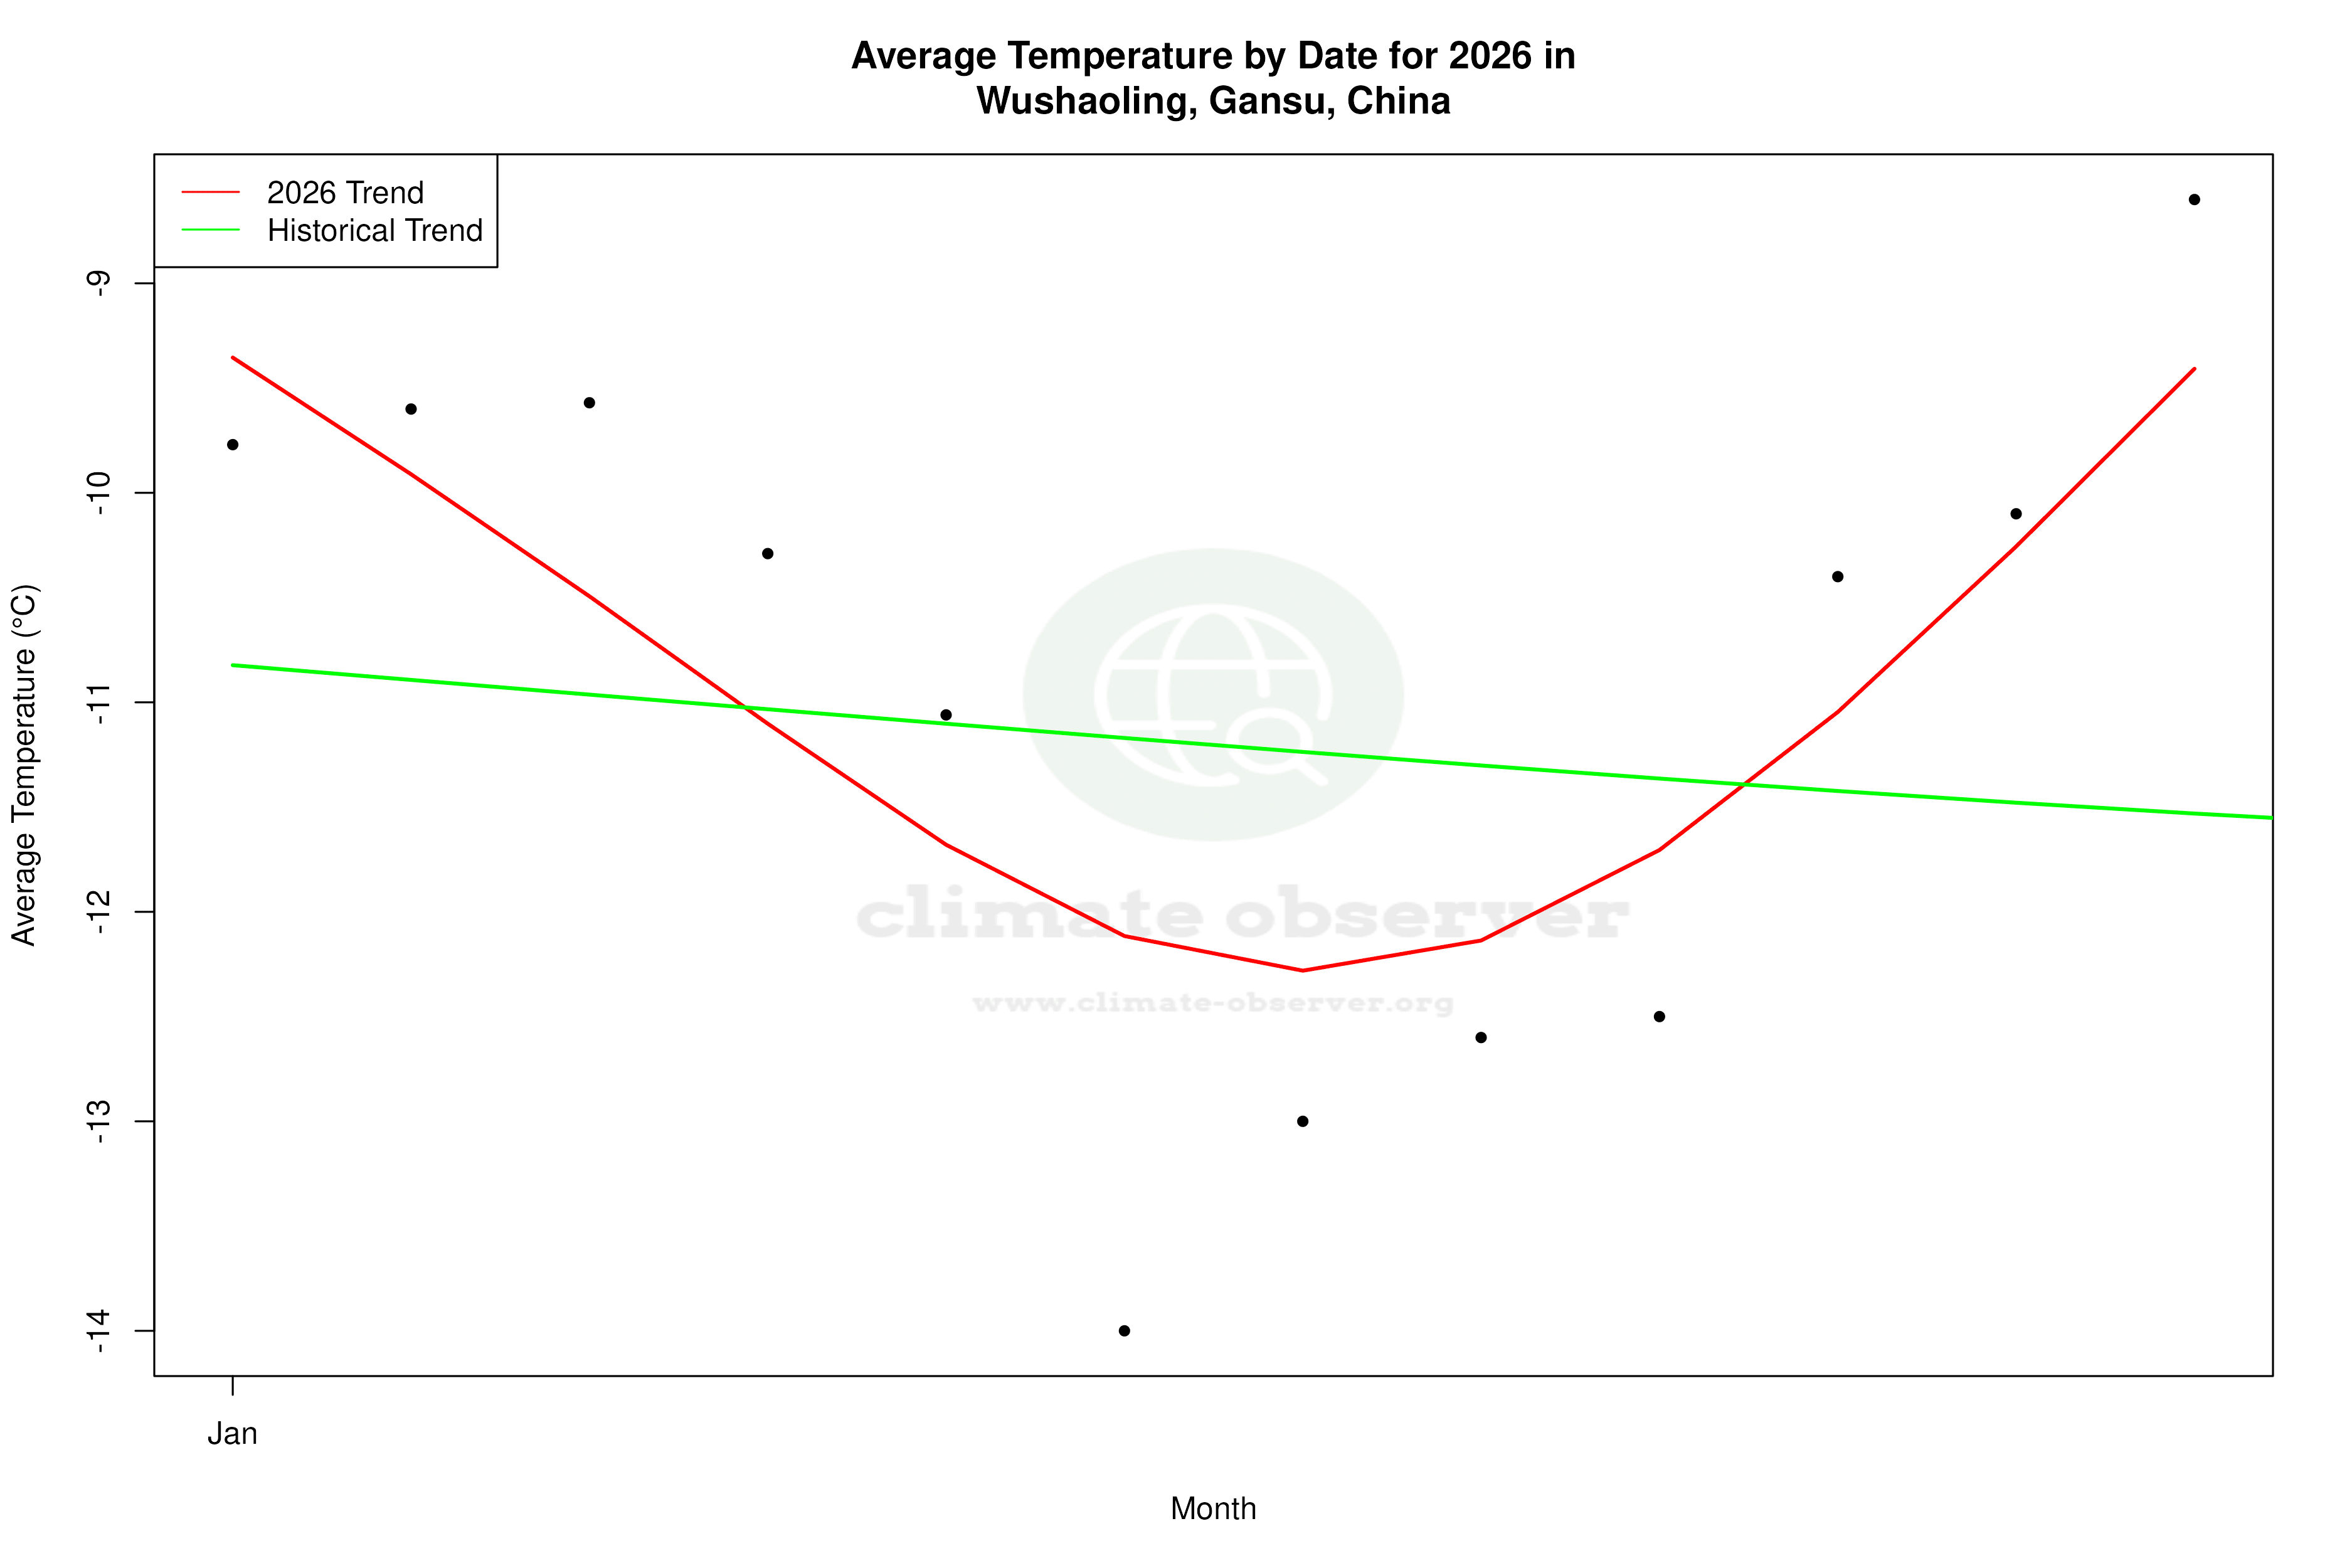
Over the past decade, Wushaoling has experienced a noticeable warming trend in high temperatures, with an increase of 1.57°C (2.83°F). This warming trend contrasts with the slight cooling observed in low temperatures, which have decreased by 0.14°C (0.25°F). These changes suggest a widening temperature range, with warmer days and slightly cooler nights. This divergence in trends could have implications for local agriculture and biodiversity, as it affects growing seasons and habitat conditions.
Long-term Thermal Shifts
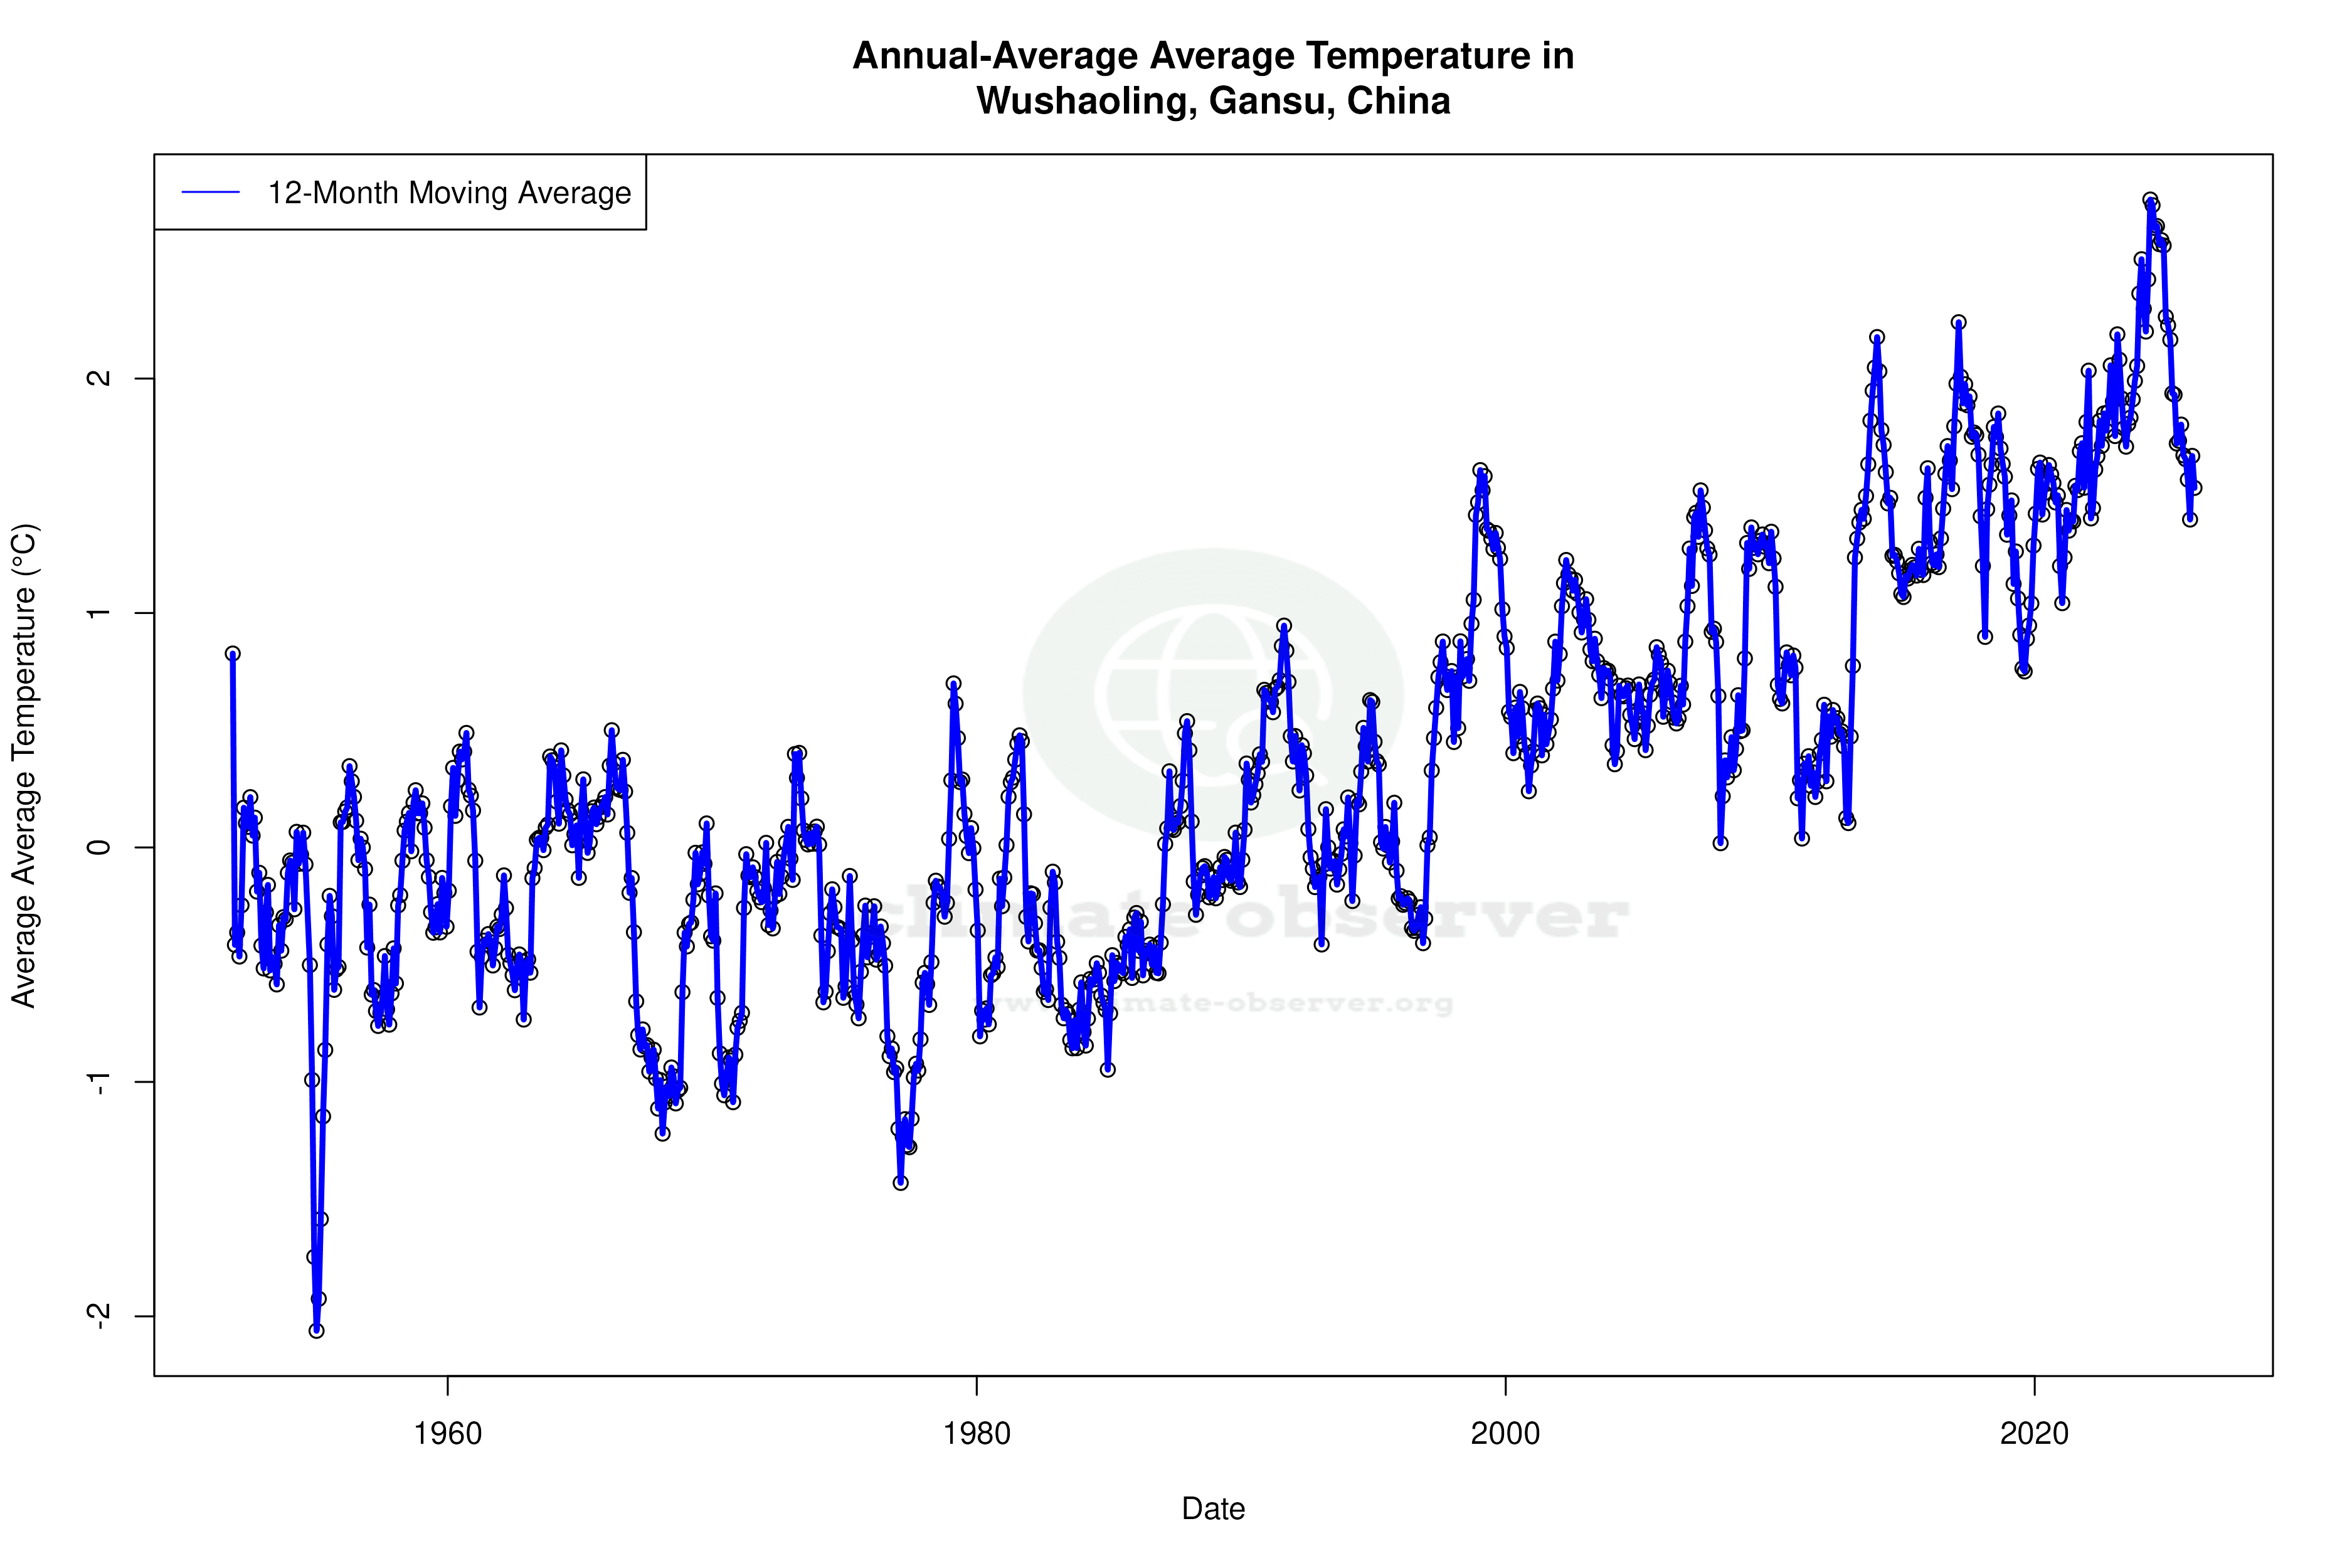
Examining the all-time temperature trends, Wushaoling has seen a modest warming in both highs and lows. High temperatures have risen by 0.25°C (0.45°F), while low temperatures have increased by 0.28°C (0.50°F). This long-term warming indicates a gradual shift towards a warmer climate, albeit at a slower pace than the recent decadal trends. Such changes align with broader regional patterns observed across China, where efforts are being made to mitigate climate impacts while pursuing economic growth.
Precipitation Patterns: A Subtle Redistribution
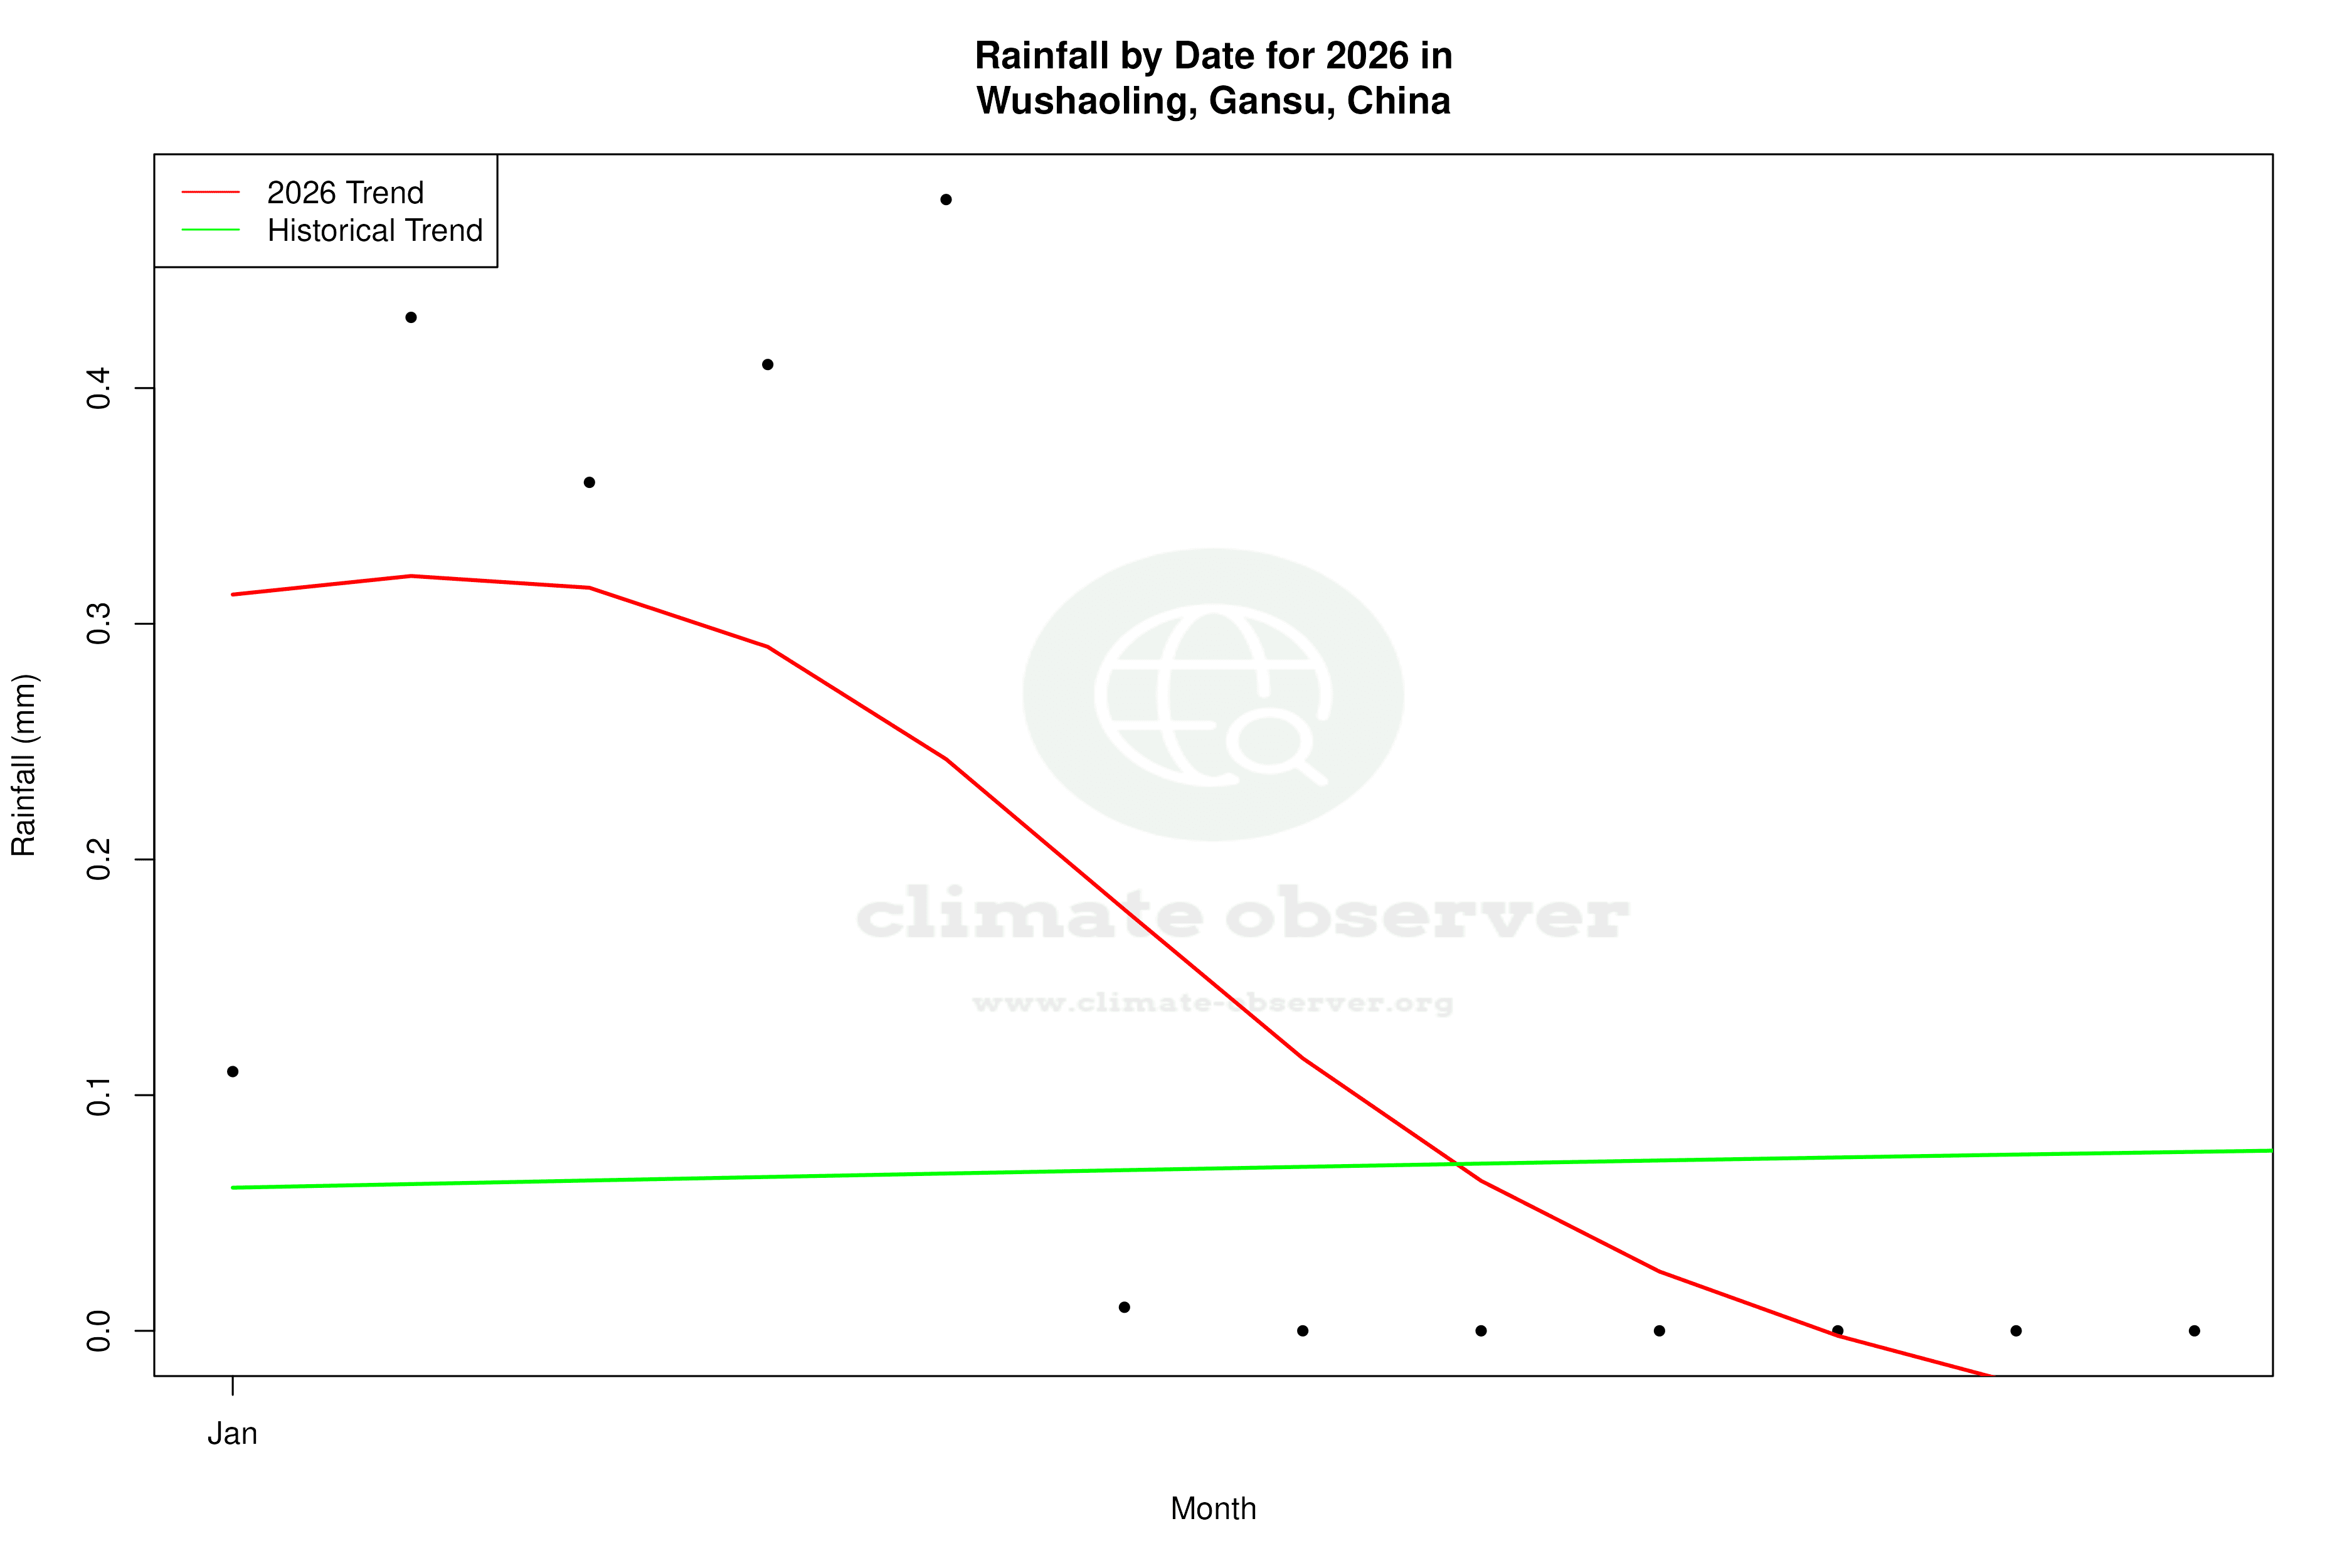
The Precipitation Concentration Index (PCI) for Wushaoling has decreased from a baseline of 17.6 to a current value of 15.7. This decline suggests a more even distribution of precipitation events throughout the year, reducing the concentration of rainfall in fewer, intense events. This subtle redistribution can benefit water management and reduce the risk of flooding, supporting local adaptation strategies in line with China's climate resilience goals.
Extreme Temperature Records
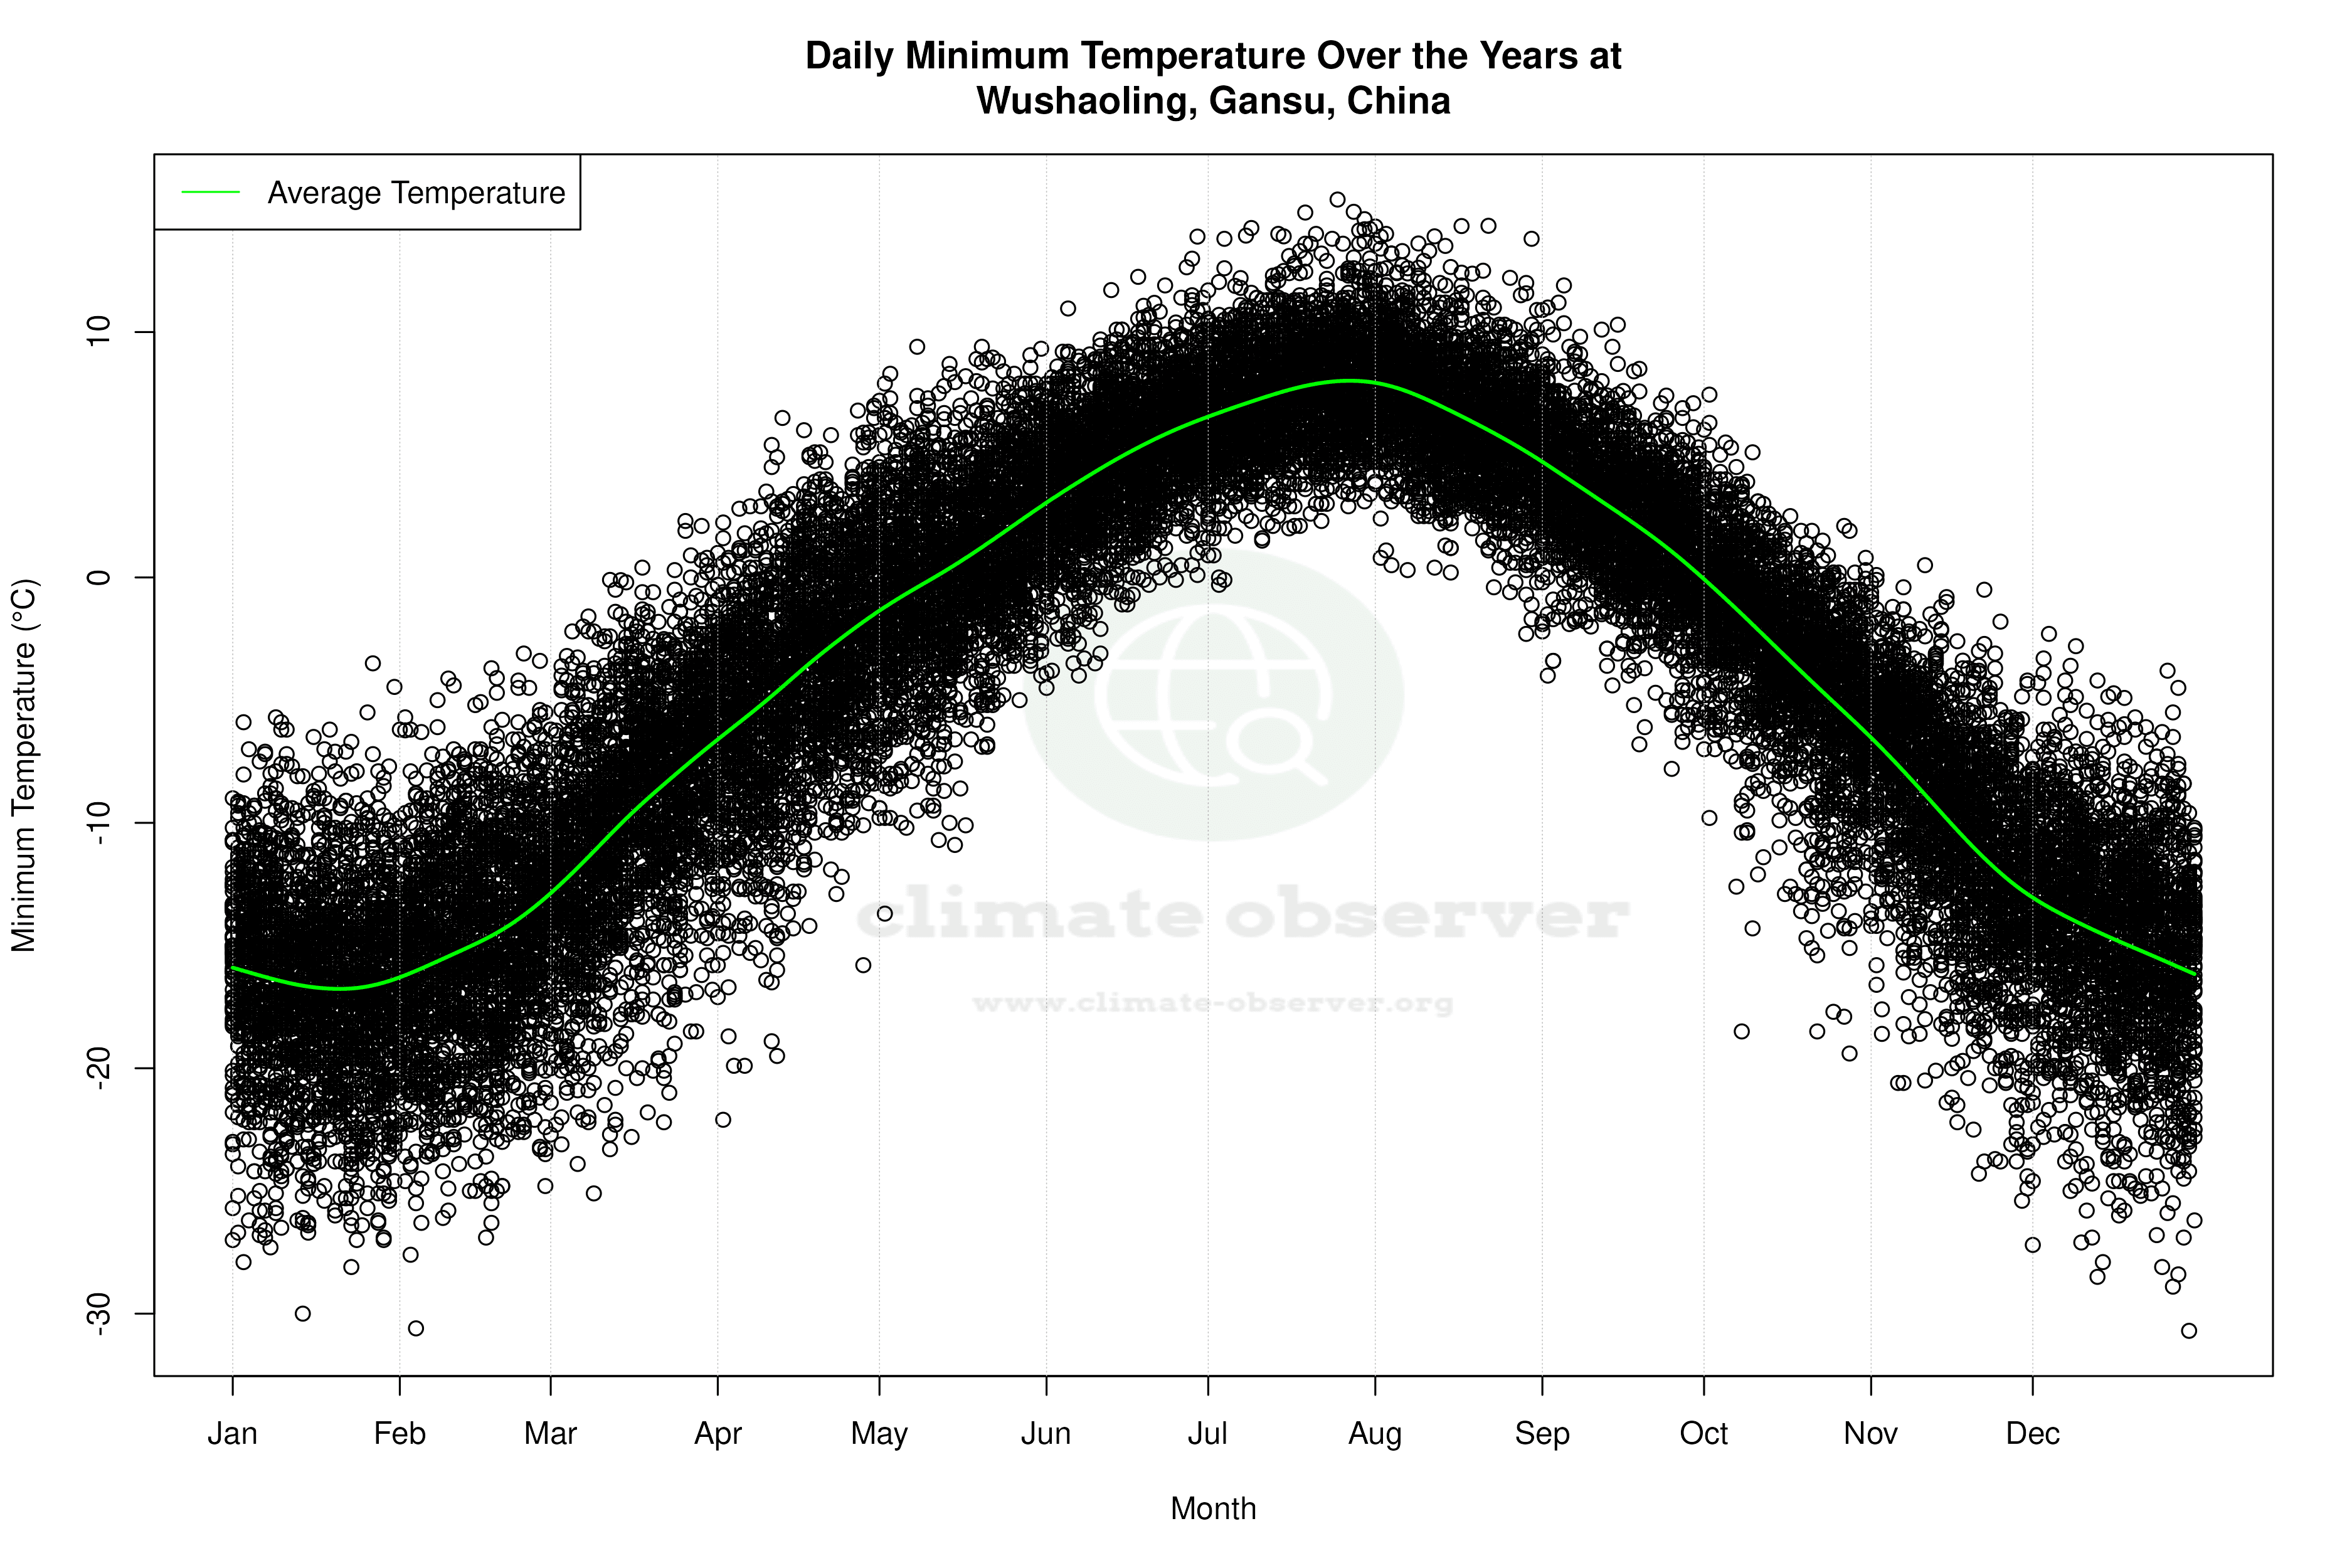
Wushaoling's temperature extremes reflect its climatic variability, with a recorded maximum of 28.1°C (82.6°F) and a minimum of -30.7°C (-23.3°F). These records highlight the region's capacity for both heat and cold, underlining the importance of adaptive measures in infrastructure and community planning to cope with such extremes.
Station Statistics
10-Year Trend
High: +4.78 °F/decade
Low: +1.52 °F/decade
Rain: -0.000 in/decade
25-Year Trend
High: +1.02 °F/decade
Low: +0.20 °F/decade
Rain: +0.006 in/decade
50-Year Trend
High: +1.06 °F/decade
Low: +0.90 °F/decade
Rain: +0.004 in/decade
All-Time Trend
High: +0.41 °F/decade
Low: +0.50 °F/decade
Rain: +0.002 in/decade
Percentage Above-Average Days
Last 12 Months: 57.0%
This Year: 59.1%
Precipitation Concentration Index (PCI) ℹ️
Last 12 Months: 13.9
Historical Average: 17.5
Percentile Rank of Last 12 Months ℹ️
High: 83rd percentile
Low: 93rd percentile
Rain: 93rd percentile
Change in Variance ℹ️
High: +2.5%
Low: +4.3%
Intraday: +44.5%
Data Coverage
100.0%
First Year of Data
1951
Station Location
Historical Weather Records
| Max High | Avg High | Min High | Max Avg | Avg Avg | Min Avg | Max Low | Avg Low | Min Low | Max Precipitation | Avg Precipitation | Max Snow | Avg Snow | |
|---|---|---|---|---|---|---|---|---|---|---|---|---|---|
| Record | 82.58 °F | — | -7.78 °F | 69.98 °F | — | -14.08 °F | 60.80 °F | — | -23.26 °F | 1.97 in | — | — | — |
| January | 50.36 °F | 22.78 °F | -7.78 °F | 36.68 °F | 11.30 °F | -10.84 °F | 30.20 °F | 2.36 °F | -22.00 °F | 0.20 in | 0.00 in | — | — |
| February | 57.02 °F | 26.12 °F | -2.74 °F | 43.52 °F | 14.23 °F | -12.82 °F | 29.30 °F | 5.46 °F | -23.08 °F | 0.24 in | 0.01 in | — | — |
| March | 65.66 °F | 34.16 °F | 4.10 °F | 49.46 °F | 23.09 °F | -3.64 °F | 36.14 °F | 14.77 °F | -13.18 °F | 0.78 in | 0.02 in | — | — |
| April | 71.60 °F | 43.97 °F | 8.24 °F | 55.94 °F | 33.27 °F | 0.86 °F | 44.60 °F | 24.93 °F | -7.78 °F | 0.65 in | 0.03 in | — | — |
| May | 76.30 °F | 52.14 °F | 21.92 °F | 62.96 °F | 41.96 °F | 17.96 °F | 53.60 °F | 33.40 °F | 7.34 °F | 1.74 in | 0.05 in | — | — |
| June | 80.06 °F | 58.52 °F | 29.84 °F | 64.94 °F | 49.18 °F | 26.42 °F | 57.00 °F | 40.98 °F | 23.90 °F | 1.97 in | 0.09 in | — | — |
| July | 82.58 °F | 62.24 °F | 44.60 °F | 69.98 °F | 53.27 °F | 39.20 °F | 60.80 °F | 45.50 °F | 31.46 °F | 1.78 in | 0.11 in | — | — |
| August | 79.16 °F | 60.75 °F | 39.02 °F | 65.84 °F | 51.34 °F | 32.90 °F | 59.00 °F | 43.97 °F | 27.86 °F | 1.68 in | 0.12 in | — | — |
| September | 73.40 °F | 52.91 °F | 28.22 °F | 59.18 °F | 43.43 °F | 21.92 °F | 53.42 °F | 36.62 °F | 17.96 °F | 1.55 in | 0.09 in | — | — |
| October | 70.34 °F | 43.76 °F | 16.52 °F | 54.32 °F | 33.42 °F | 7.34 °F | 46.40 °F | 26.23 °F | -2.92 °F | 0.78 in | 0.03 in | — | — |
| November | 59.72 °F | 33.44 °F | -0.22 °F | 44.06 °F | 22.37 °F | -4.72 °F | 32.90 °F | 14.22 °F | -13.72 °F | 0.24 in | 0.01 in | — | — |
| December | 49.82 °F | 26.00 °F | -5.98 °F | 36.50 °F | 14.68 °F | -14.08 °F | 27.86 °F | 5.68 °F | -23.26 °F | 0.14 in | 0.00 in | — | — |
Data Visualisations
Remove WatermarksCurrent Year Climate Trends vs Historical
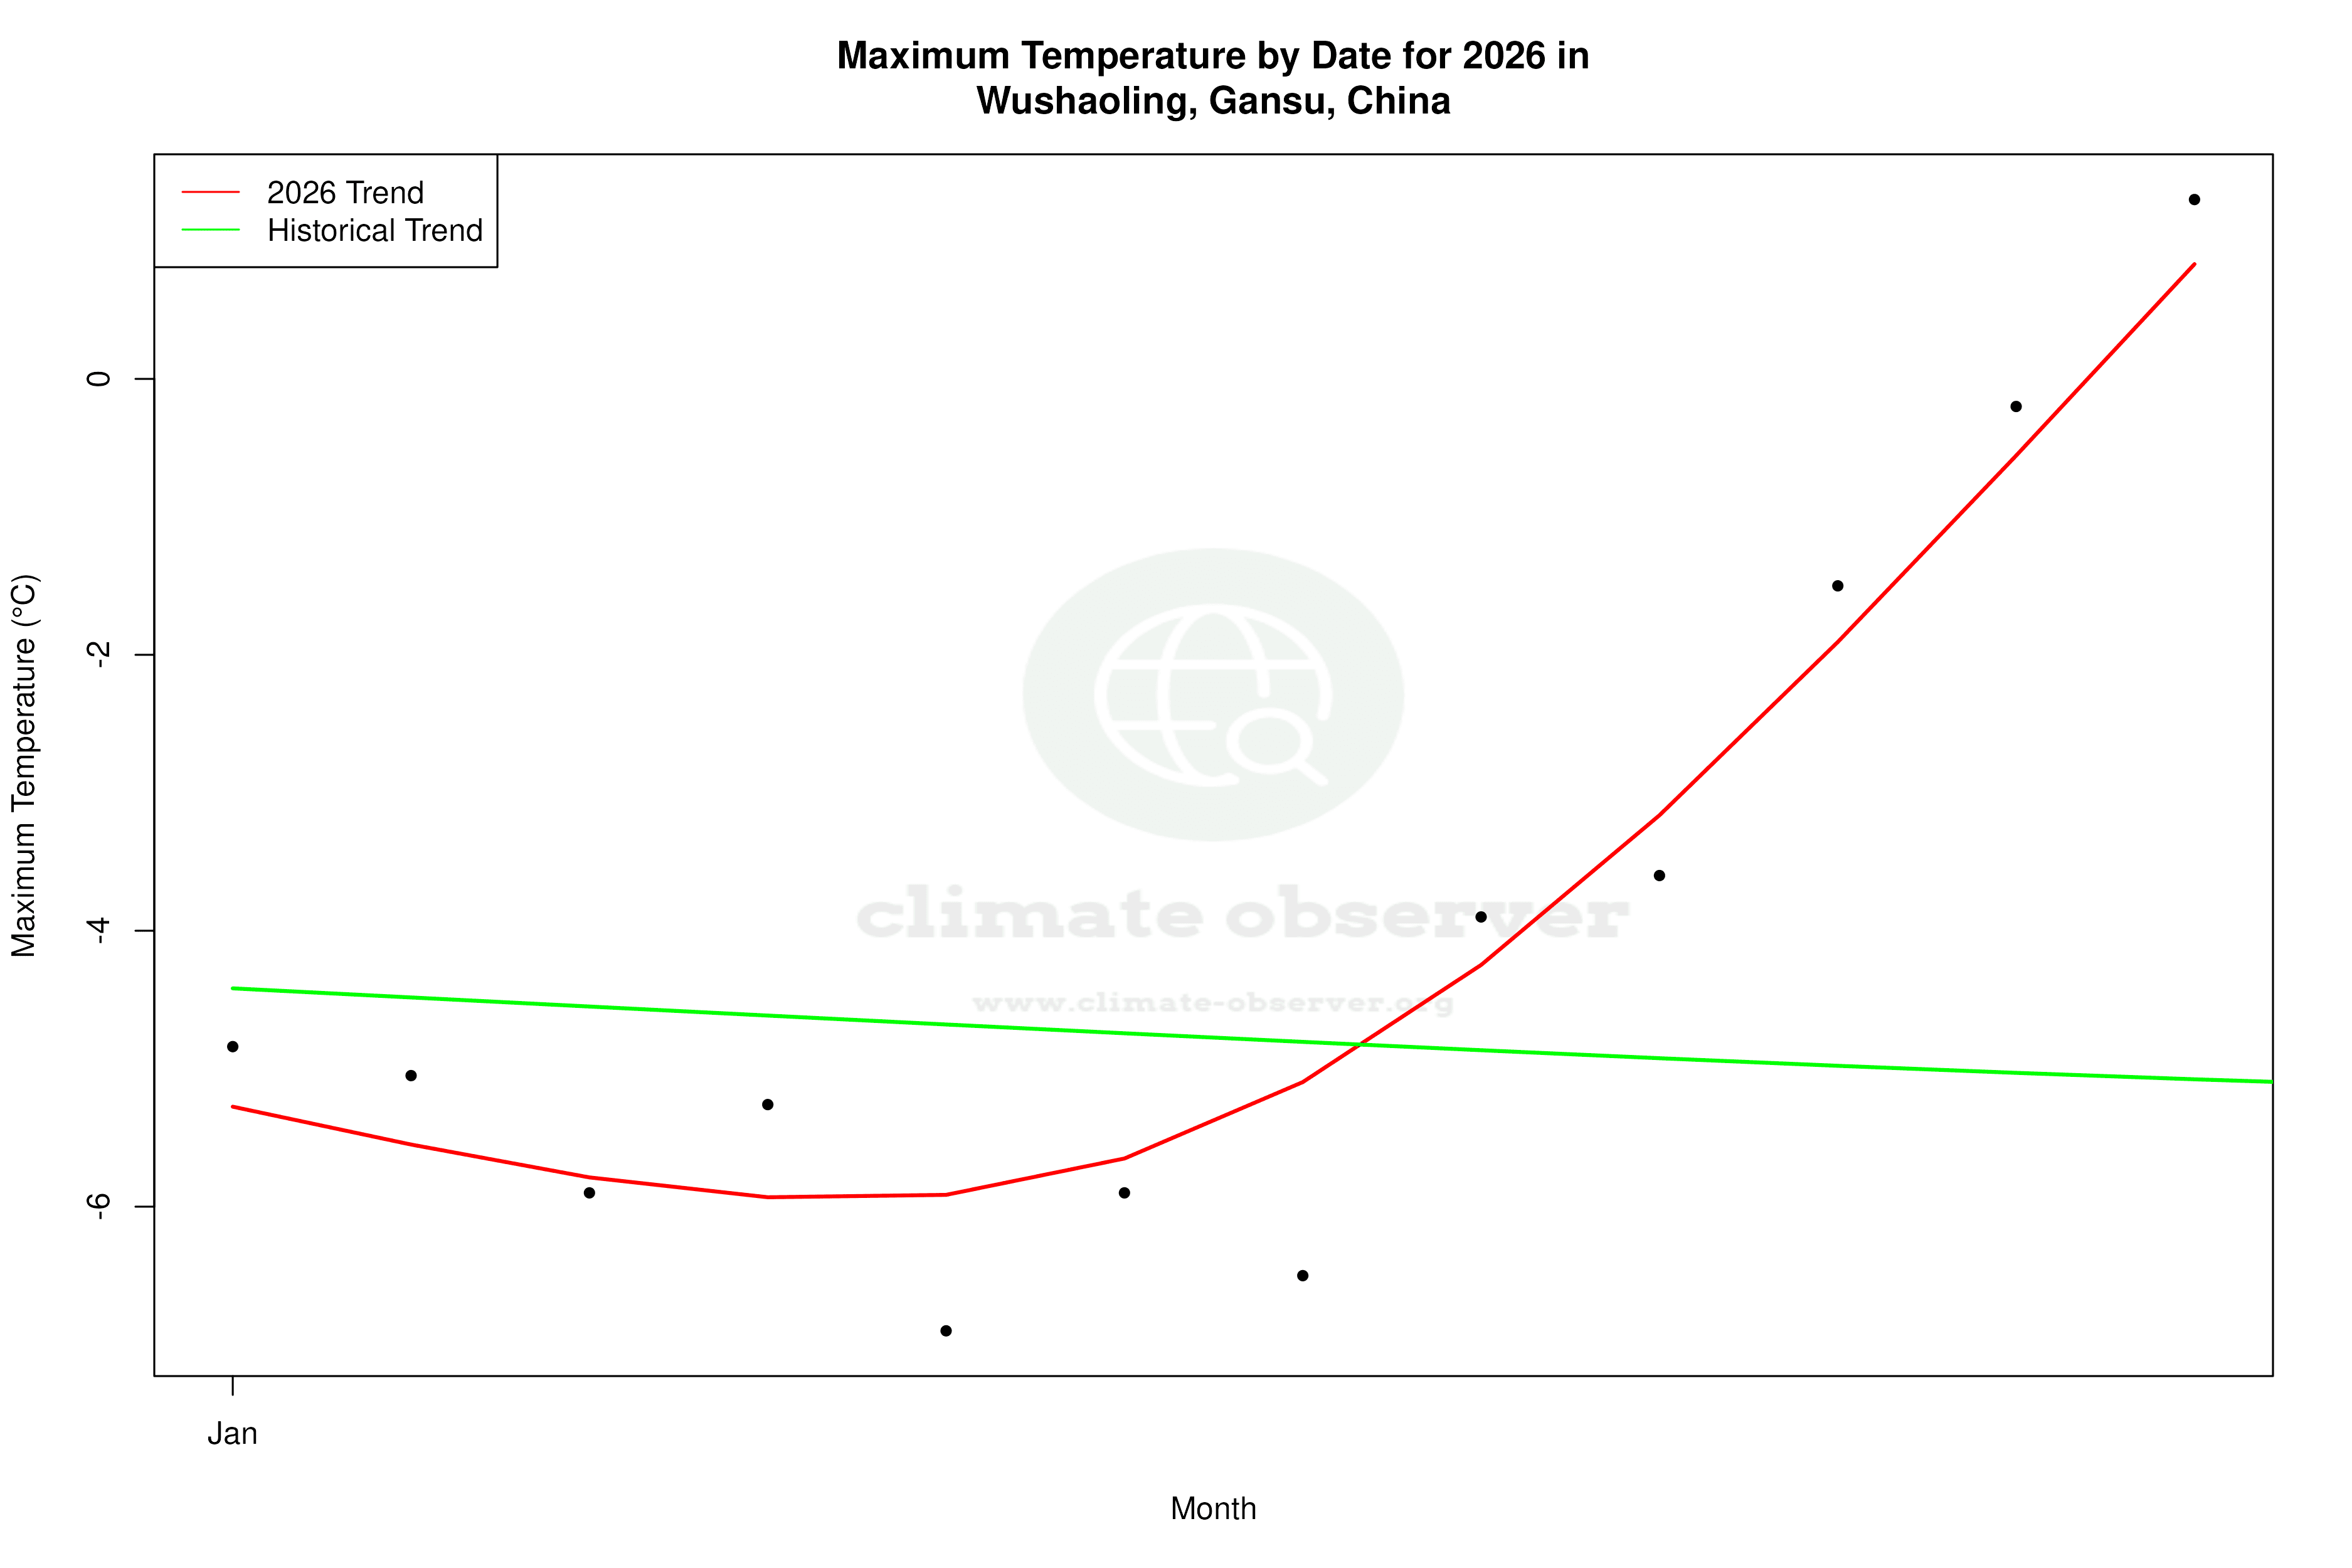


Max Temperature this Year | 1 of 6
Climate 12-Month Moving Averages
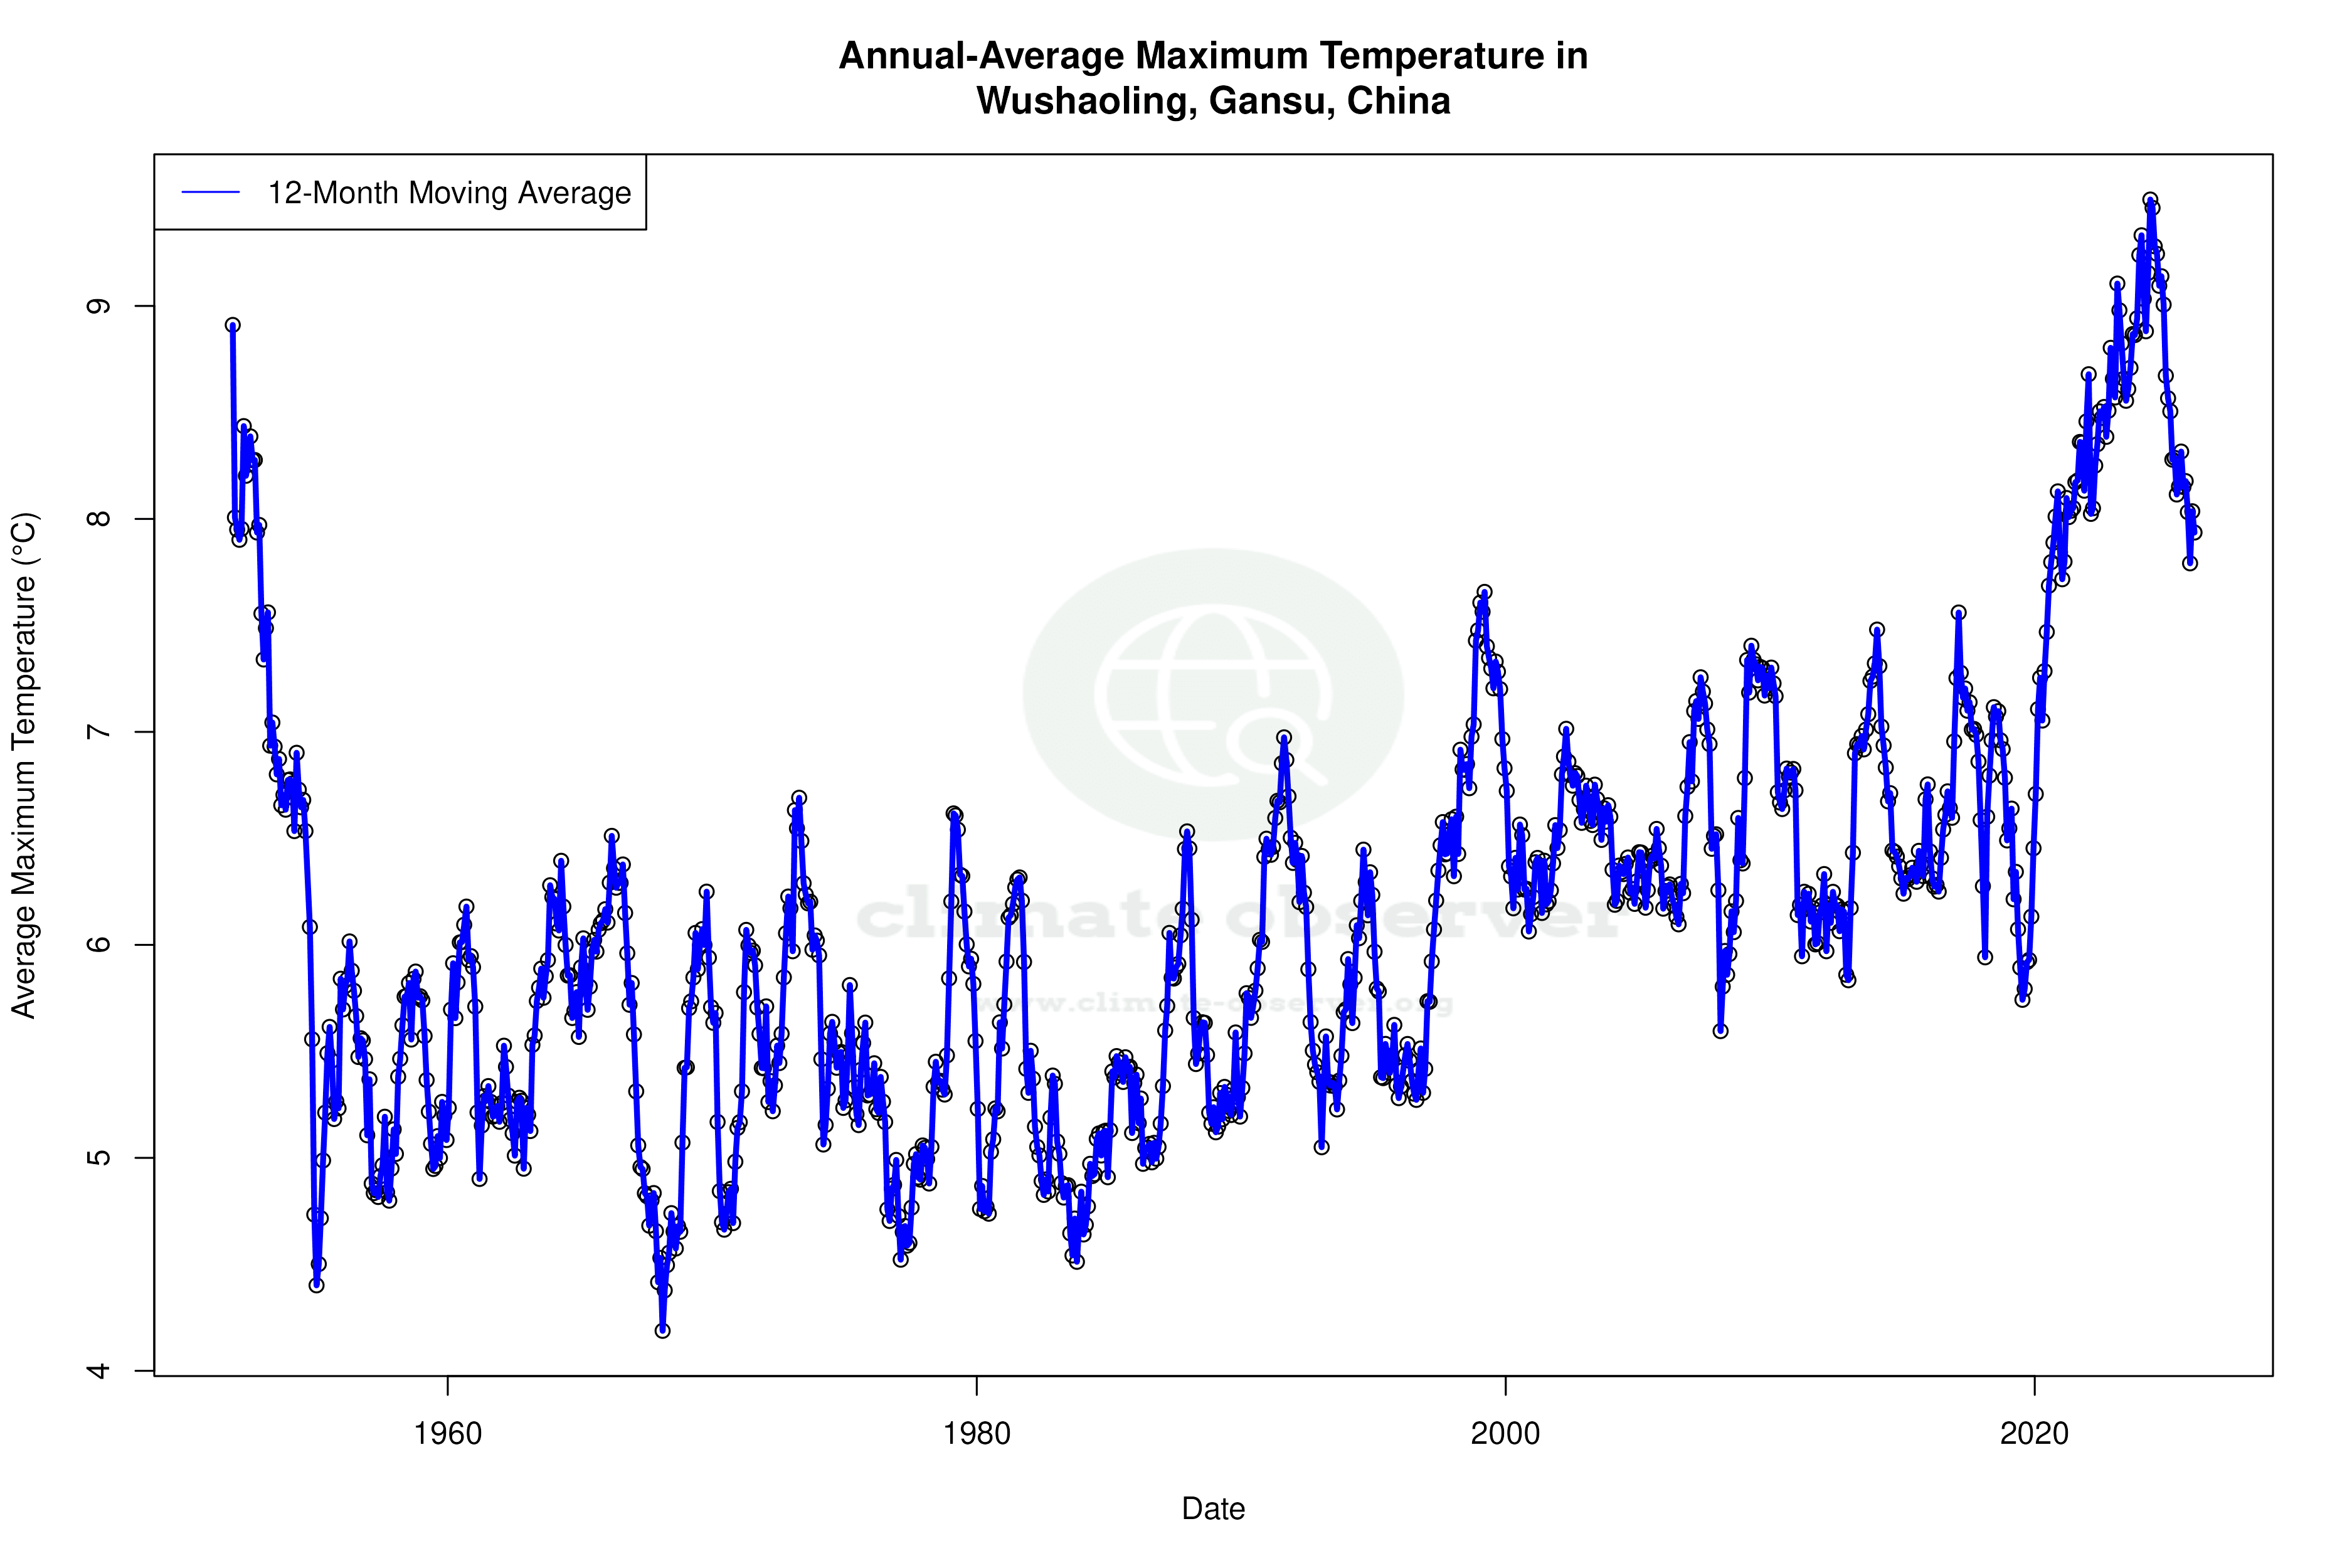


Max Temperature 12-Month MA | 1 of 6
Daily Data Points and Averages Throughout the Year
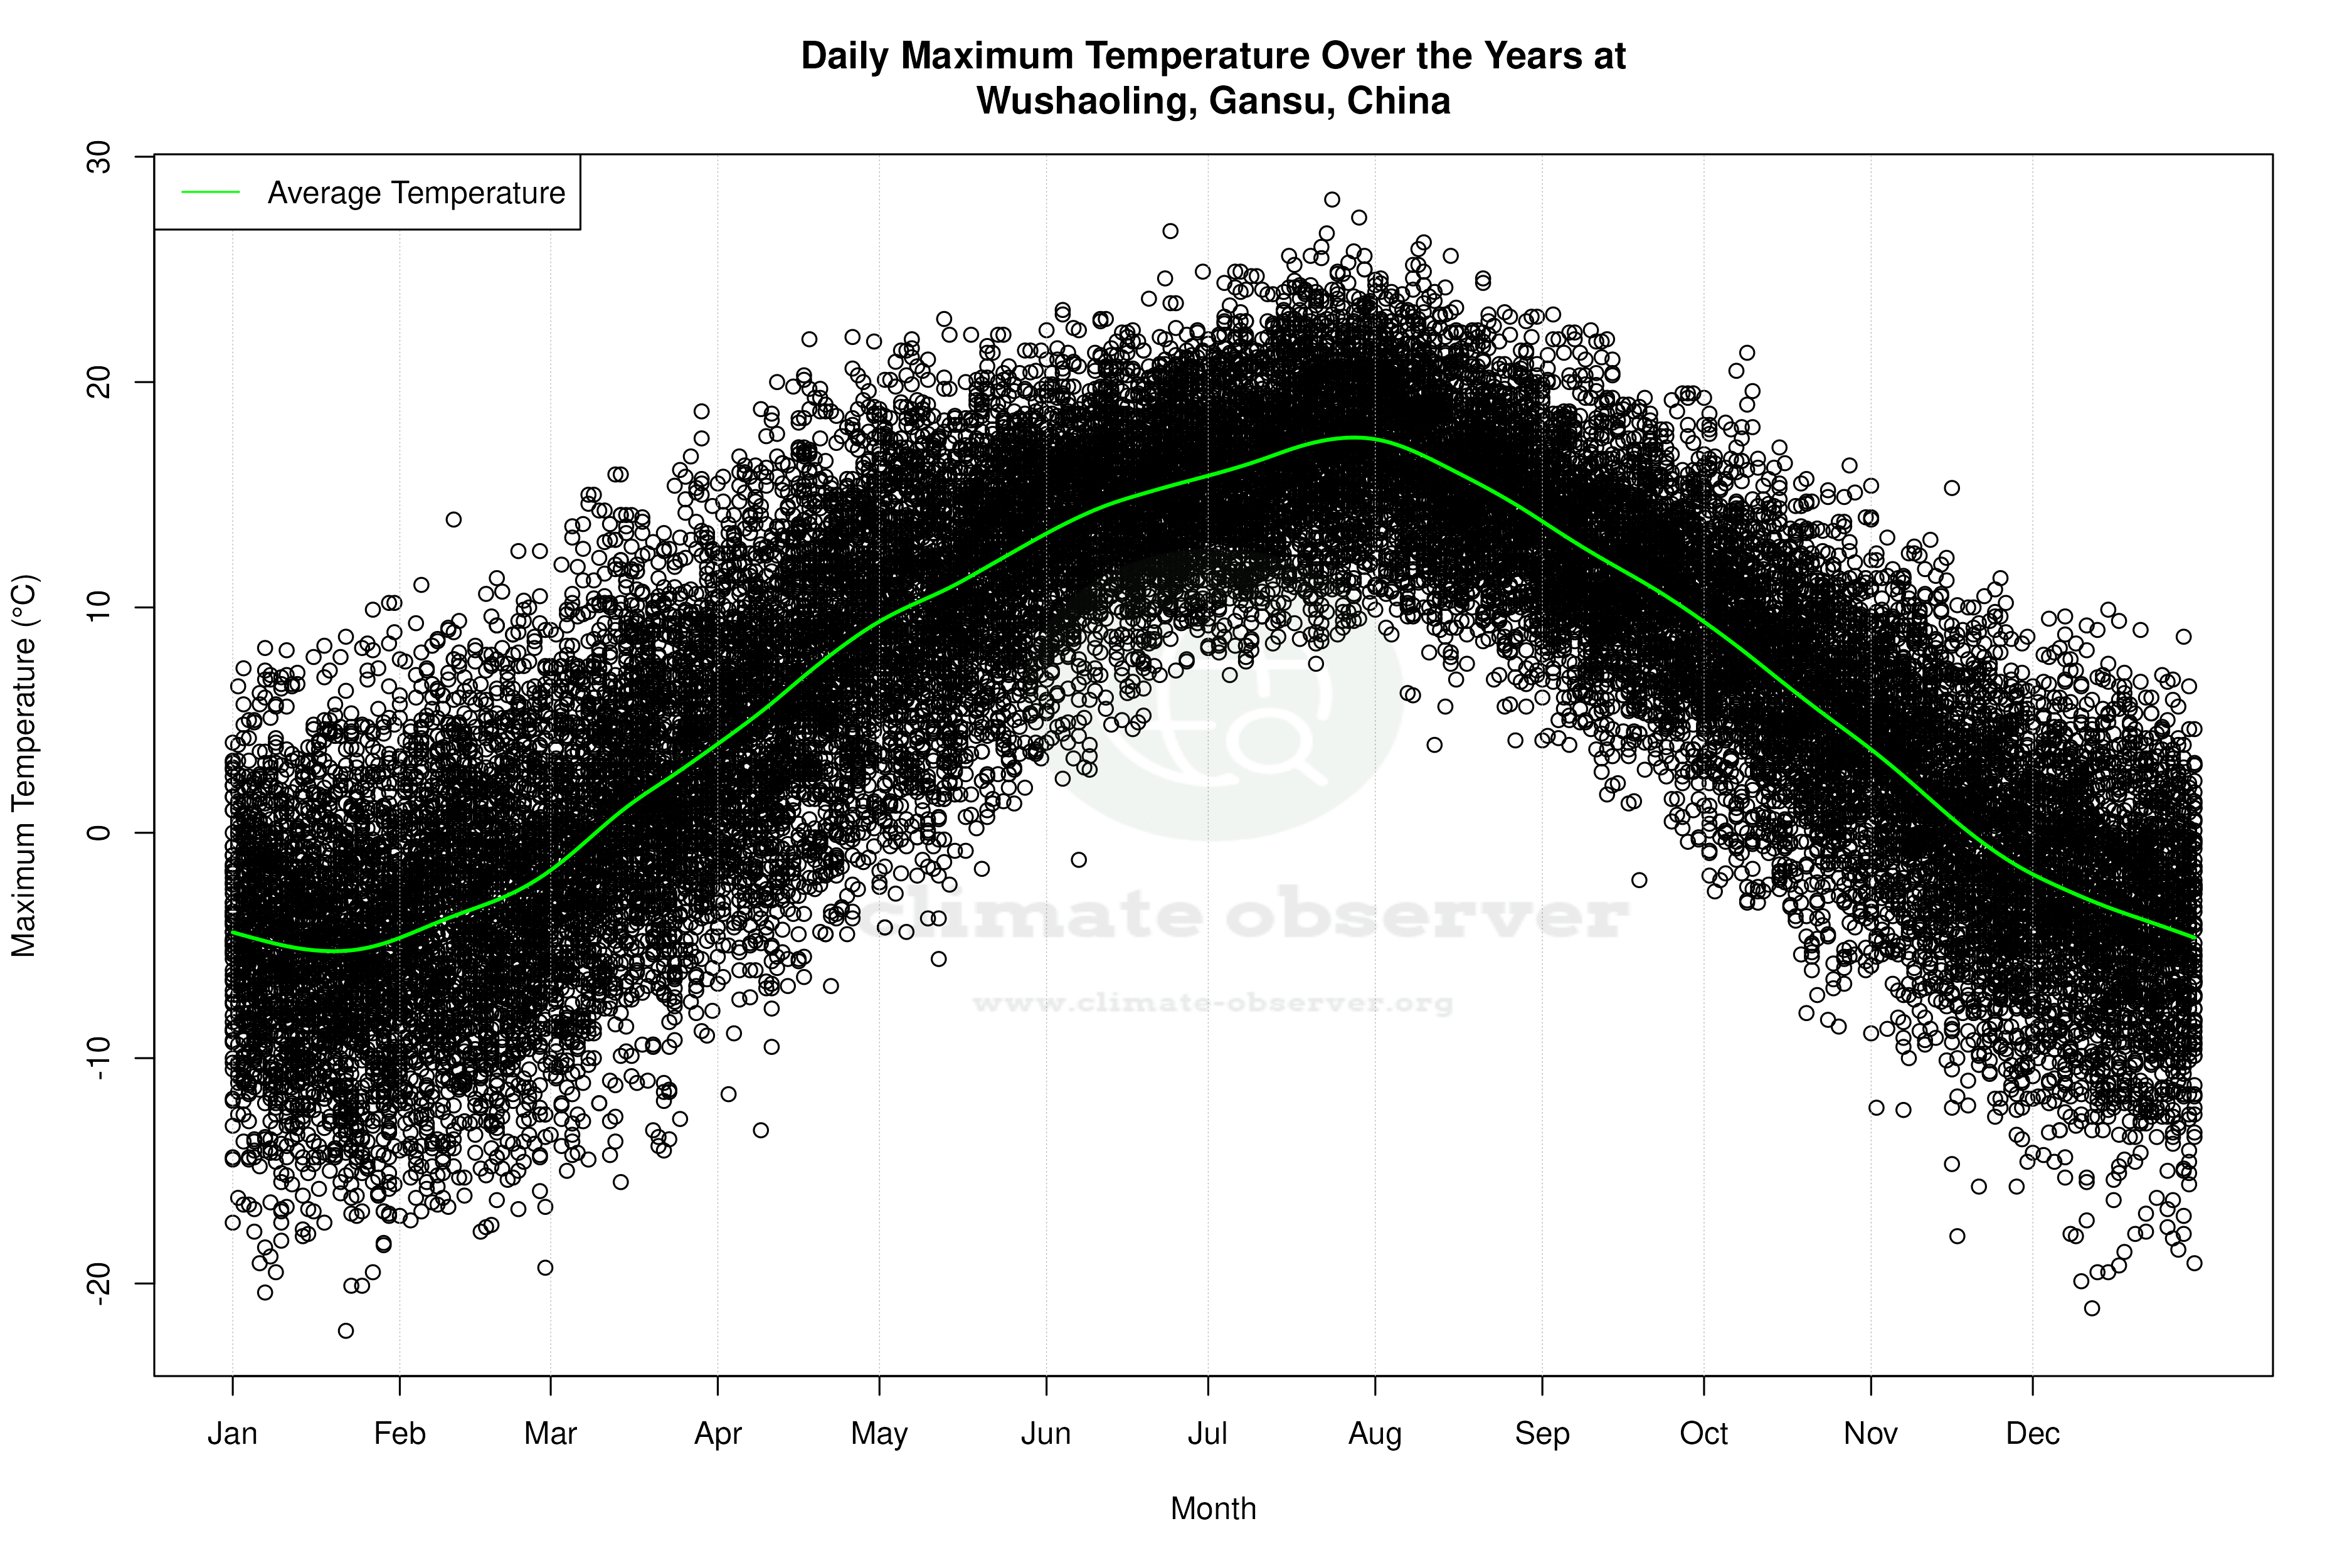
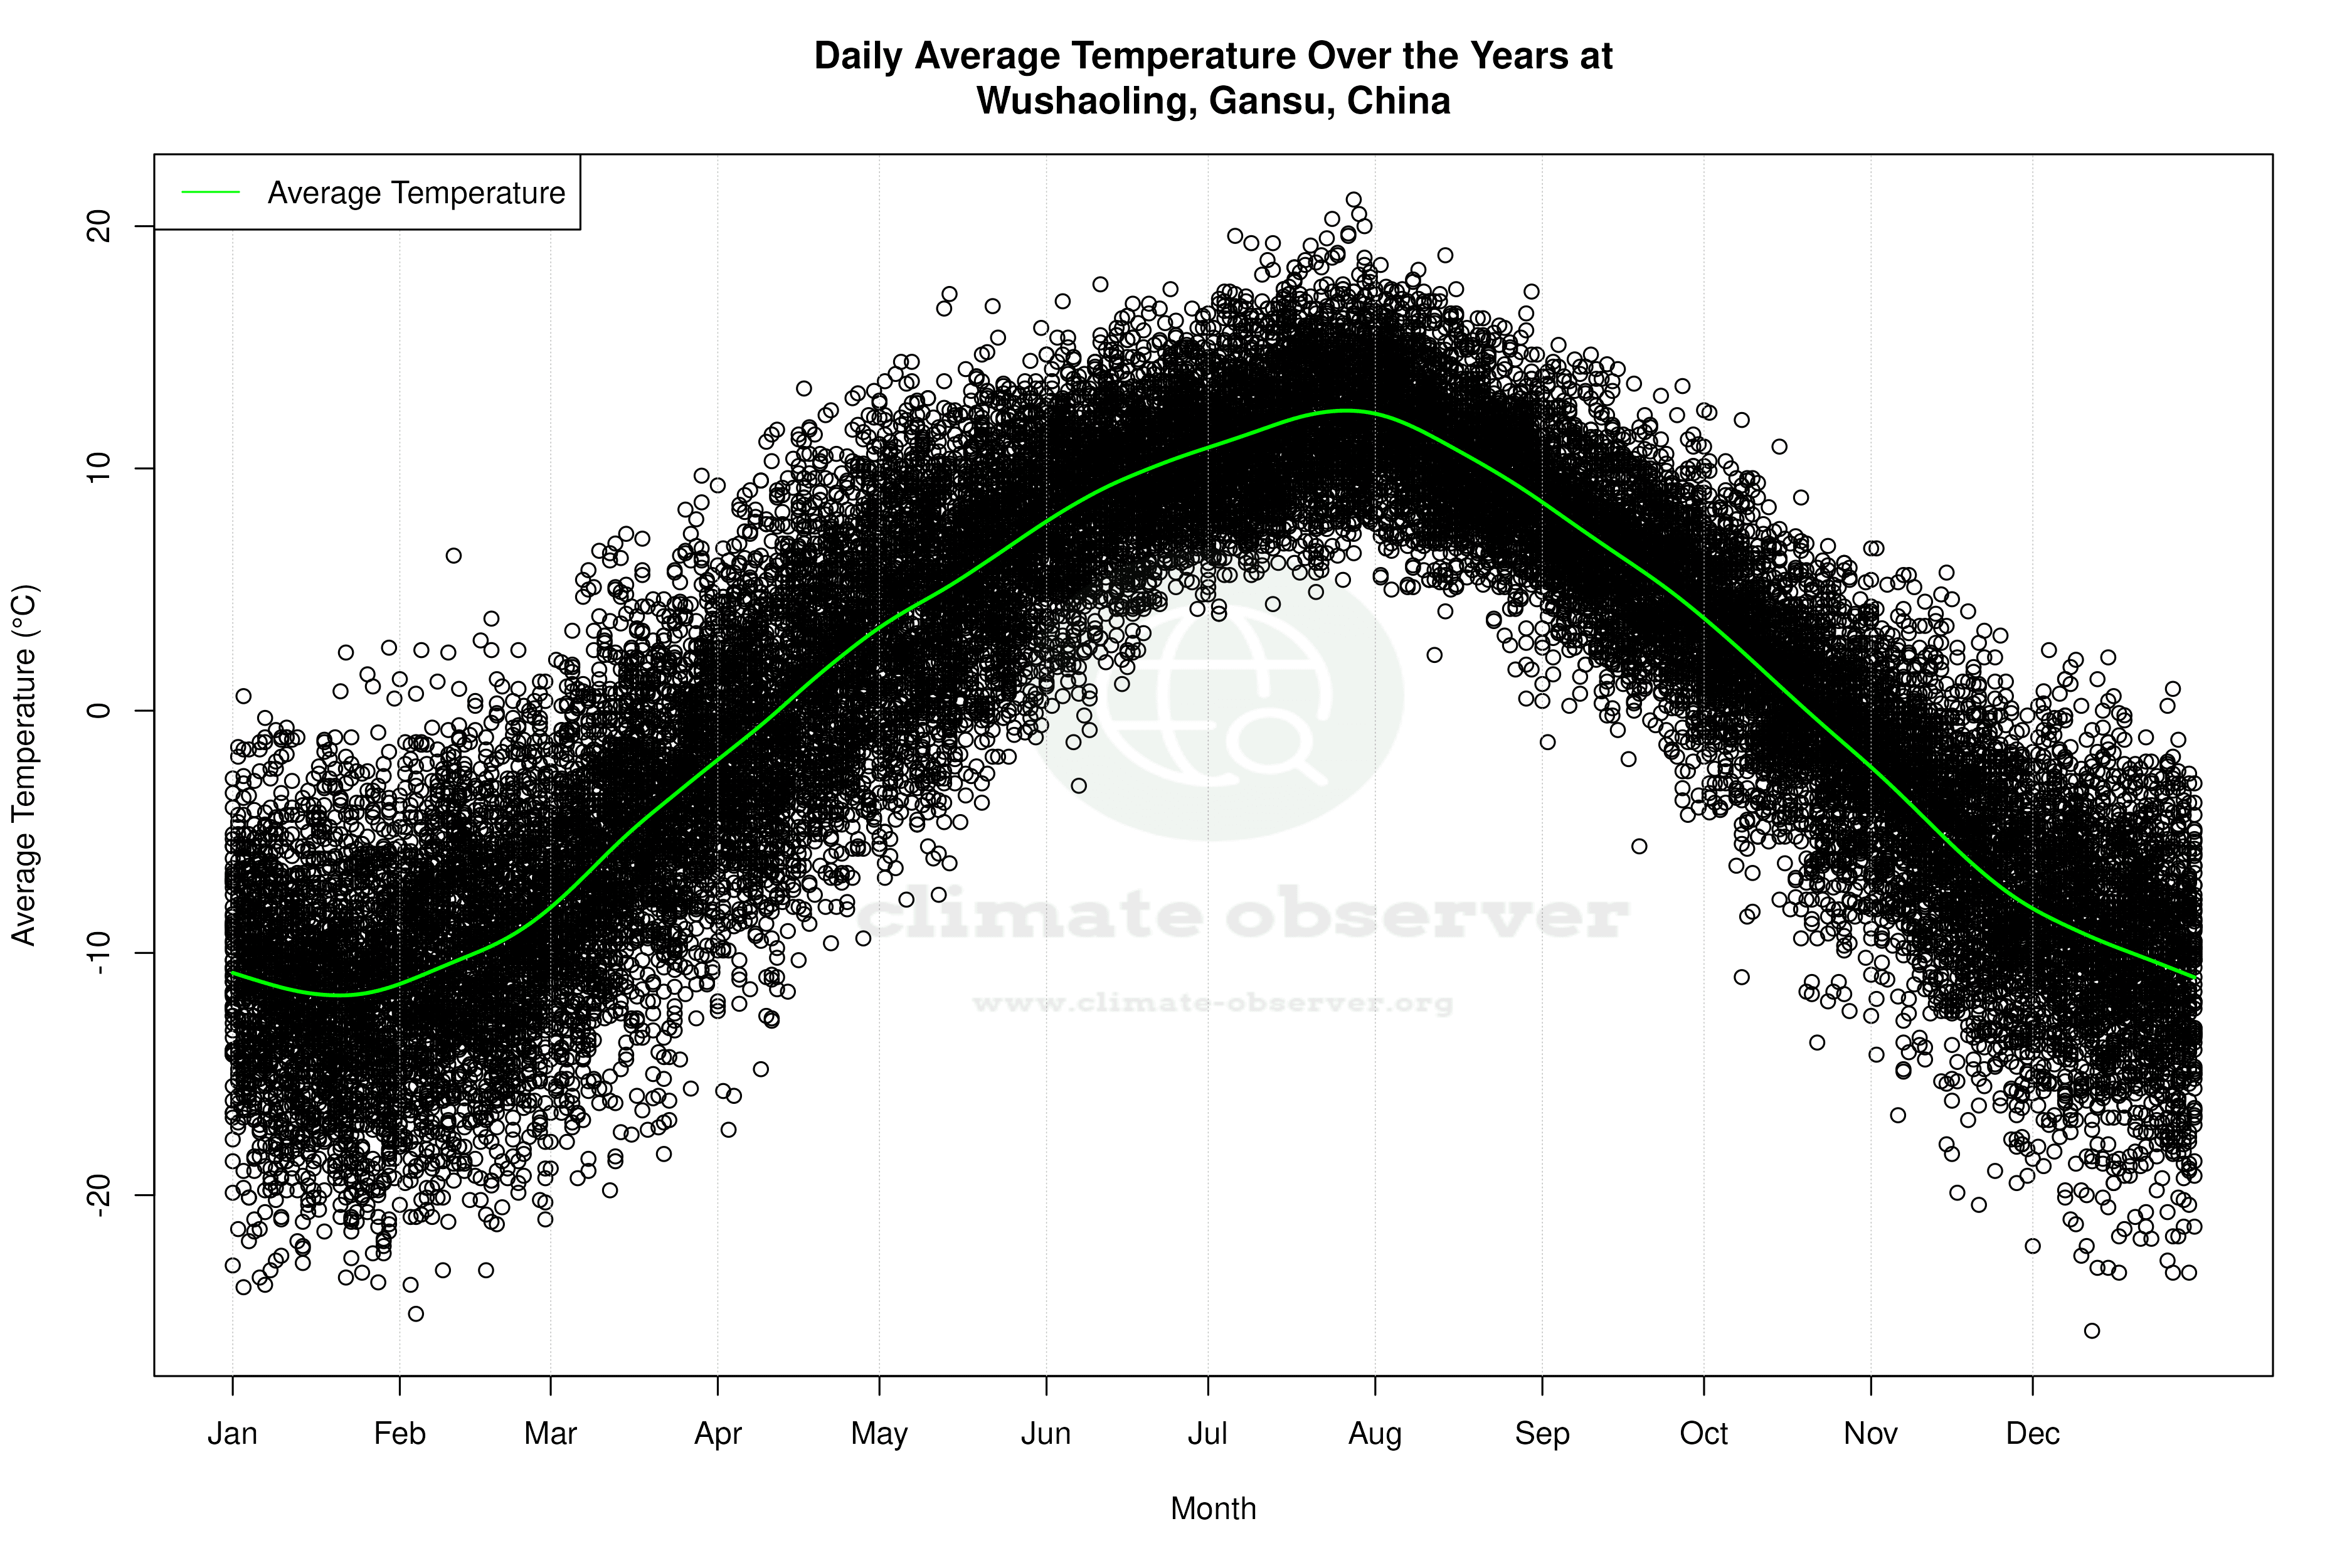


Average Max Temperature Throughout Year | 1 of 5
