Climate for Station: Hohhot, Inner Mongolia, China
Loading live weather...
Climate Analysis & Overview
Hohhot, the capital of Inner Mongolia, is experiencing a complex climate narrative with a warming trend in highs and a cooling trend in lows over the past decade. The precipitation pattern has become more concentrated, suggesting fewer but more intense rain events. These shifts are crucial as China aims for regional climate resilience.
Climate Classification and Geography
Hohhot is classified under the Köppen climate system as a cold semi-arid climate (BSk). This classification is characterised by dry conditions with cold winters and hot summers. The city's geographical position on the northern edge of the Ordos Plateau and its proximity to the Daqing Mountains significantly influence its weather patterns. These features create a barrier effect, leading to less moisture penetration from the south and contributing to the region's arid conditions.
Thermal Trends: A Mixed Bag
Over the past decade, Hohhot has witnessed a notable divergence in temperature trends. The 10-year data reveals a warming of 2.25°C (4.05°F) in high temperatures, contrasting sharply with a cooling of -0.71°C (-1.28°F) in low temperatures. This dichotomy suggests an increasing temperature range between day and night. However, when considering the all-time data, both highs and lows show a warming trend, with highs rising by 0.34°C (0.61°F) and lows by 0.38°C (0.68°F). This long-term warming aligns with broader global trends, yet the recent cooling of lows may indicate localised climatic shifts.
Precipitation Patterns: Intensifying Events
The Precipitation Concentration Index (PCI) for Hohhot has increased from a baseline of 21.2 to a current value of 23.7. This significant change indicates that precipitation is becoming more concentrated in fewer, more intense events. Such a pattern can lead to challenges in water management and agriculture, as the region may experience longer dry spells punctuated by heavy rainfall. This shift in precipitation patterns is critical for local policymakers, especially in light of China's efforts to enhance climate resilience and water resource management.
Temperature Extremes: Record Observations
Hohhot's temperature records underscore the city's climatic extremes. The highest recorded temperature is 38.9°C (102.0°F), while the lowest is -32.8°C (-27.0°F). These extremes highlight the city's vulnerability to both heatwaves and severe cold spells, which can have profound impacts on infrastructure, health, and energy demand.
Regional Climate Goals and Implications
As China continues to focus on its regional climate goals, understanding the localised impacts of climate change in areas like Hohhot is essential. The city's warming highs and concentrated precipitation events may require adaptive strategies to mitigate potential adverse effects. These insights are vital for informing policy and ensuring sustainable development in the region.
Station Statistics
10-Year Trend
High: +4.11 °F/decade
Low: -0.47 °F/decade
Rain: +0.001 in/decade
25-Year Trend
High: +1.42 °F/decade
Low: -1.61 °F/decade
Rain: +0.008 in/decade
50-Year Trend
High: +0.96 °F/decade
Low: +0.49 °F/decade
Rain: +0.002 in/decade
All-Time Trend
High: +0.55 °F/decade
Low: +0.68 °F/decade
Rain: +0.000 in/decade
Percentage Above-Average Days
Last 12 Months: 52.9%
This Year: 37.7%
Precipitation Concentration Index (PCI) ℹ️
Last 12 Months: 28.5
Historical Average: 22.8
Percentile Rank of Last 12 Months ℹ️
High: 61st percentile
Low: 28th percentile
Rain: 96th percentile
Change in Variance ℹ️
High: -3.2%
Low: +7.0%
Intraday: -17.3%
Data Coverage
99.9%
First Year of Data
1951
Station Location
Historical Weather Records
| Max High | Avg High | Min High | Max Avg | Avg Avg | Min Avg | Max Low | Avg Low | Min Low | Max Precipitation | Avg Precipitation | Max Snow | Avg Snow | |
|---|---|---|---|---|---|---|---|---|---|---|---|---|---|
| Record | 102.02 °F | — | -4.00 °F | 90.50 °F | — | -16.24 °F | 81.14 °F | — | -27.04 °F | 8.27 in | — | — | — |
| January | 51.80 °F | 23.18 °F | -4.00 °F | 34.16 °F | 10.92 °F | -16.24 °F | 27.32 °F | 0.92 °F | -24.16 °F | 0.42 in | 0.00 in | — | — |
| February | 62.60 °F | 31.58 °F | 0.14 °F | 42.62 °F | 18.81 °F | -10.66 °F | 35.42 °F | 7.98 °F | -27.04 °F | 0.49 in | 0.01 in | — | — |
| March | 74.66 °F | 45.93 °F | 7.52 °F | 61.16 °F | 33.27 °F | -0.04 °F | 50.00 °F | 22.20 °F | -17.14 °F | 0.97 in | 0.01 in | — | — |
| April | 92.12 °F | 61.53 °F | 24.44 °F | 73.94 °F | 48.20 °F | 19.76 °F | 60.26 °F | 35.08 °F | 6.08 °F | 2.17 in | 0.02 in | — | — |
| May | 95.00 °F | 73.75 °F | 41.72 °F | 82.22 °F | 60.81 °F | 37.58 °F | 69.26 °F | 46.74 °F | 25.70 °F | 2.57 in | 0.04 in | — | — |
| June | 99.14 °F | 81.37 °F | 58.10 °F | 86.72 °F | 69.26 °F | 48.92 °F | 75.20 °F | 56.16 °F | 36.14 °F | 2.66 in | 0.06 in | — | — |
| July | 102.02 °F | 83.66 °F | 64.76 °F | 90.50 °F | 72.68 °F | 59.18 °F | 81.14 °F | 61.70 °F | 46.94 °F | 8.27 in | 0.14 in | — | — |
| August | 98.24 °F | 80.04 °F | 59.90 °F | 83.30 °F | 69.13 °F | 53.24 °F | 74.48 °F | 58.71 °F | 39.38 °F | 4.52 in | 0.14 in | — | — |
| September | 90.86 °F | 70.95 °F | 46.58 °F | 76.46 °F | 58.60 °F | 38.66 °F | 66.74 °F | 47.27 °F | 24.80 °F | 2.24 in | 0.07 in | — | — |
| October | 80.60 °F | 58.00 °F | 27.32 °F | 66.74 °F | 44.92 °F | 20.66 °F | 57.92 °F | 34.18 °F | 12.02 °F | 1.09 in | 0.03 in | — | — |
| November | 68.72 °F | 40.06 °F | 8.06 °F | 50.72 °F | 28.30 °F | -2.02 °F | 44.24 °F | 19.27 °F | -11.20 °F | 0.91 in | 0.01 in | — | — |
| December | 52.88 °F | 25.52 °F | -2.74 °F | 36.32 °F | 14.04 °F | -12.46 °F | 32.72 °F | 4.94 °F | -23.80 °F | 0.30 in | 0.00 in | — | — |
Data Visualisations
Remove WatermarksCurrent Year Climate Trends vs Historical


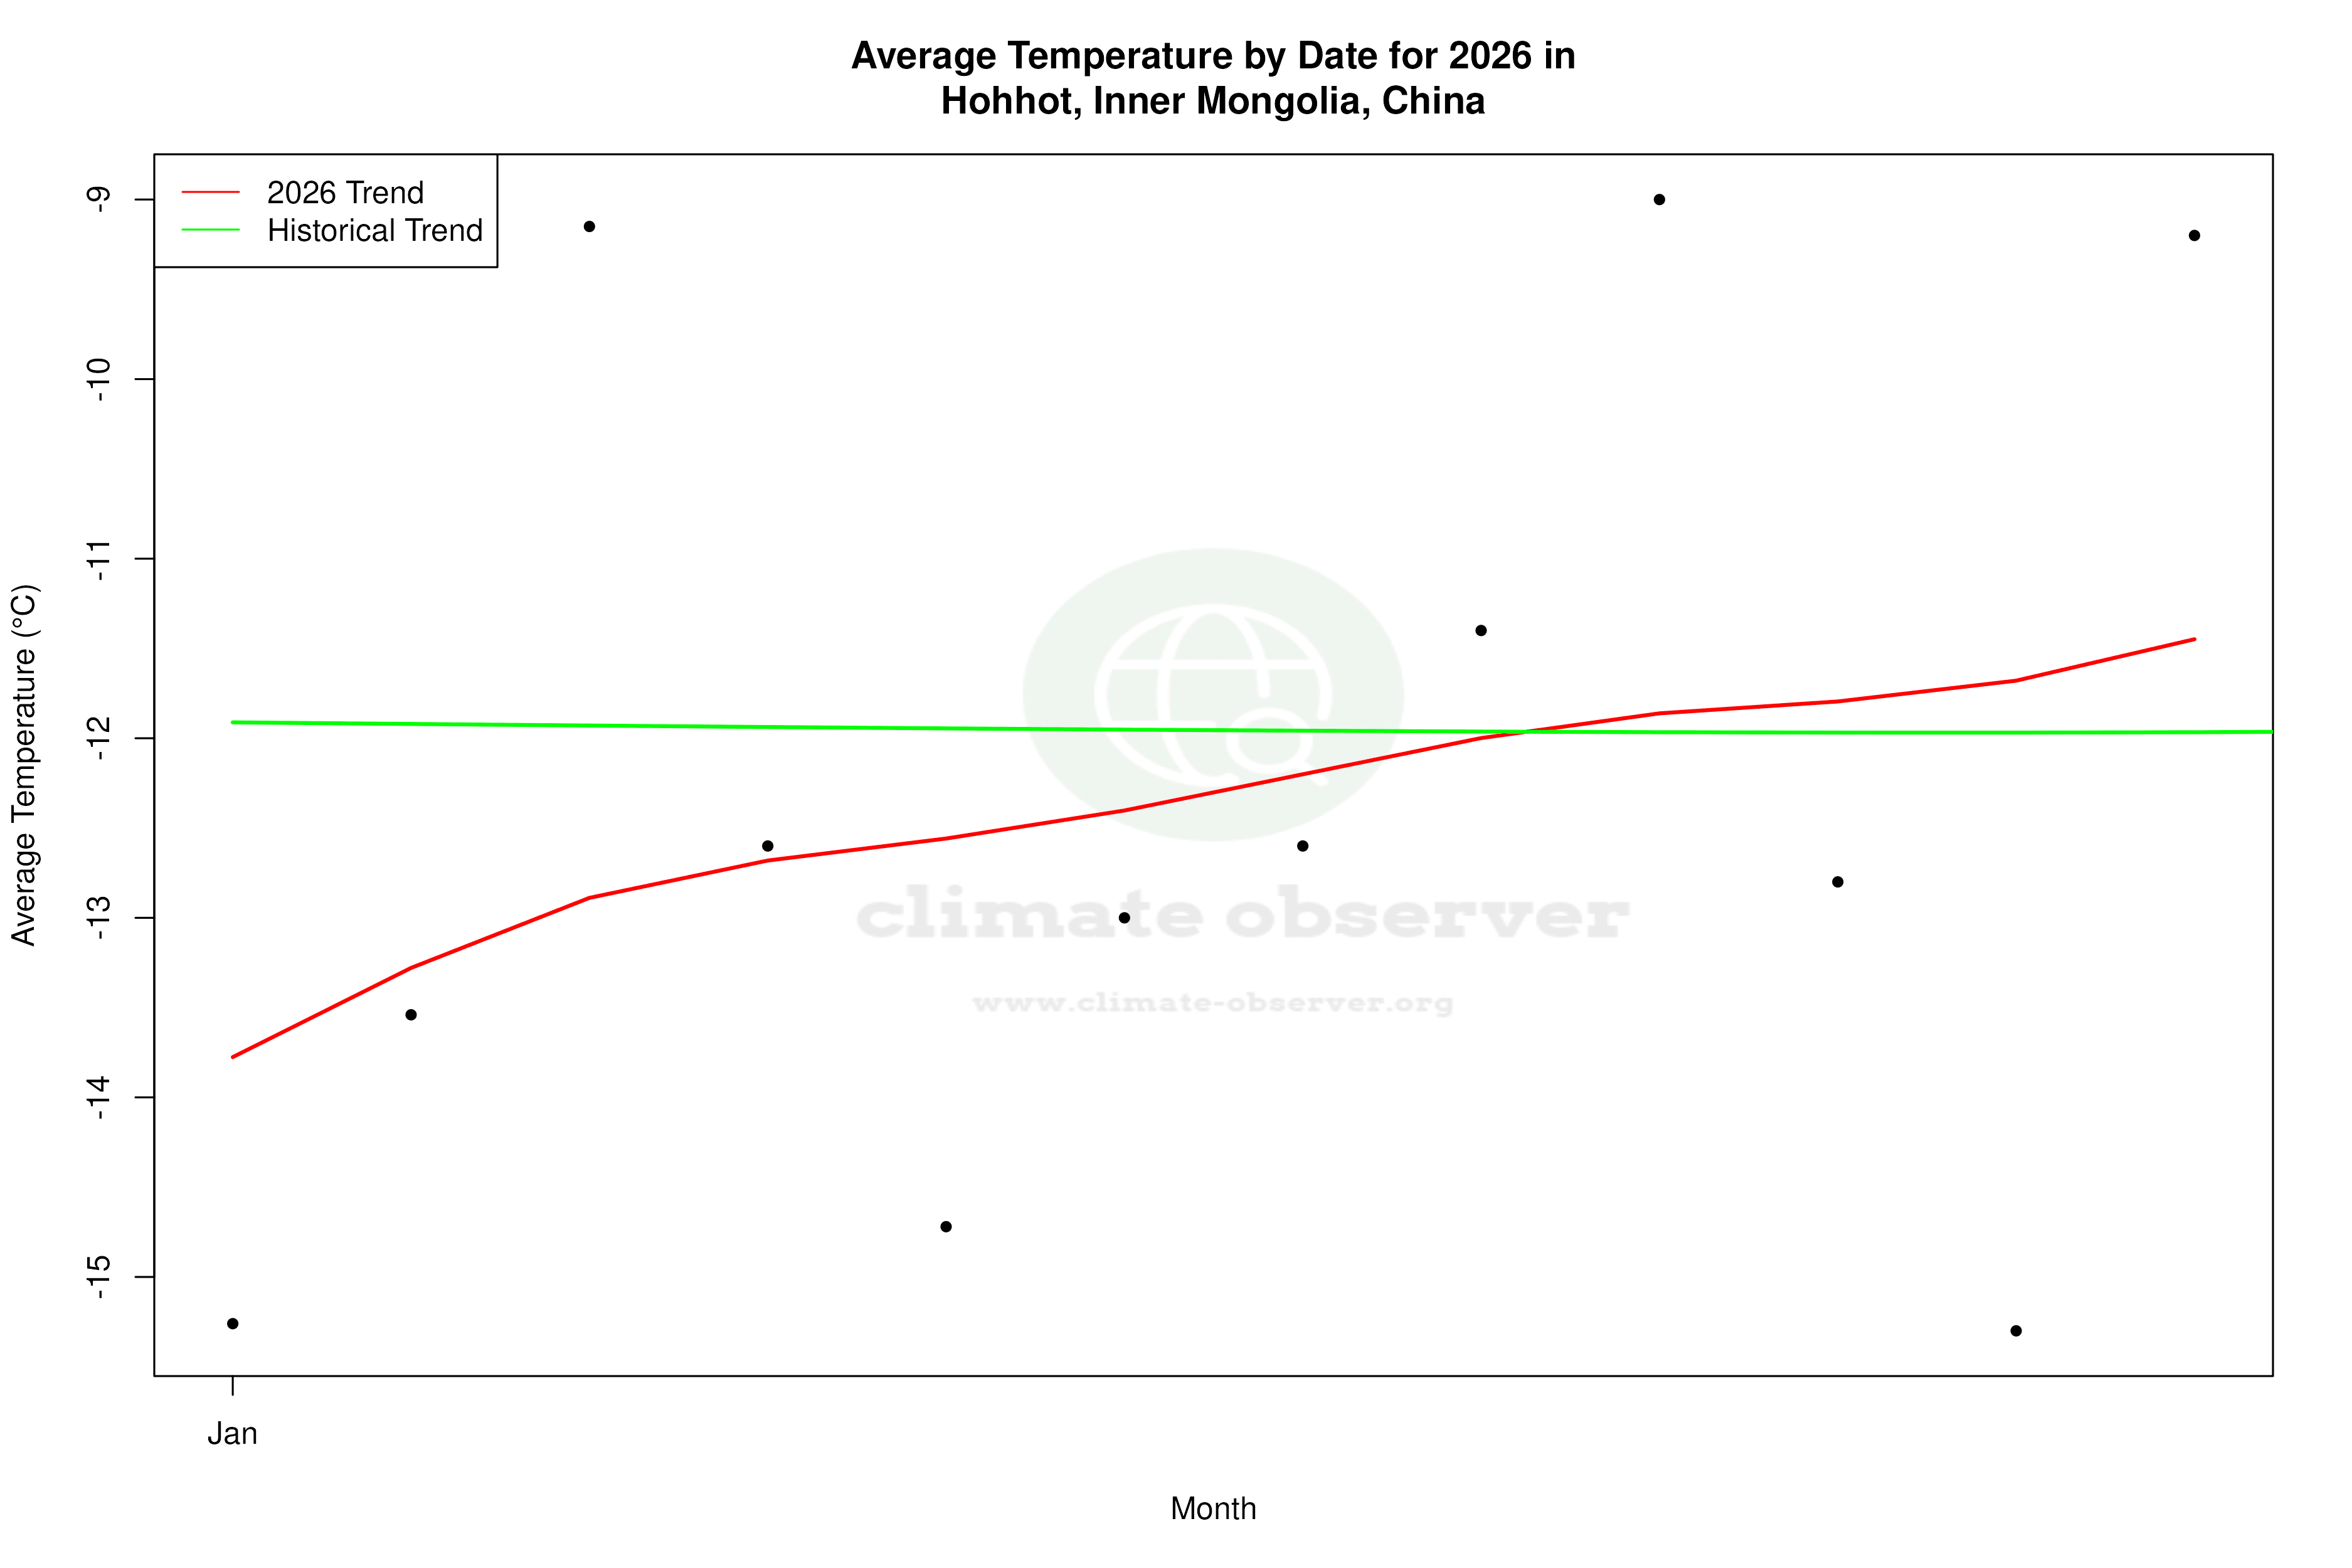


Max Temperature this Year | 1 of 6
Climate 12-Month Moving Averages
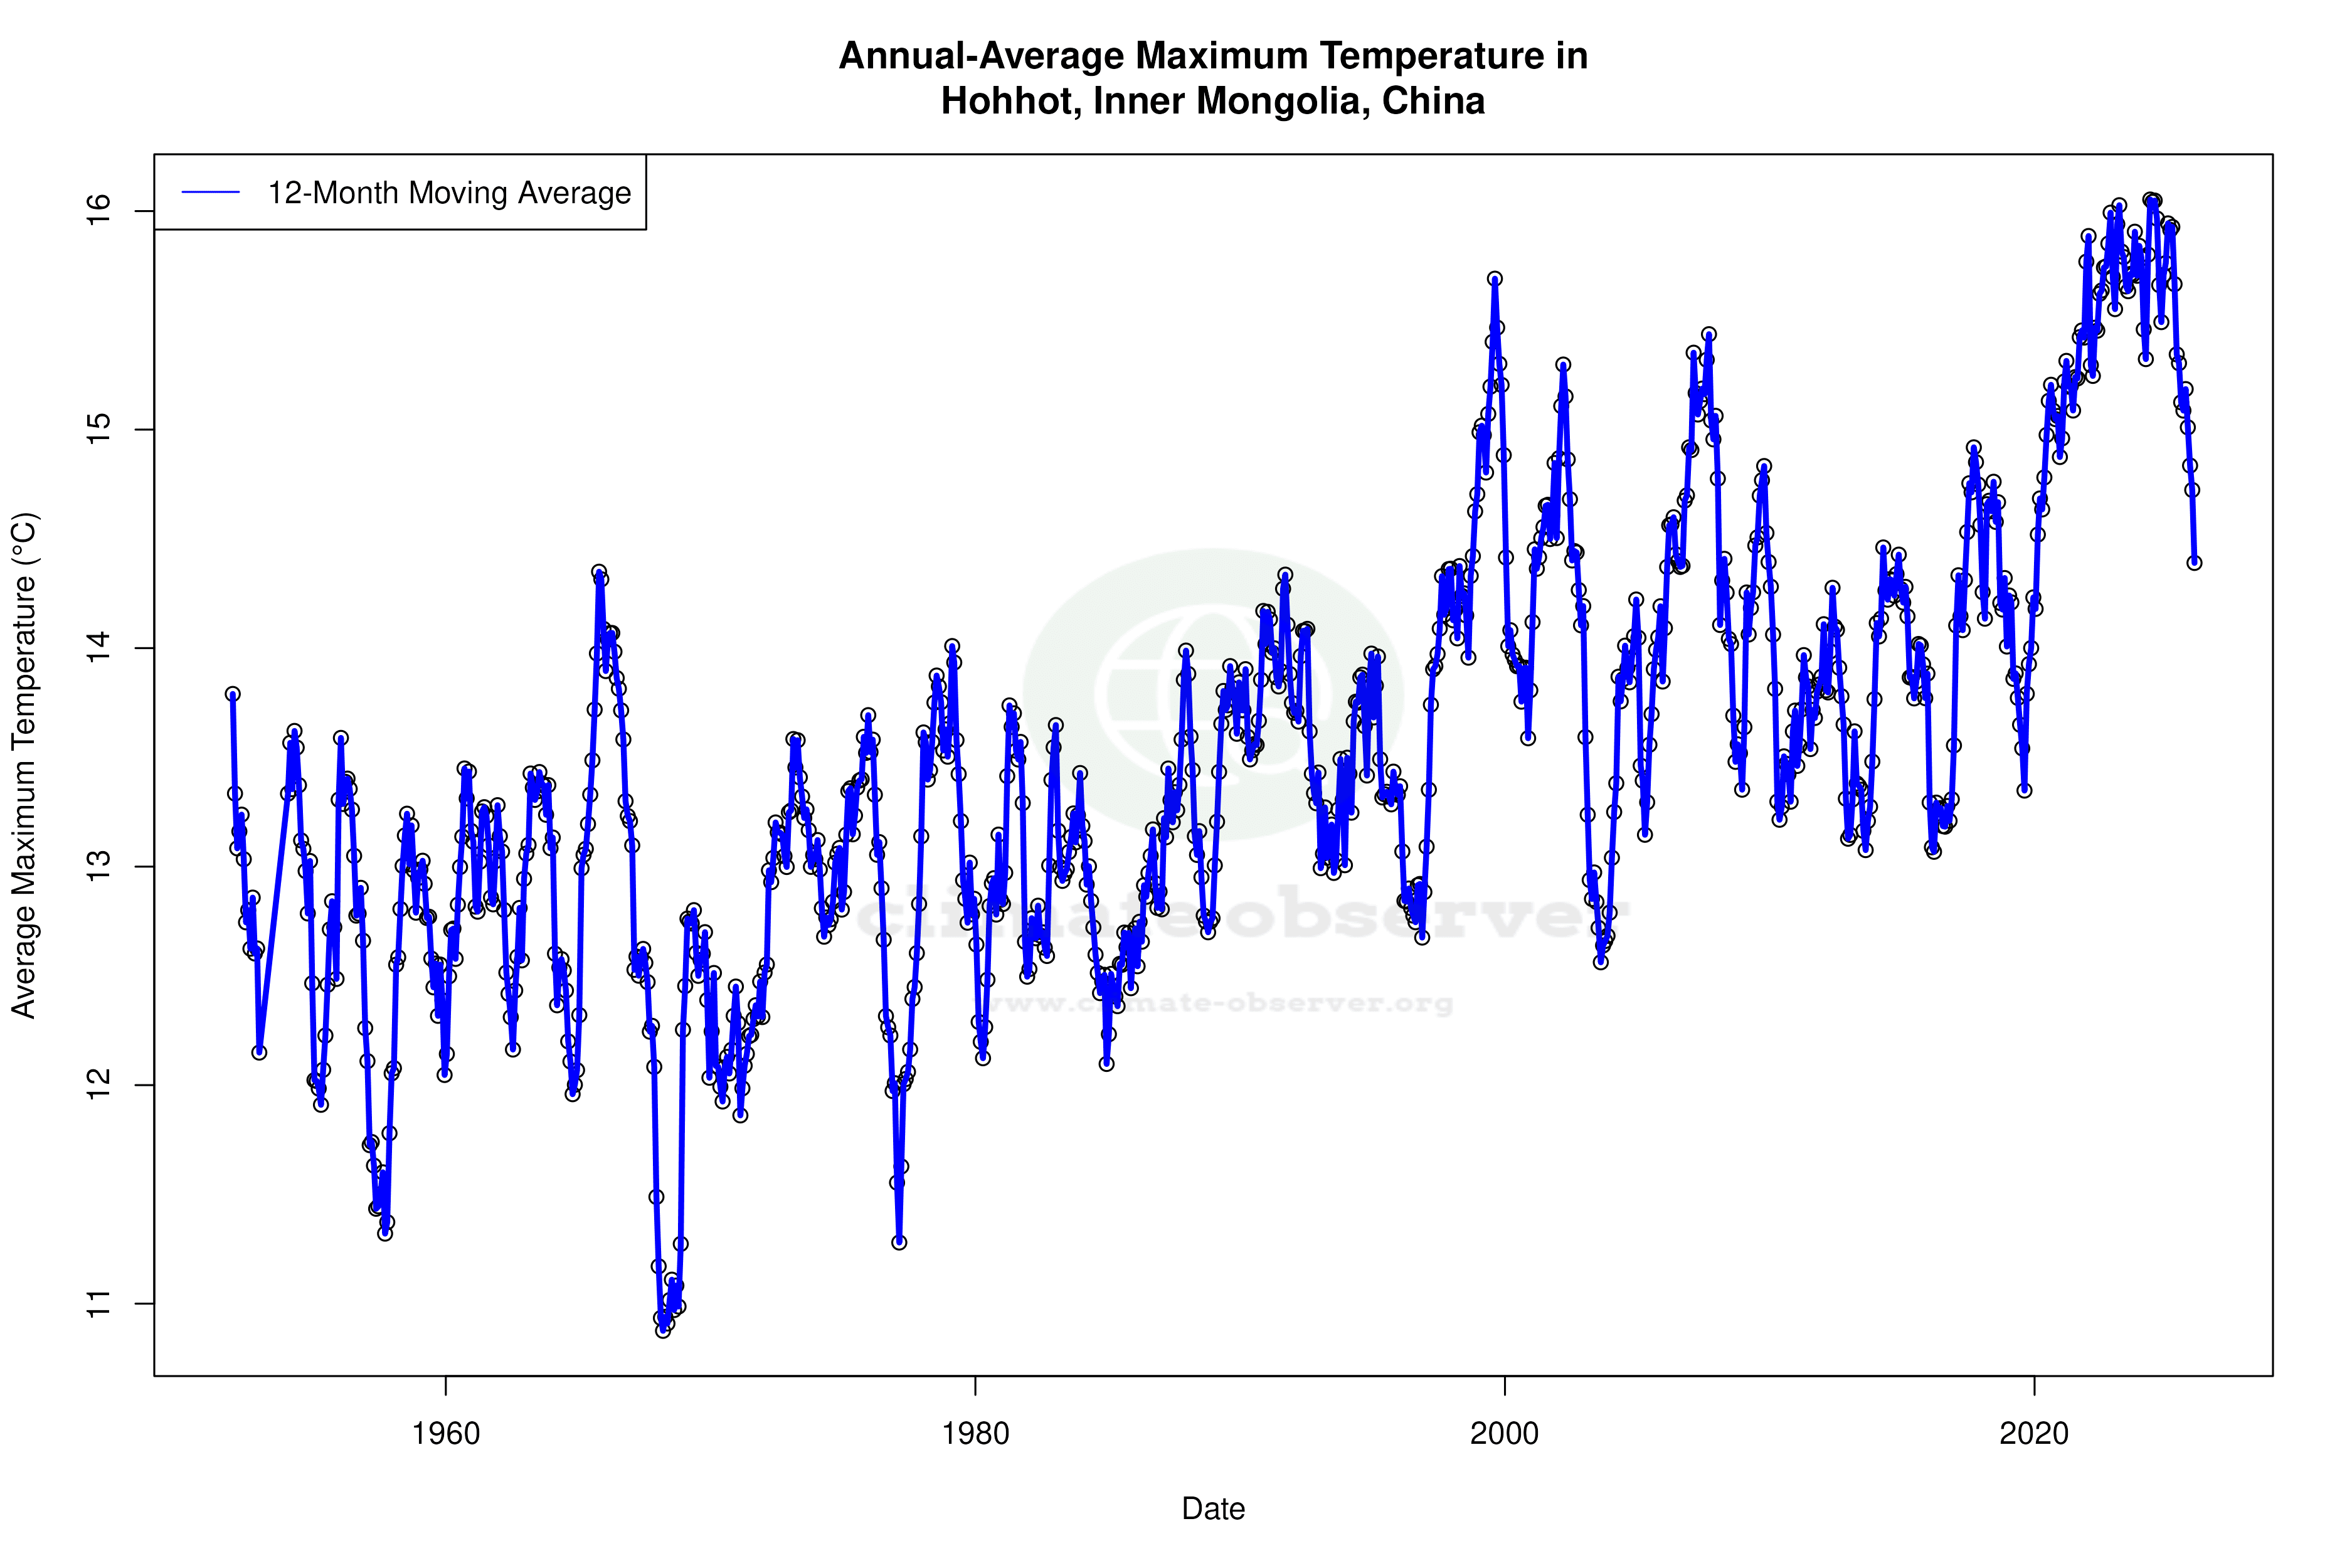


Max Temperature 12-Month MA | 1 of 6
Daily Data Points and Averages Throughout the Year


Average Max Temperature Throughout Year | 1 of 5
