Climate for Station: Simao, Yunnan, China
Loading live weather...
Climate Analysis & Overview
Simao, located in the subtropical highlands of Yunnan, China, is experiencing a warming trend, particularly in the last decade, with high temperatures increasing by 1.26°C (2.27°F) and lows by 0.62°C (1.12°F). Precipitation is becoming more evenly distributed, as indicated by a decrease in the Precipitation Concentration Index from 16.02 to 13.86.
Subtropical Highland Dynamics
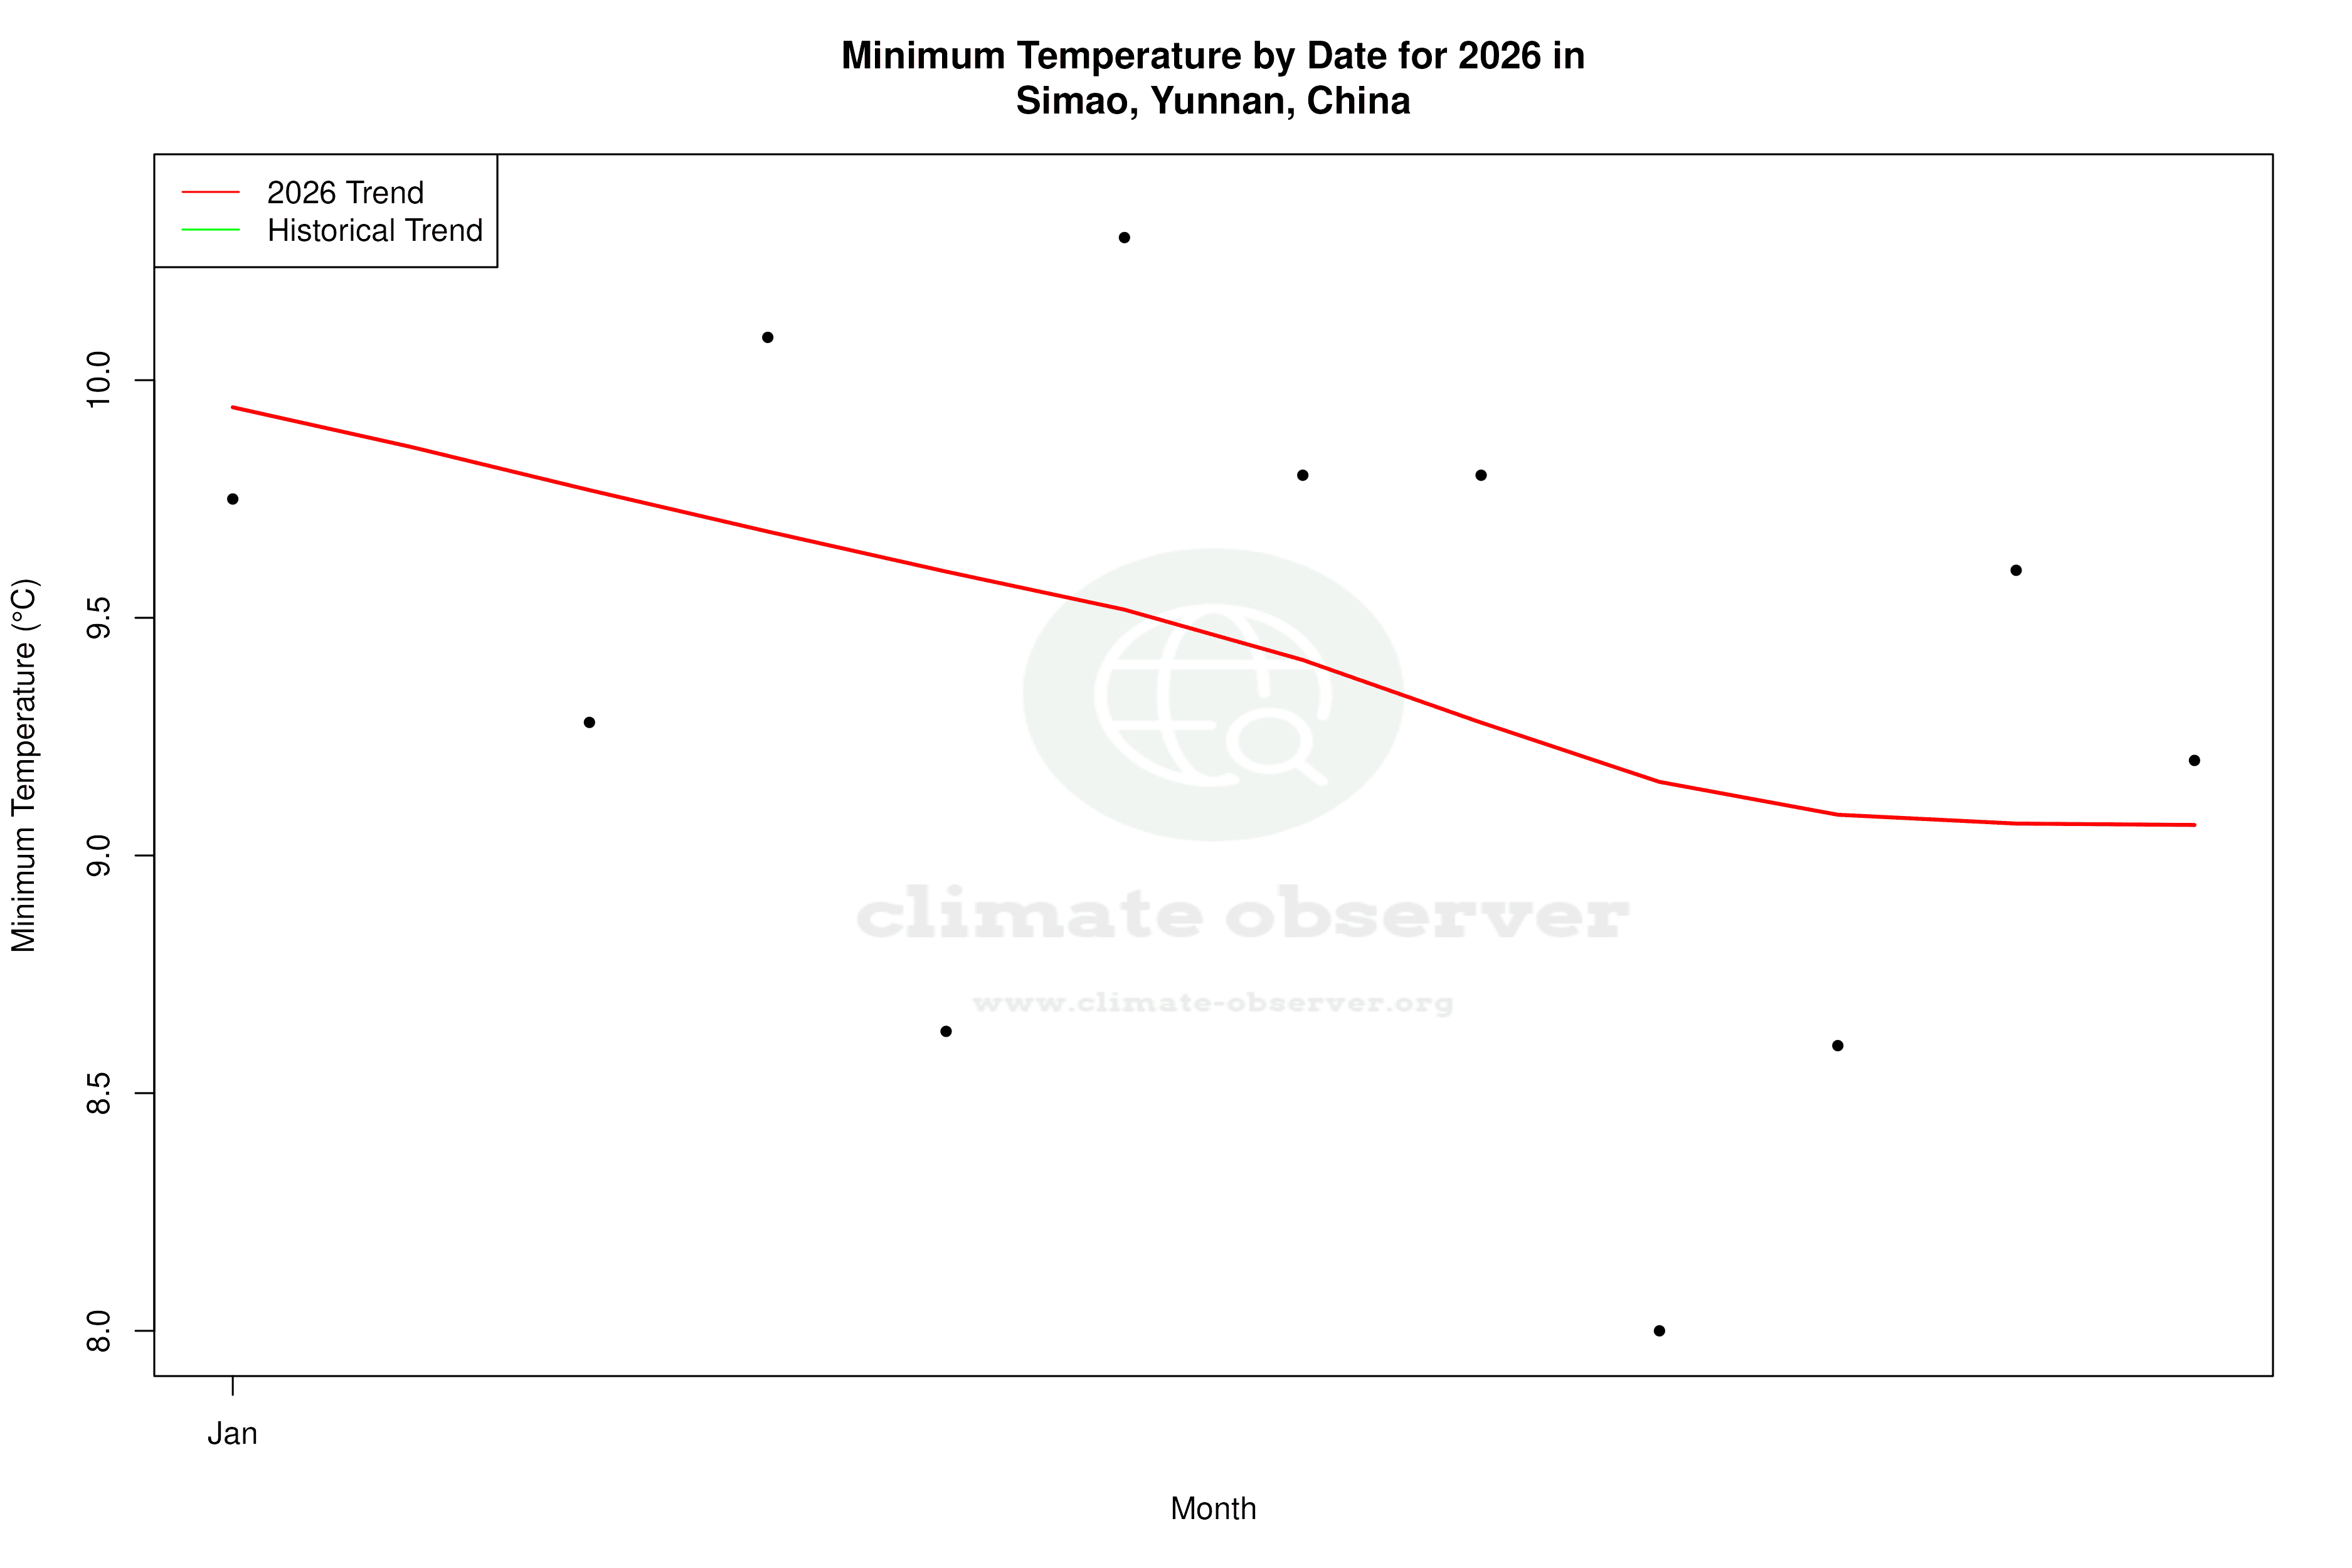
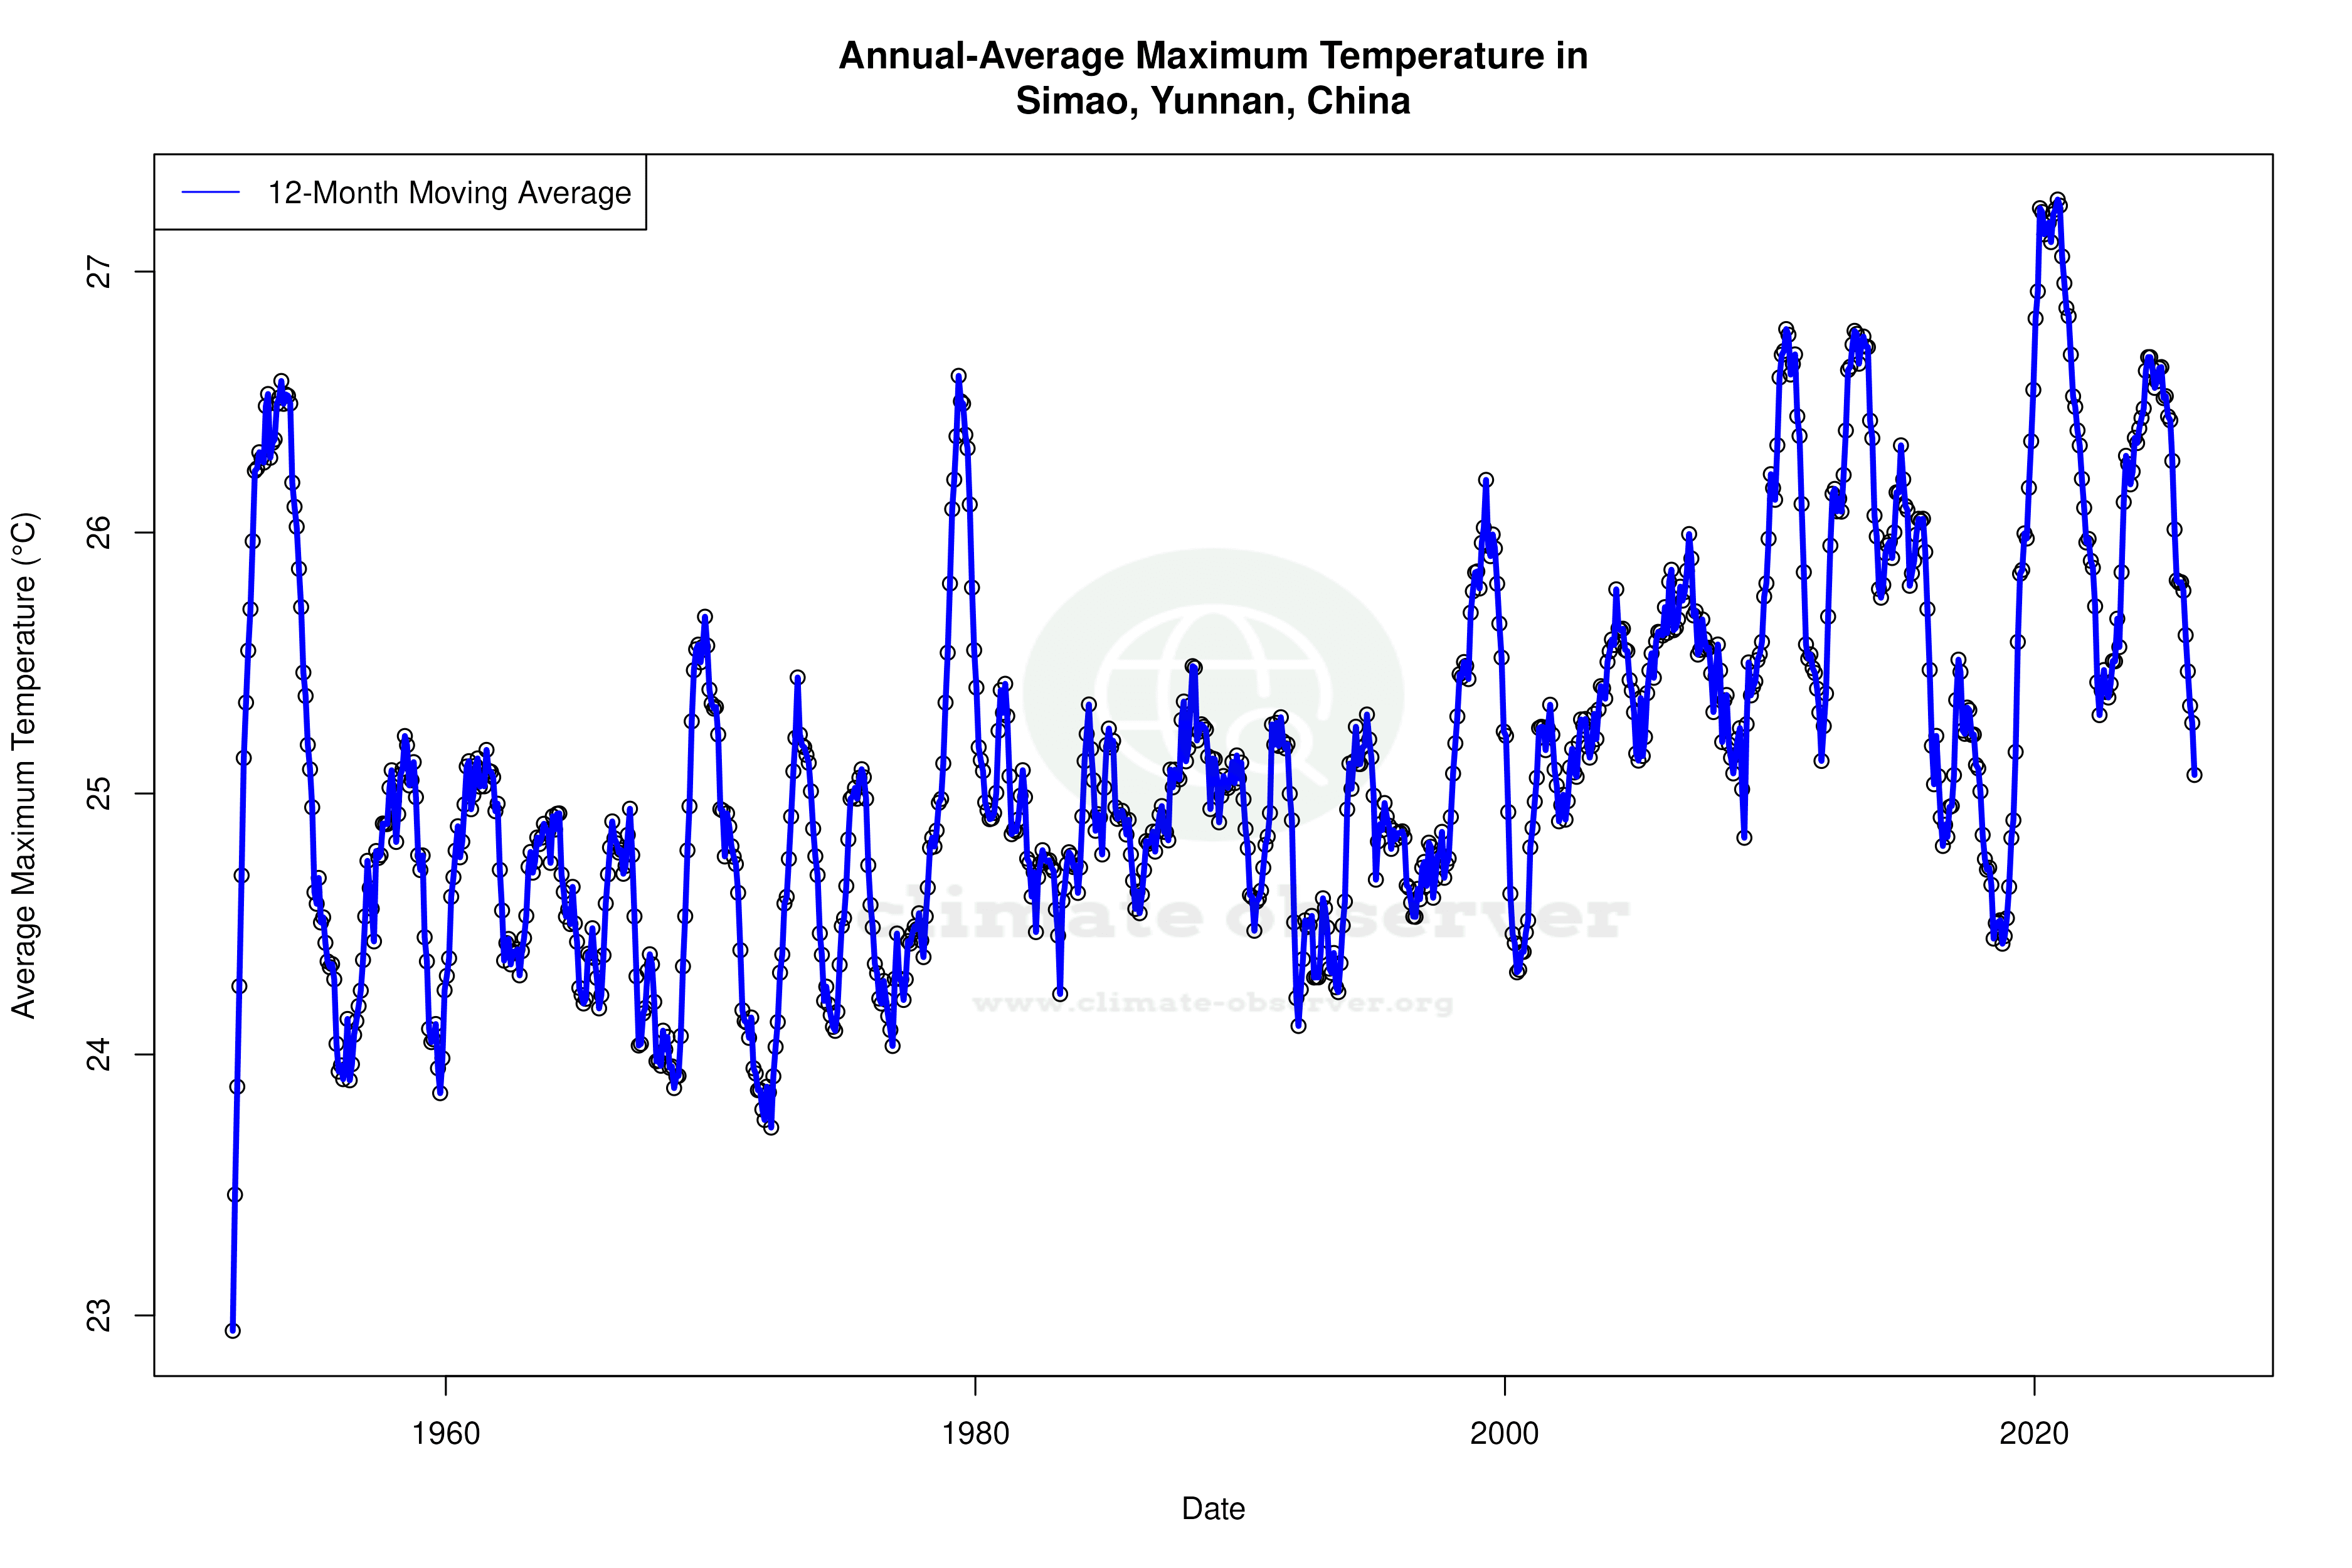
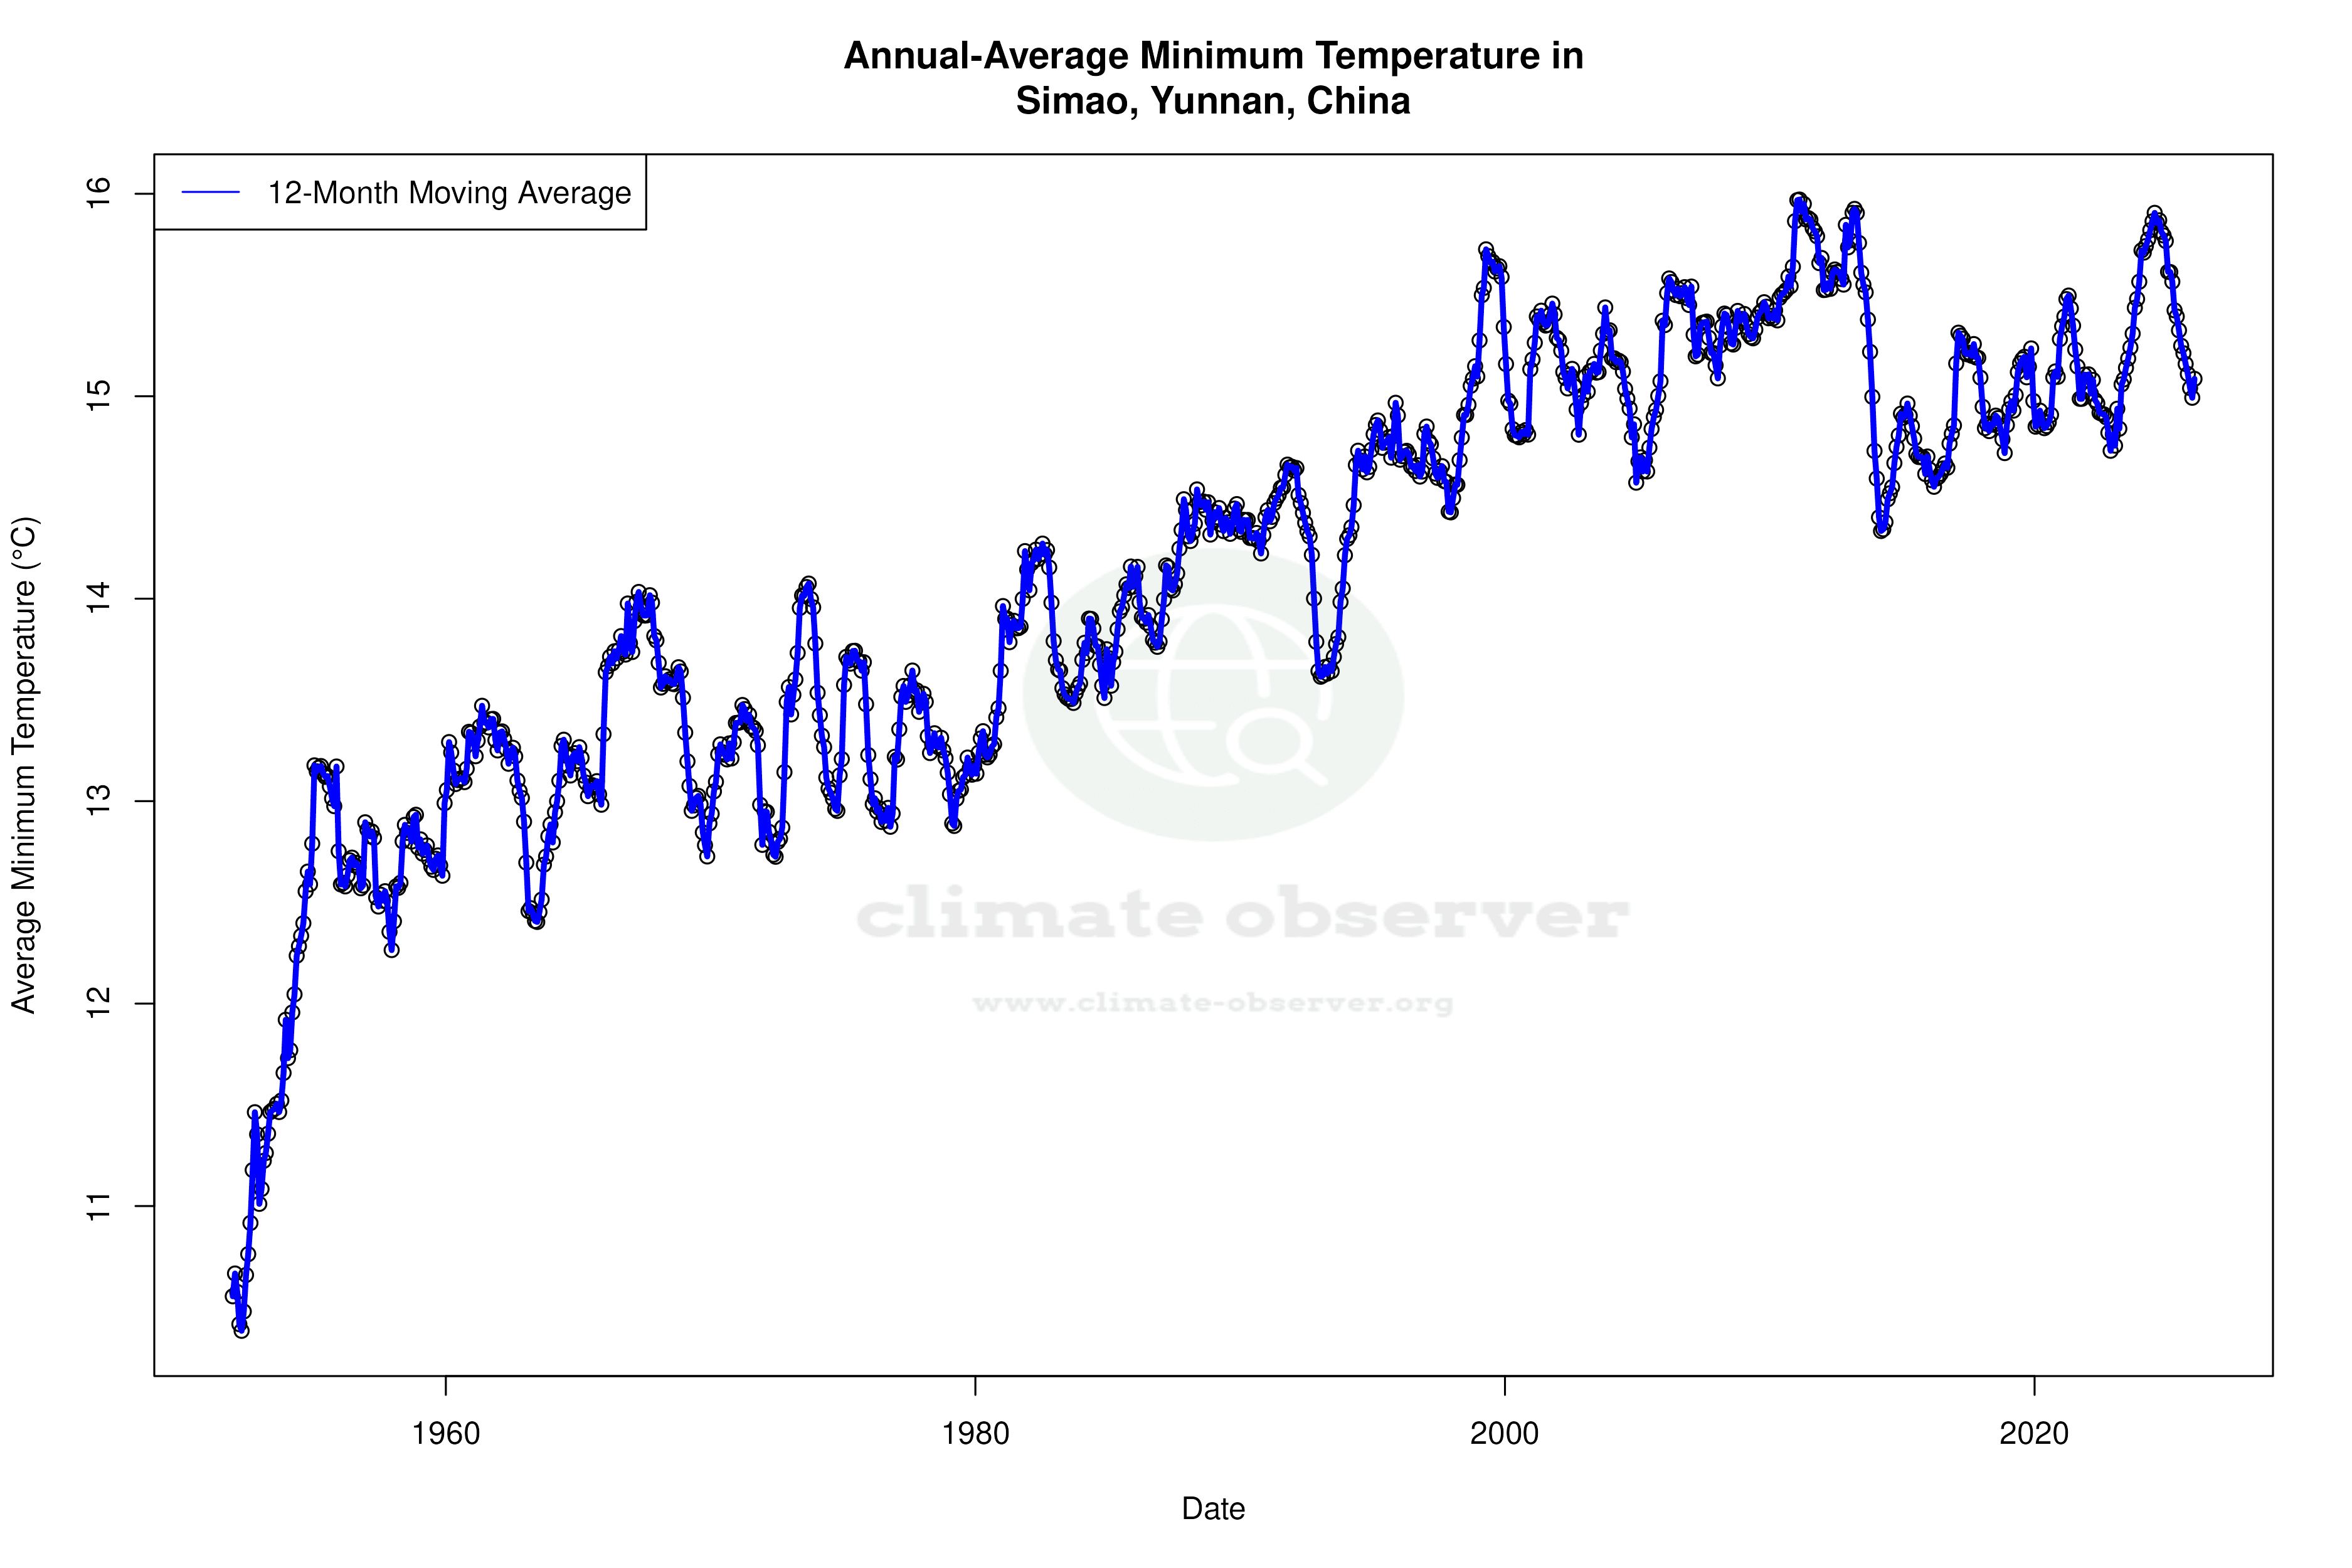
Simao, situated in the subtropical highlands of Yunnan Province, experiences a unique climate influenced by its elevation and proximity to the Mekong River. The area's Köppen classification is Cwa, characterised by dry winters and hot, wet summers. This geographical setting contributes to its distinct thermal and precipitation patterns. Over the past decade, Simao has witnessed a pronounced warming trend, with high temperatures rising by 1.26°C (2.27°F) and low temperatures by 0.62°C (1.12°F). This recent warming is more acute than the all-time trends, which show a more modest increase of 0.18°C (0.32°F) for highs and 0.45°C (0.81°F) for lows.
Thermal Extremes and Records
The thermal profile of Simao is marked by a record high of 38.59°C (101.46°F) and a record low of -3.4°C (25.88°F). These extremes highlight the variability inherent in the region's climate, influenced by both its elevation and latitude. The all-time trends suggest a gradual warming, with highs increasing by 0.18°C (0.32°F) and lows by 0.45°C (0.81°F). This warming aligns with broader regional trends observed across China, where efforts are underway to mitigate climate change impacts through renewable energy initiatives and emission reductions.
Precipitation Patterns and Shifts
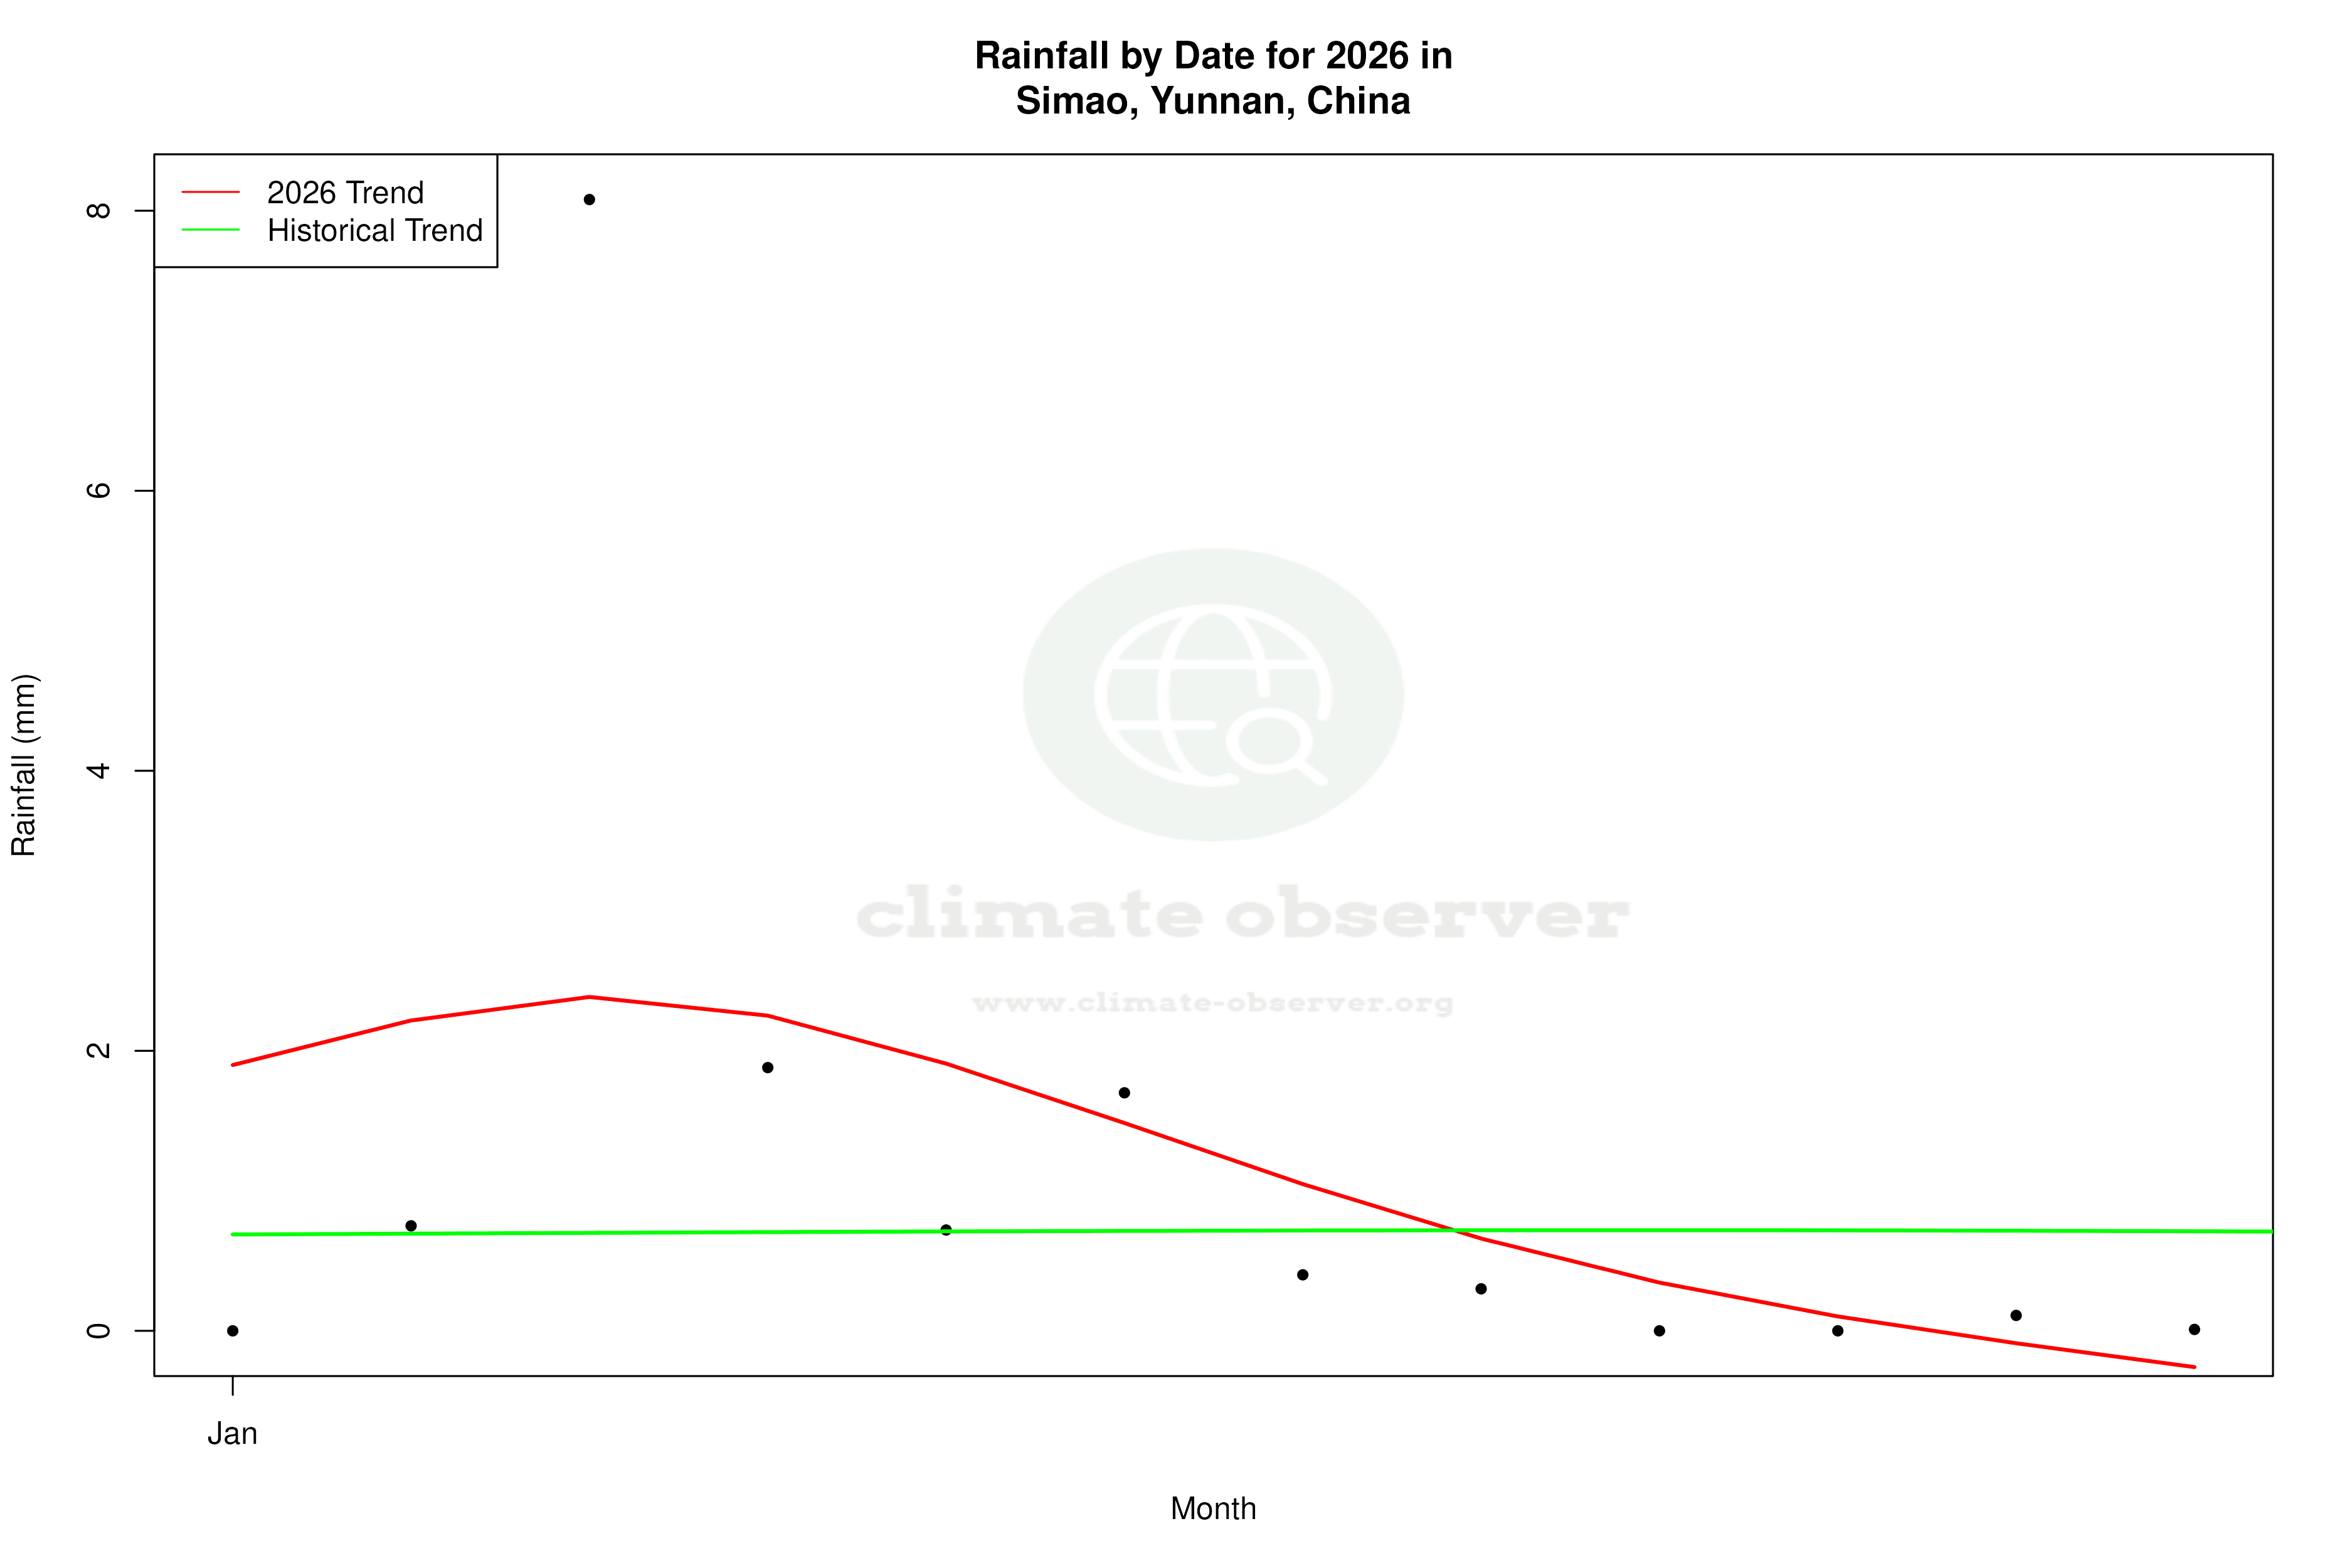
Precipitation in Simao has become more evenly distributed over time, as evidenced by a decrease in the Precipitation Concentration Index (PCI) from 16.02 to 13.86. The PCI measures how concentrated precipitation is within a few events; a decrease indicates a more even distribution of rainfall throughout the year. This shift could lead to more consistent water availability, benefiting agriculture and reducing the risk of extreme flooding events that can occur with highly concentrated precipitation.
Regional Climate Implications
The warming trends and changes in precipitation distribution in Simao are reflective of larger climatic shifts occurring in Yunnan and across China. These changes have implications for local agriculture, water resources, and biodiversity. The Chinese government has set ambitious climate goals, including carbon neutrality by 2060, which may influence local adaptation strategies and enhance resilience to ongoing climatic changes. As Simao continues to warm, understanding these trends will be crucial for developing effective responses to safeguard the region's environmental and economic health.
Station Statistics
10-Year Trend
High: +1.55 °F/decade
Low: +0.94 °F/decade
Rain: -0.028 in/decade
25-Year Trend
High: +0.67 °F/decade
Low: +0.11 °F/decade
Rain: -0.000 in/decade
50-Year Trend
High: +0.52 °F/decade
Low: +0.75 °F/decade
Rain: -0.001 in/decade
All-Time Trend
High: +0.32 °F/decade
Low: +0.79 °F/decade
Rain: -0.001 in/decade
Percentage Above-Average Days
Last 12 Months: 52.1%
This Year: 58.5%
Precipitation Concentration Index (PCI) ℹ️
Last 12 Months: 13.3
Historical Average: 16.5
Percentile Rank of Last 12 Months ℹ️
High: 73rd percentile
Low: 82nd percentile
Rain: 49th percentile
Change in Variance ℹ️
High: +6.3%
Low: -34.5%
Intraday: -56.1%
Data Coverage
92.3%
First Year of Data
1944
Station Location
Historical Weather Records
| Max High | Avg High | Min High | Max Avg | Avg Avg | Min Avg | Max Low | Avg Low | Min Low | Max Precipitation | Avg Precipitation | Max Snow | Avg Snow | |
|---|---|---|---|---|---|---|---|---|---|---|---|---|---|
| Record | 101.46 °F | — | 38.03 °F | 82.94 °F | — | 35.06 °F | 72.50 °F | — | 25.88 °F | 5.87 in | — | — | — |
| January | 81.68 °F | 69.12 °F | 38.03 °F | 66.74 °F | 54.84 °F | 35.06 °F | 60.62 °F | 44.73 °F | 25.88 °F | 2.31 in | 0.03 in | — | — |
| February | 85.64 °F | 73.72 °F | 50.54 °F | 69.26 °F | 58.14 °F | 36.32 °F | 62.96 °F | 46.21 °F | 28.94 °F | 1.62 in | 0.02 in | — | — |
| March | 92.30 °F | 79.70 °F | 48.42 °F | 76.28 °F | 63.78 °F | 40.60 °F | 64.40 °F | 51.15 °F | 32.36 °F | 2.97 in | 0.03 in | — | — |
| April | 93.92 °F | 83.27 °F | 58.10 °F | 79.16 °F | 68.59 °F | 51.08 °F | 70.52 °F | 57.06 °F | 38.12 °F | 1.94 in | 0.06 in | — | — |
| May | 97.74 °F | 83.08 °F | 60.80 °F | 82.94 °F | 71.30 °F | 56.12 °F | 72.50 °F | 62.99 °F | 47.48 °F | 4.39 in | 0.19 in | — | — |
| June | 93.74 °F | 81.23 °F | 62.42 °F | 80.78 °F | 72.19 °F | 60.98 °F | 72.32 °F | 66.89 °F | 56.30 °F | 4.47 in | 0.29 in | — | — |
| July | 92.41 °F | 79.99 °F | 66.20 °F | 79.70 °F | 71.61 °F | 63.14 °F | 72.14 °F | 66.98 °F | 59.00 °F | 5.87 in | 0.41 in | — | — |
| August | 101.46 °F | 80.31 °F | 65.84 °F | 80.06 °F | 71.27 °F | 62.96 °F | 72.14 °F | 66.38 °F | 57.92 °F | 5.75 in | 0.39 in | — | — |
| September | 88.95 °F | 79.58 °F | 60.01 °F | 77.00 °F | 70.03 °F | 57.20 °F | 71.42 °F | 64.50 °F | 50.72 °F | 3.34 in | 0.22 in | — | — |
| October | 86.18 °F | 76.35 °F | 57.02 °F | 76.28 °F | 66.72 °F | 53.06 °F | 69.80 °F | 60.93 °F | 40.82 °F | 3.00 in | 0.16 in | — | — |
| November | 83.48 °F | 72.27 °F | 52.52 °F | 71.60 °F | 60.97 °F | 46.94 °F | 66.02 °F | 53.71 °F | 35.60 °F | 3.36 in | 0.08 in | — | — |
| December | 80.24 °F | 68.19 °F | 47.48 °F | 66.74 °F | 55.55 °F | 41.90 °F | 64.04 °F | 47.26 °F | 26.96 °F | 2.15 in | 0.03 in | — | — |
Data Visualisations
Remove WatermarksCurrent Year Climate Trends vs Historical


Max Temperature this Year | 1 of 6
Climate 12-Month Moving Averages


Max Temperature 12-Month MA | 1 of 6
Daily Data Points and Averages Throughout the Year


Average Max Temperature Throughout Year | 1 of 5
