Climate for Station: Guangzhou, Guangdong, China
Loading live weather...
Climate Analysis & Overview
Guangzhou's climate is experiencing a notable warming trend, particularly over the past decade, with a marked increase in high temperatures. Precipitation patterns are becoming slightly more concentrated, suggesting shifts in rainfall distribution. These changes are set against the backdrop of China's ongoing climate adaptation efforts.
Subtropical Warmth and Cooling Lows
Guangzhou, located at 23.217°N, 113.483°E, experiences a humid subtropical climate, classified as Cfa in the Köppen system. This climate is characterised by hot, humid summers and mild, dry winters. The city's proximity to the South China Sea influences its weather patterns, contributing to high humidity and significant rainfall, especially during the monsoon season.
Over the past decade, Guangzhou has seen a pronounced warming trend in high temperatures, with an increase of 2.37°C (4.27°F). This is a stark contrast to the all-time warming trend of 0.27°C (0.49°F), indicating a recent acceleration in temperature rise. Meanwhile, the low temperatures have decreased slightly by 0.38°C (0.68°F) over the same decade, which is an intriguing divergence from the all-time trend that shows a modest increase of 0.08°C (0.14°F). This suggests a complex interplay of factors affecting nighttime cooling.
Precipitation Patterns and Concentration
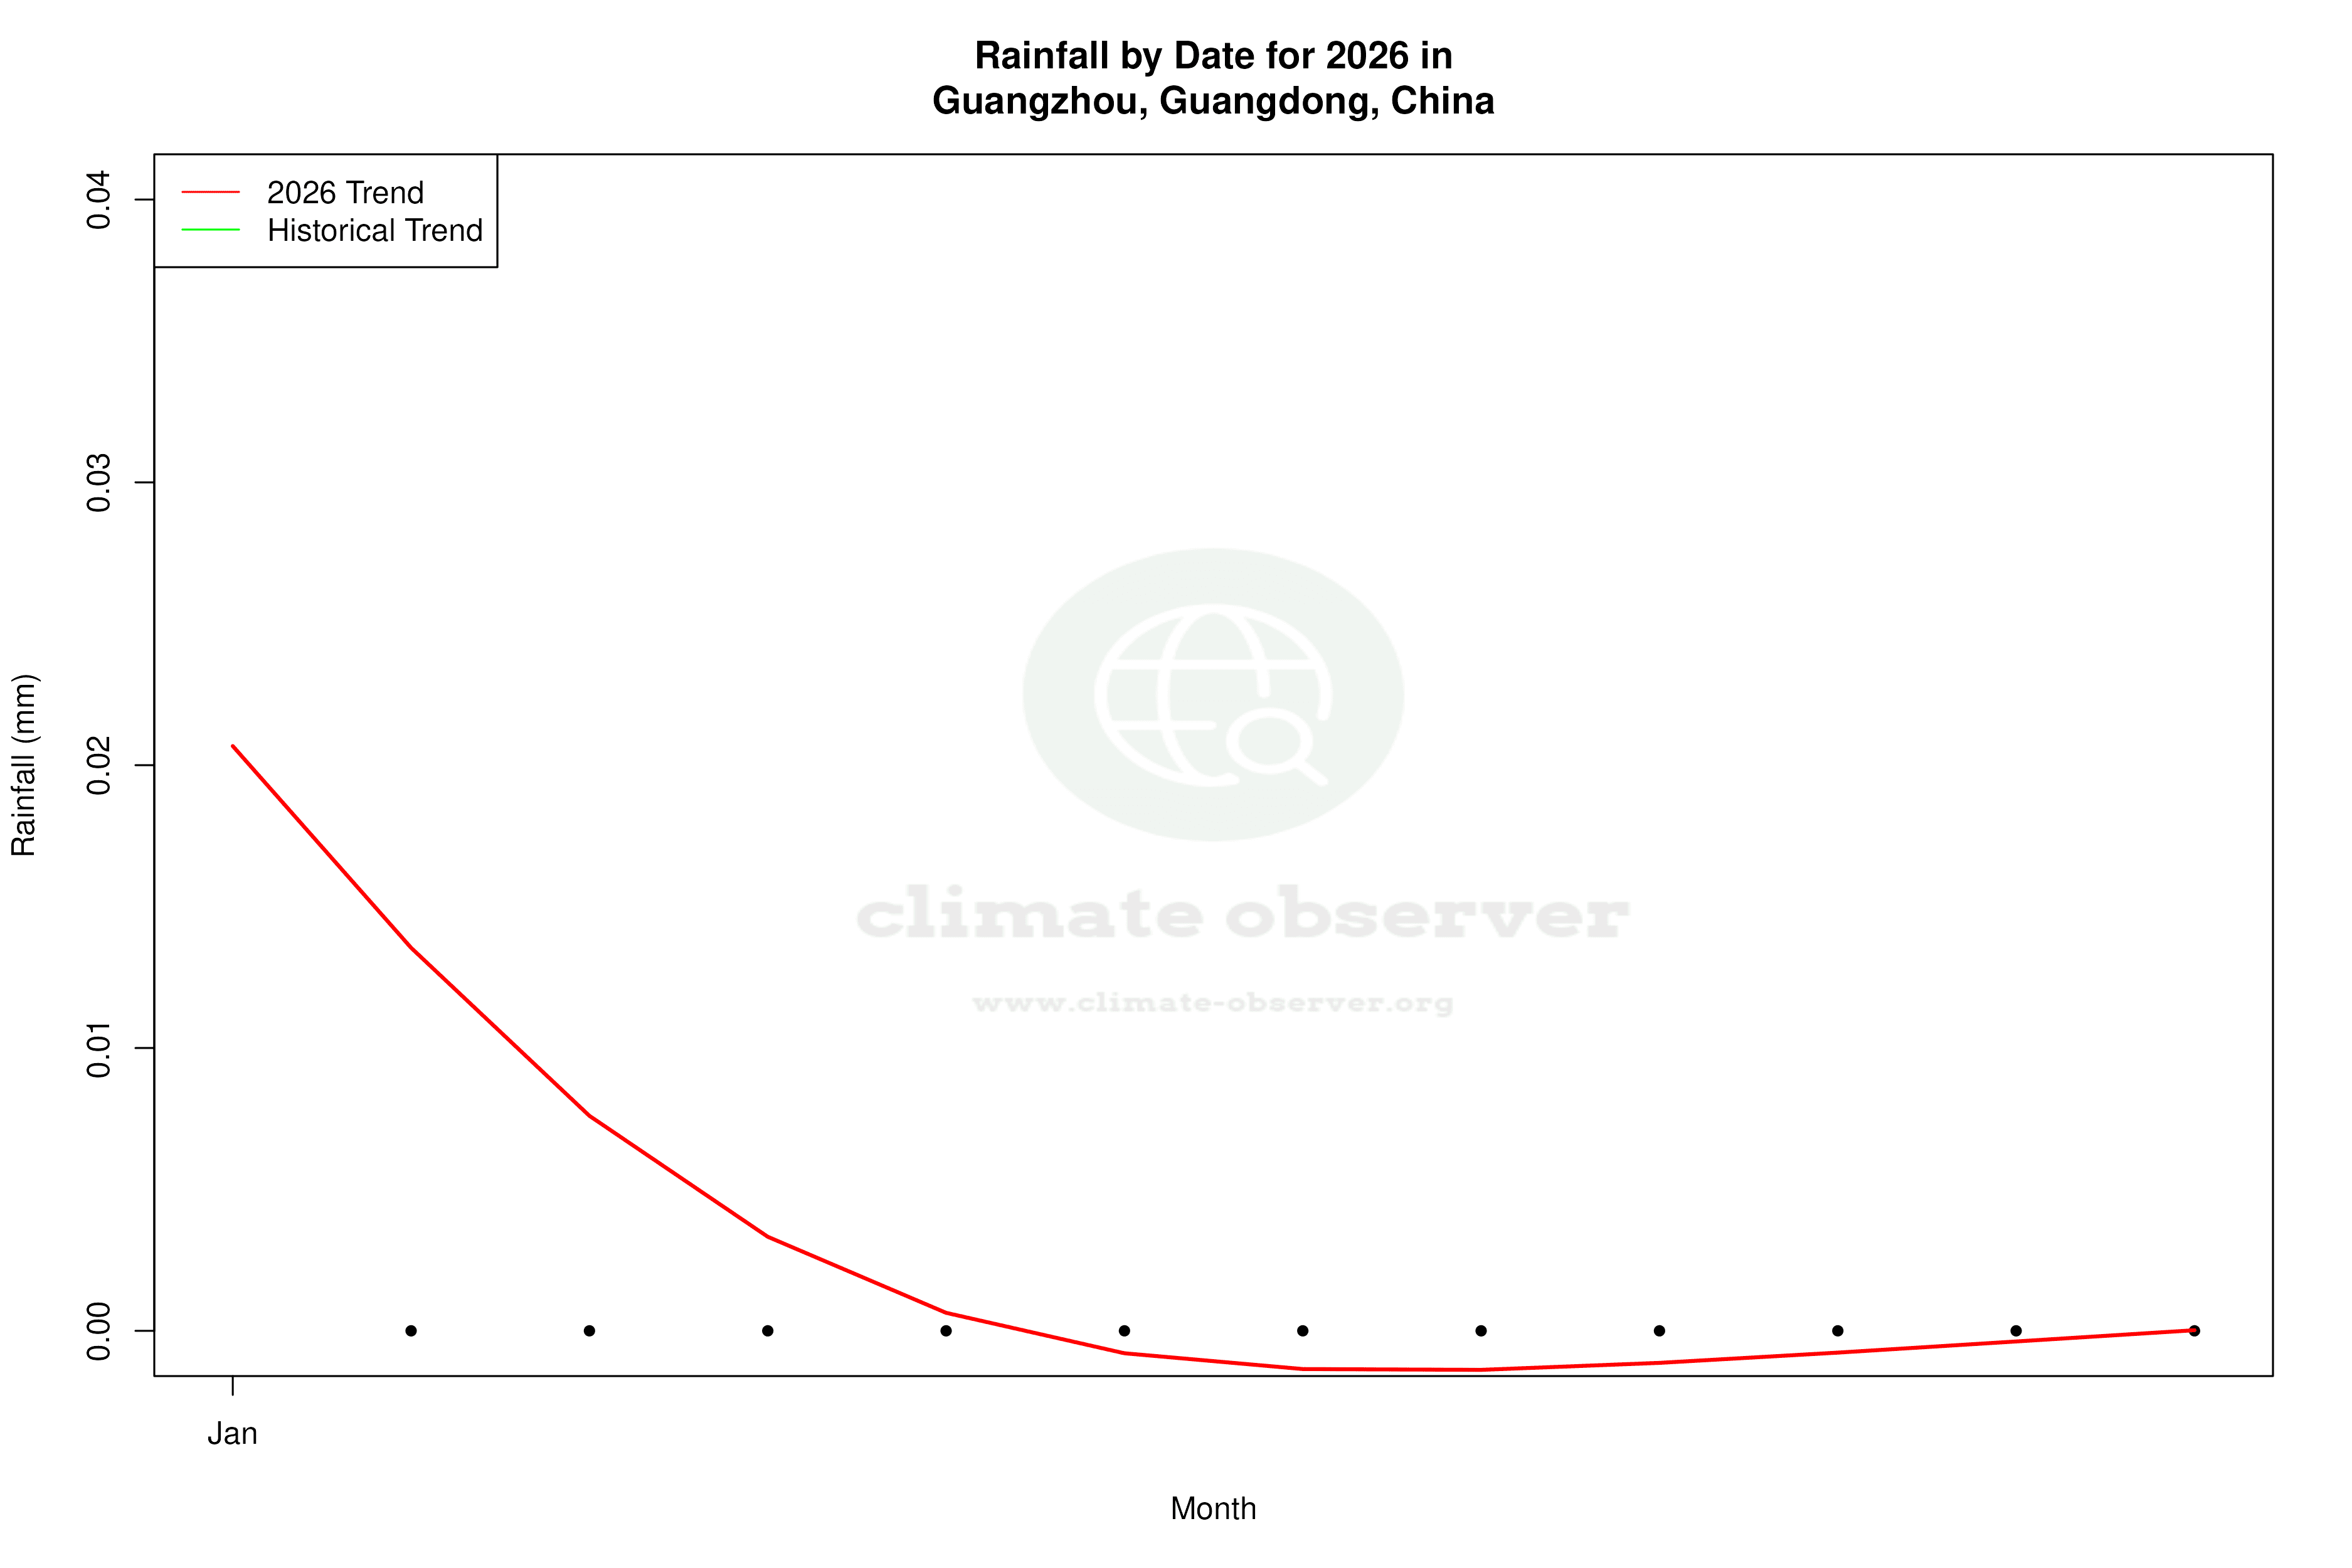
The Precipitation Concentration Index (PCI) offers insights into the distribution of rainfall events. A PCI value of over 20 indicates highly concentrated precipitation, while values under 10 suggest even distribution. Guangzhou's PCI has risen from a baseline of 15.80 to a current value of 16.26, reflecting a slight increase in precipitation concentration. This shift suggests that rainfall is becoming more concentrated into fewer, more intense events, which could have implications for local water management and flood risk.
Temperature Extremes and Records
Guangzhou's temperature extremes are noteworthy, with an all-time high of 40.0°C (104.0°F) and a low of 0.0°C (32.0°F). These records highlight the city's capacity for both intense heat and rare cold spells. The recent warming trend in high temperatures may push these records further, impacting energy demand and urban heat island effects.
Regional Climate Goals and Adaptation
China has set ambitious climate goals, including peak carbon emissions by 2030 and carbon neutrality by 2060. Guangzhou's climate data underscores the urgency of these targets, as rising temperatures and changing precipitation patterns pose challenges to urban infrastructure and public health. Recent weather events, such as intense summer heatwaves, serve as reminders of the need for robust climate adaptation strategies.
Guangzhou's climate profile reveals a city at the crossroads of natural variability and anthropogenic change. The warming trends, particularly in high temperatures, alongside evolving precipitation patterns, highlight the need for continued monitoring and adaptive responses in line with national climate objectives.
Station Statistics
10-Year Trend
High: +2.22 °C/decade
Low: -0.07 °C/decade
Rain: -1.52 mm/decade
25-Year Trend
High: +0.74 °C/decade
Low: -0.42 °C/decade
Rain: +0.39 mm/decade
50-Year Trend
High: +0.52 °C/decade
Low: +0.03 °C/decade
Rain: +0.36 mm/decade
All-Time Trend
High: +0.28 °C/decade
Low: +0.09 °C/decade
Rain: +0.19 mm/decade
Percentage Above-Average Days
Last 12 Months: 64.1%
This Year: 80.5%
Precipitation Concentration Index (PCI) ℹ️
Last 12 Months: 16.3
Historical Average: 15.4
Percentile Rank of Last 12 Months ℹ️
High: 98th percentile
Low: 66th percentile
Rain: 80th percentile
Change in Variance ℹ️
High: -8.2%
Low: +0.0%
Intraday: +30.4%
Data Coverage
94.7%
First Year of Data
1945
Station Location
Historical Weather Records
| Max High | Avg High | Min High | Max Avg | Avg Avg | Min Avg | Max Low | Avg Low | Min Low | Max Precipitation | Avg Precipitation | Max Snow | Avg Snow | |
|---|---|---|---|---|---|---|---|---|---|---|---|---|---|
| Record | 40.0 °C | — | 4.3 °C | 35.1 °C | — | 2.9 °C | 30.4 °C | — | 0.0 °C | 284.9 mm | — | — | — |
| January | 29.0 °C | 18.7 °C | 4.5 °C | 23.0 °C | 13.9 °C | 2.9 °C | 21.1 °C | 10.1 °C | 0.1 °C | 63.5 mm | 1.3 mm | — | — |
| February | 30.0 °C | 19.4 °C | 4.3 °C | 25.1 °C | 15.2 °C | 3.3 °C | 22.9 °C | 11.9 °C | 0.0 °C | 64.6 mm | 2.1 mm | — | — |
| March | 32.5 °C | 22.2 °C | 5.4 °C | 27.7 °C | 18.4 °C | 4.1 °C | 25.0 °C | 15.3 °C | 3.2 °C | 90.1 mm | 3.1 mm | — | — |
| April | 35.0 °C | 26.2 °C | 10.6 °C | 29.8 °C | 22.4 °C | 9.4 °C | 26.6 °C | 19.3 °C | 7.7 °C | 159.0 mm | 6.3 mm | — | — |
| May | 39.0 °C | 29.9 °C | 18.7 °C | 34.6 °C | 25.9 °C | 16.2 °C | 28.1 °C | 22.9 °C | 13.7 °C | 218.9 mm | 10.1 mm | — | — |
| June | 38.9 °C | 31.7 °C | 22.5 °C | 33.3 °C | 27.8 °C | 20.7 °C | 29.3 °C | 24.8 °C | 18.8 °C | 284.9 mm | 10.6 mm | — | — |
| July | 40.0 °C | 33.2 °C | 25.5 °C | 35.1 °C | 28.9 °C | 24.3 °C | 30.4 °C | 25.5 °C | 21.6 °C | 253.6 mm | 7.4 mm | — | — |
| August | 39.0 °C | 33.0 °C | 22.9 °C | 34.4 °C | 28.6 °C | 21.7 °C | 29.4 °C | 25.3 °C | 20.9 °C | 198.2 mm | 8.1 mm | — | — |
| September | 39.0 °C | 31.9 °C | 20.9 °C | 33.6 °C | 27.5 °C | 18.1 °C | 29.3 °C | 24.1 °C | 15.8 °C | 245.9 mm | 6.4 mm | — | — |
| October | 37.0 °C | 29.1 °C | 17.4 °C | 31.7 °C | 24.4 °C | 12.1 °C | 27.2 °C | 20.6 °C | 9.5 °C | 104.7 mm | 2.1 mm | — | — |
| November | 33.4 °C | 25.0 °C | 9.6 °C | 27.7 °C | 20.0 °C | 7.5 °C | 25.2 °C | 16.1 °C | 4.9 °C | 68.7 mm | 1.3 mm | — | — |
| December | 31.0 °C | 20.6 °C | 5.3 °C | 24.8 °C | 15.4 °C | 3.3 °C | 22.6 °C | 11.4 °C | 0.0 °C | 50.8 mm | 0.9 mm | — | — |
Data Visualisations
Remove WatermarksCurrent Year Climate Trends vs Historical
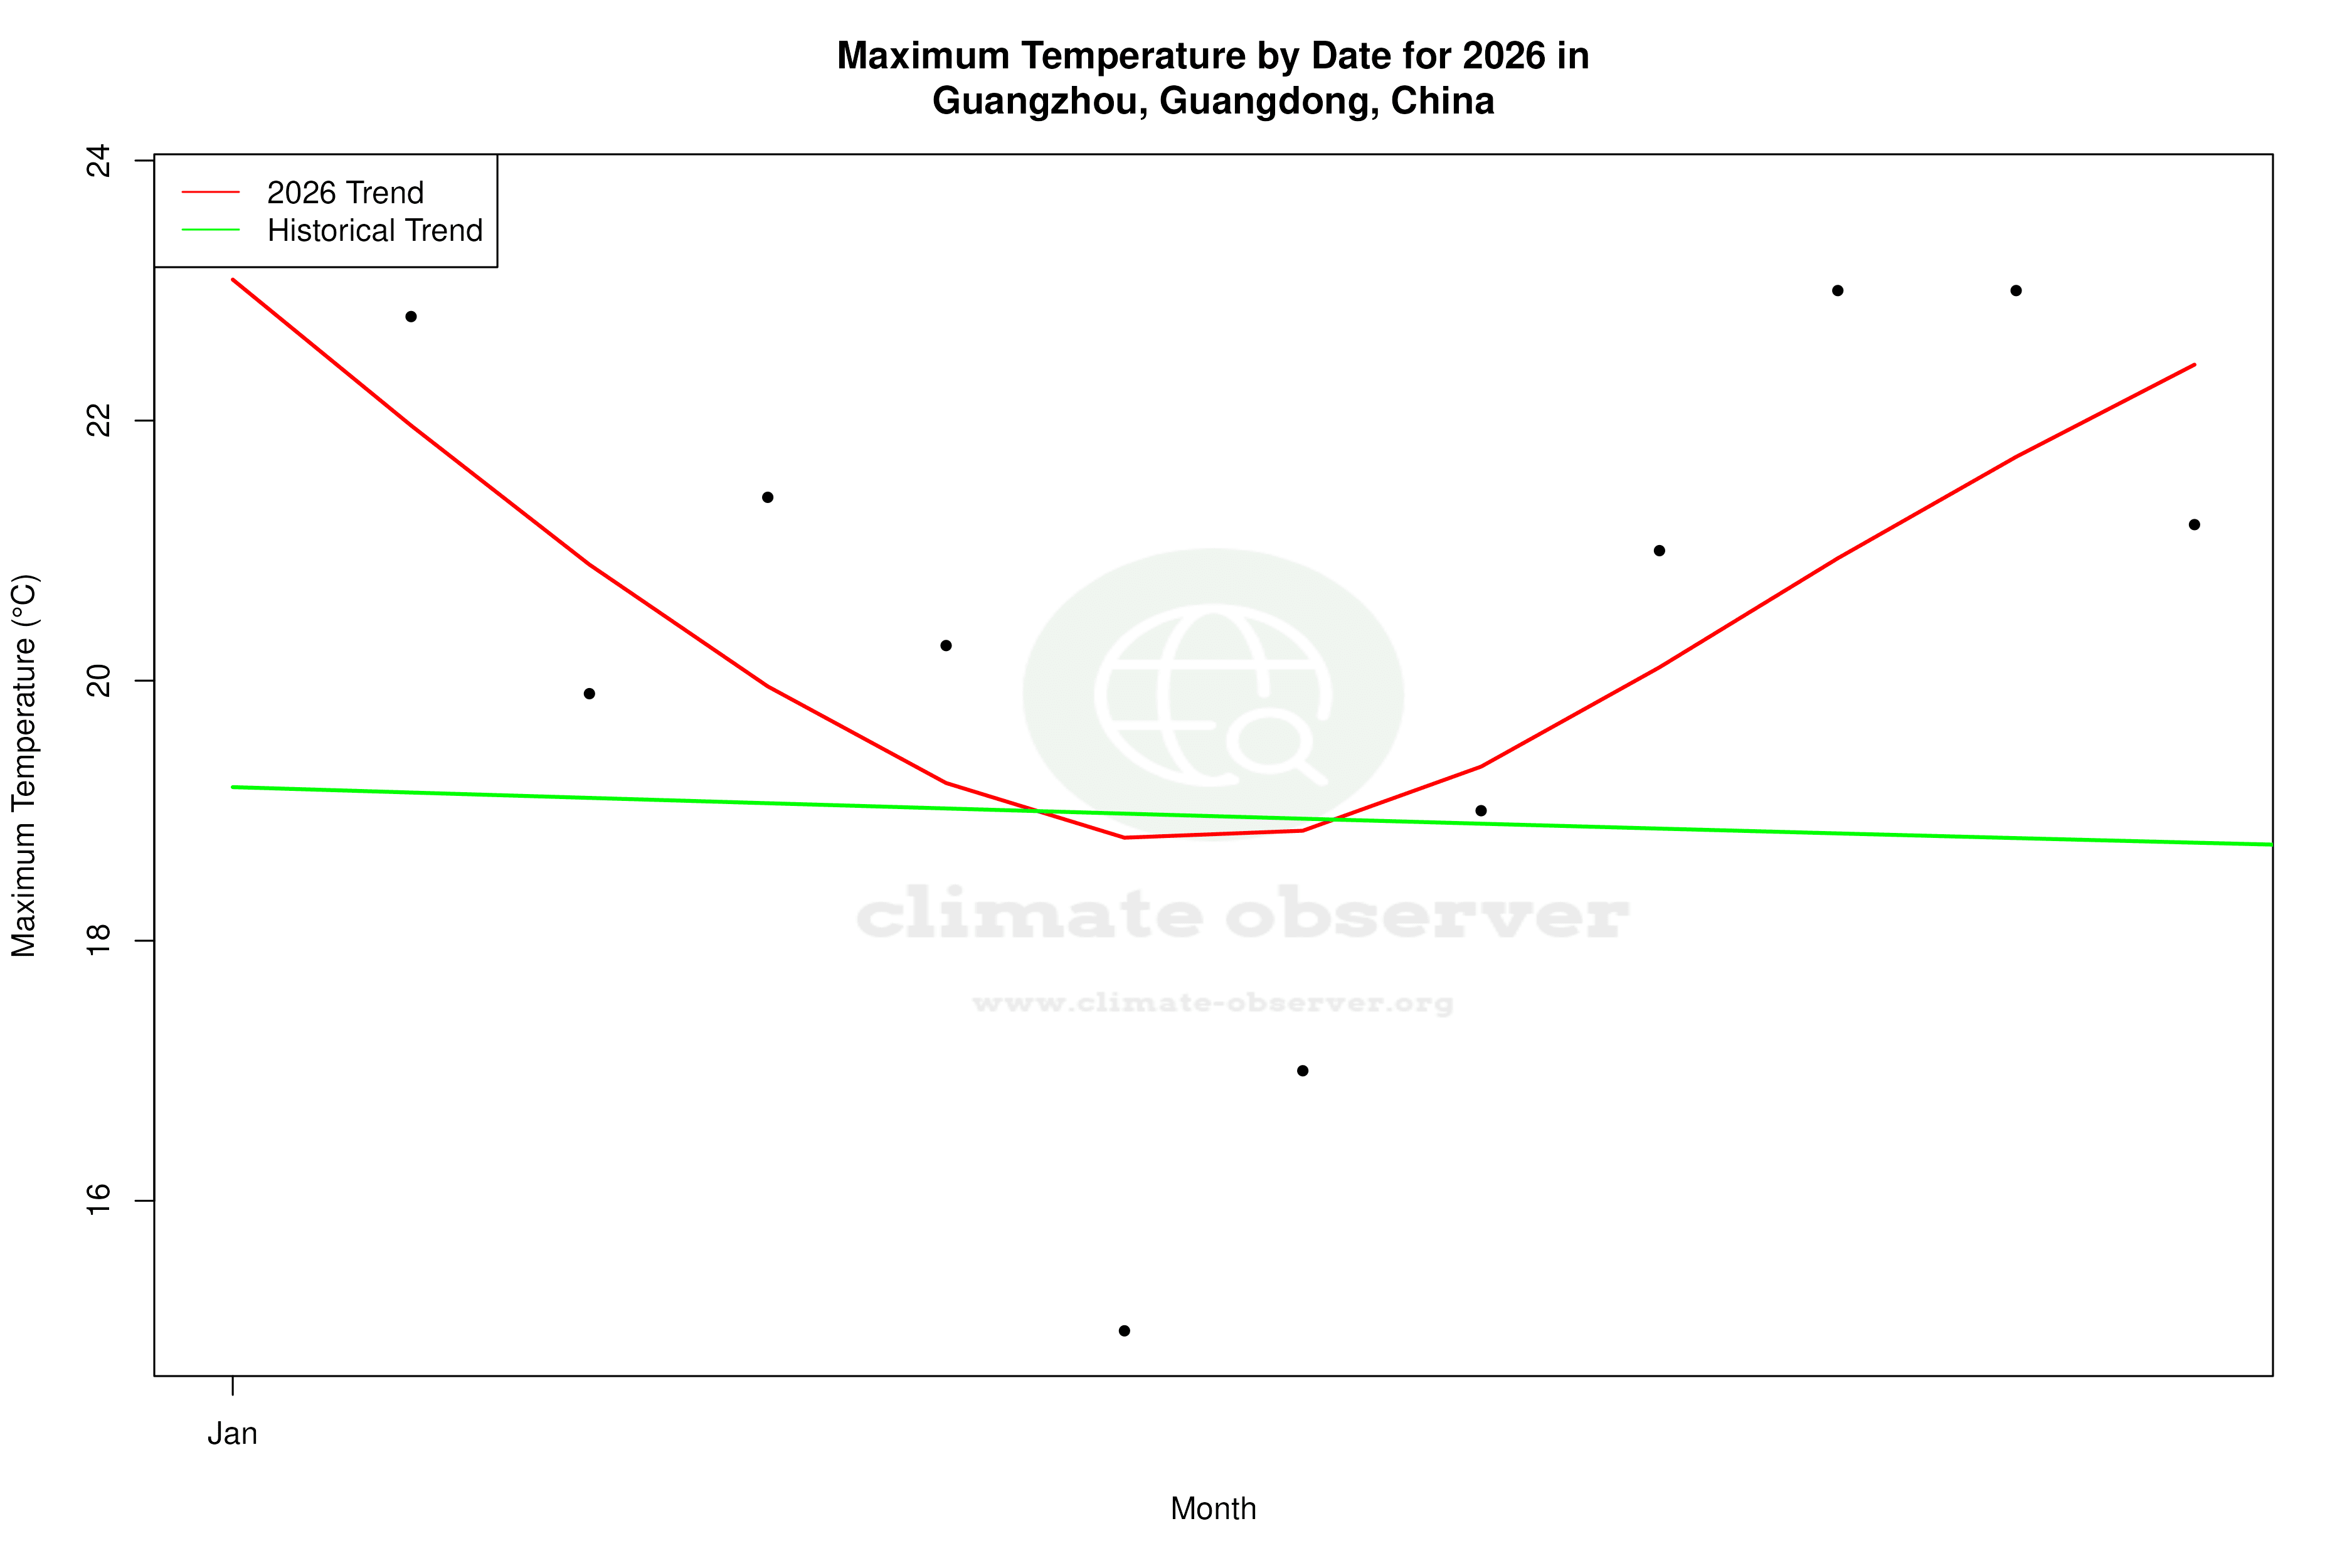


Max Temperature this Year | 1 of 6
Climate 12-Month Moving Averages


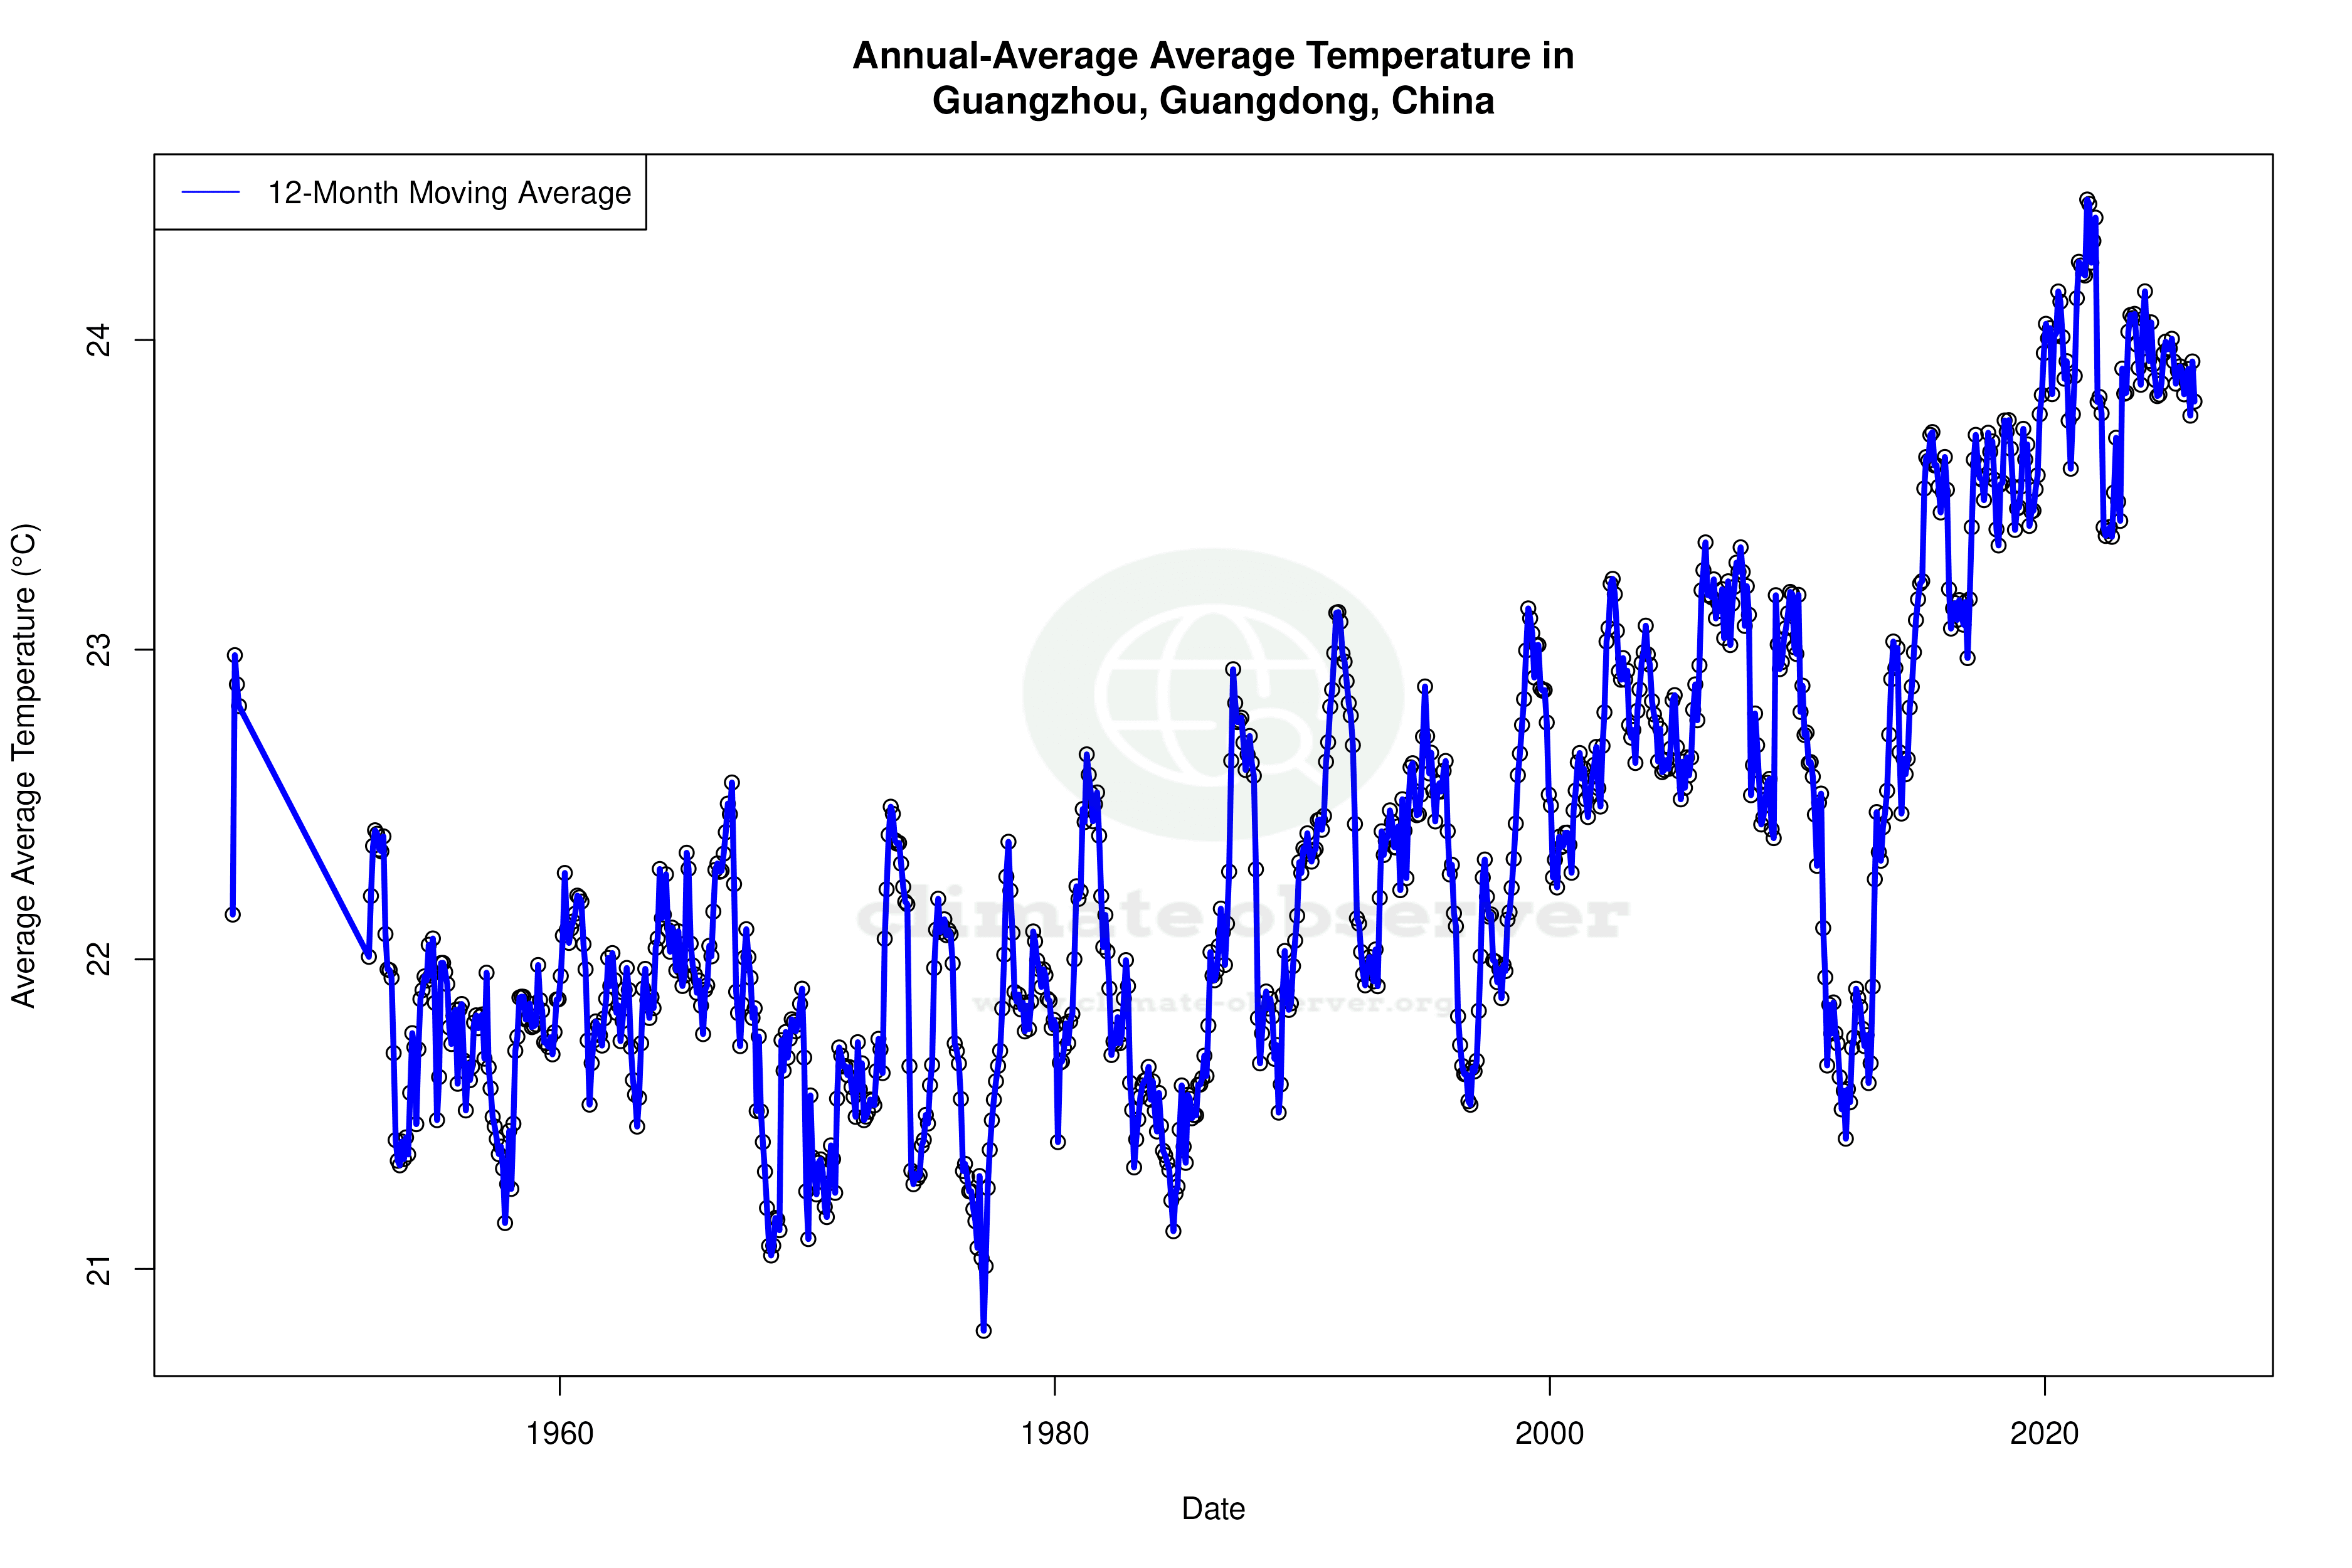


Max Temperature 12-Month MA | 1 of 6
Daily Data Points and Averages Throughout the Year


Average Max Temperature Throughout Year | 1 of 5
