Climate for Station: Nanning, Guangxi, China
Loading live weather...
Climate Analysis & Overview
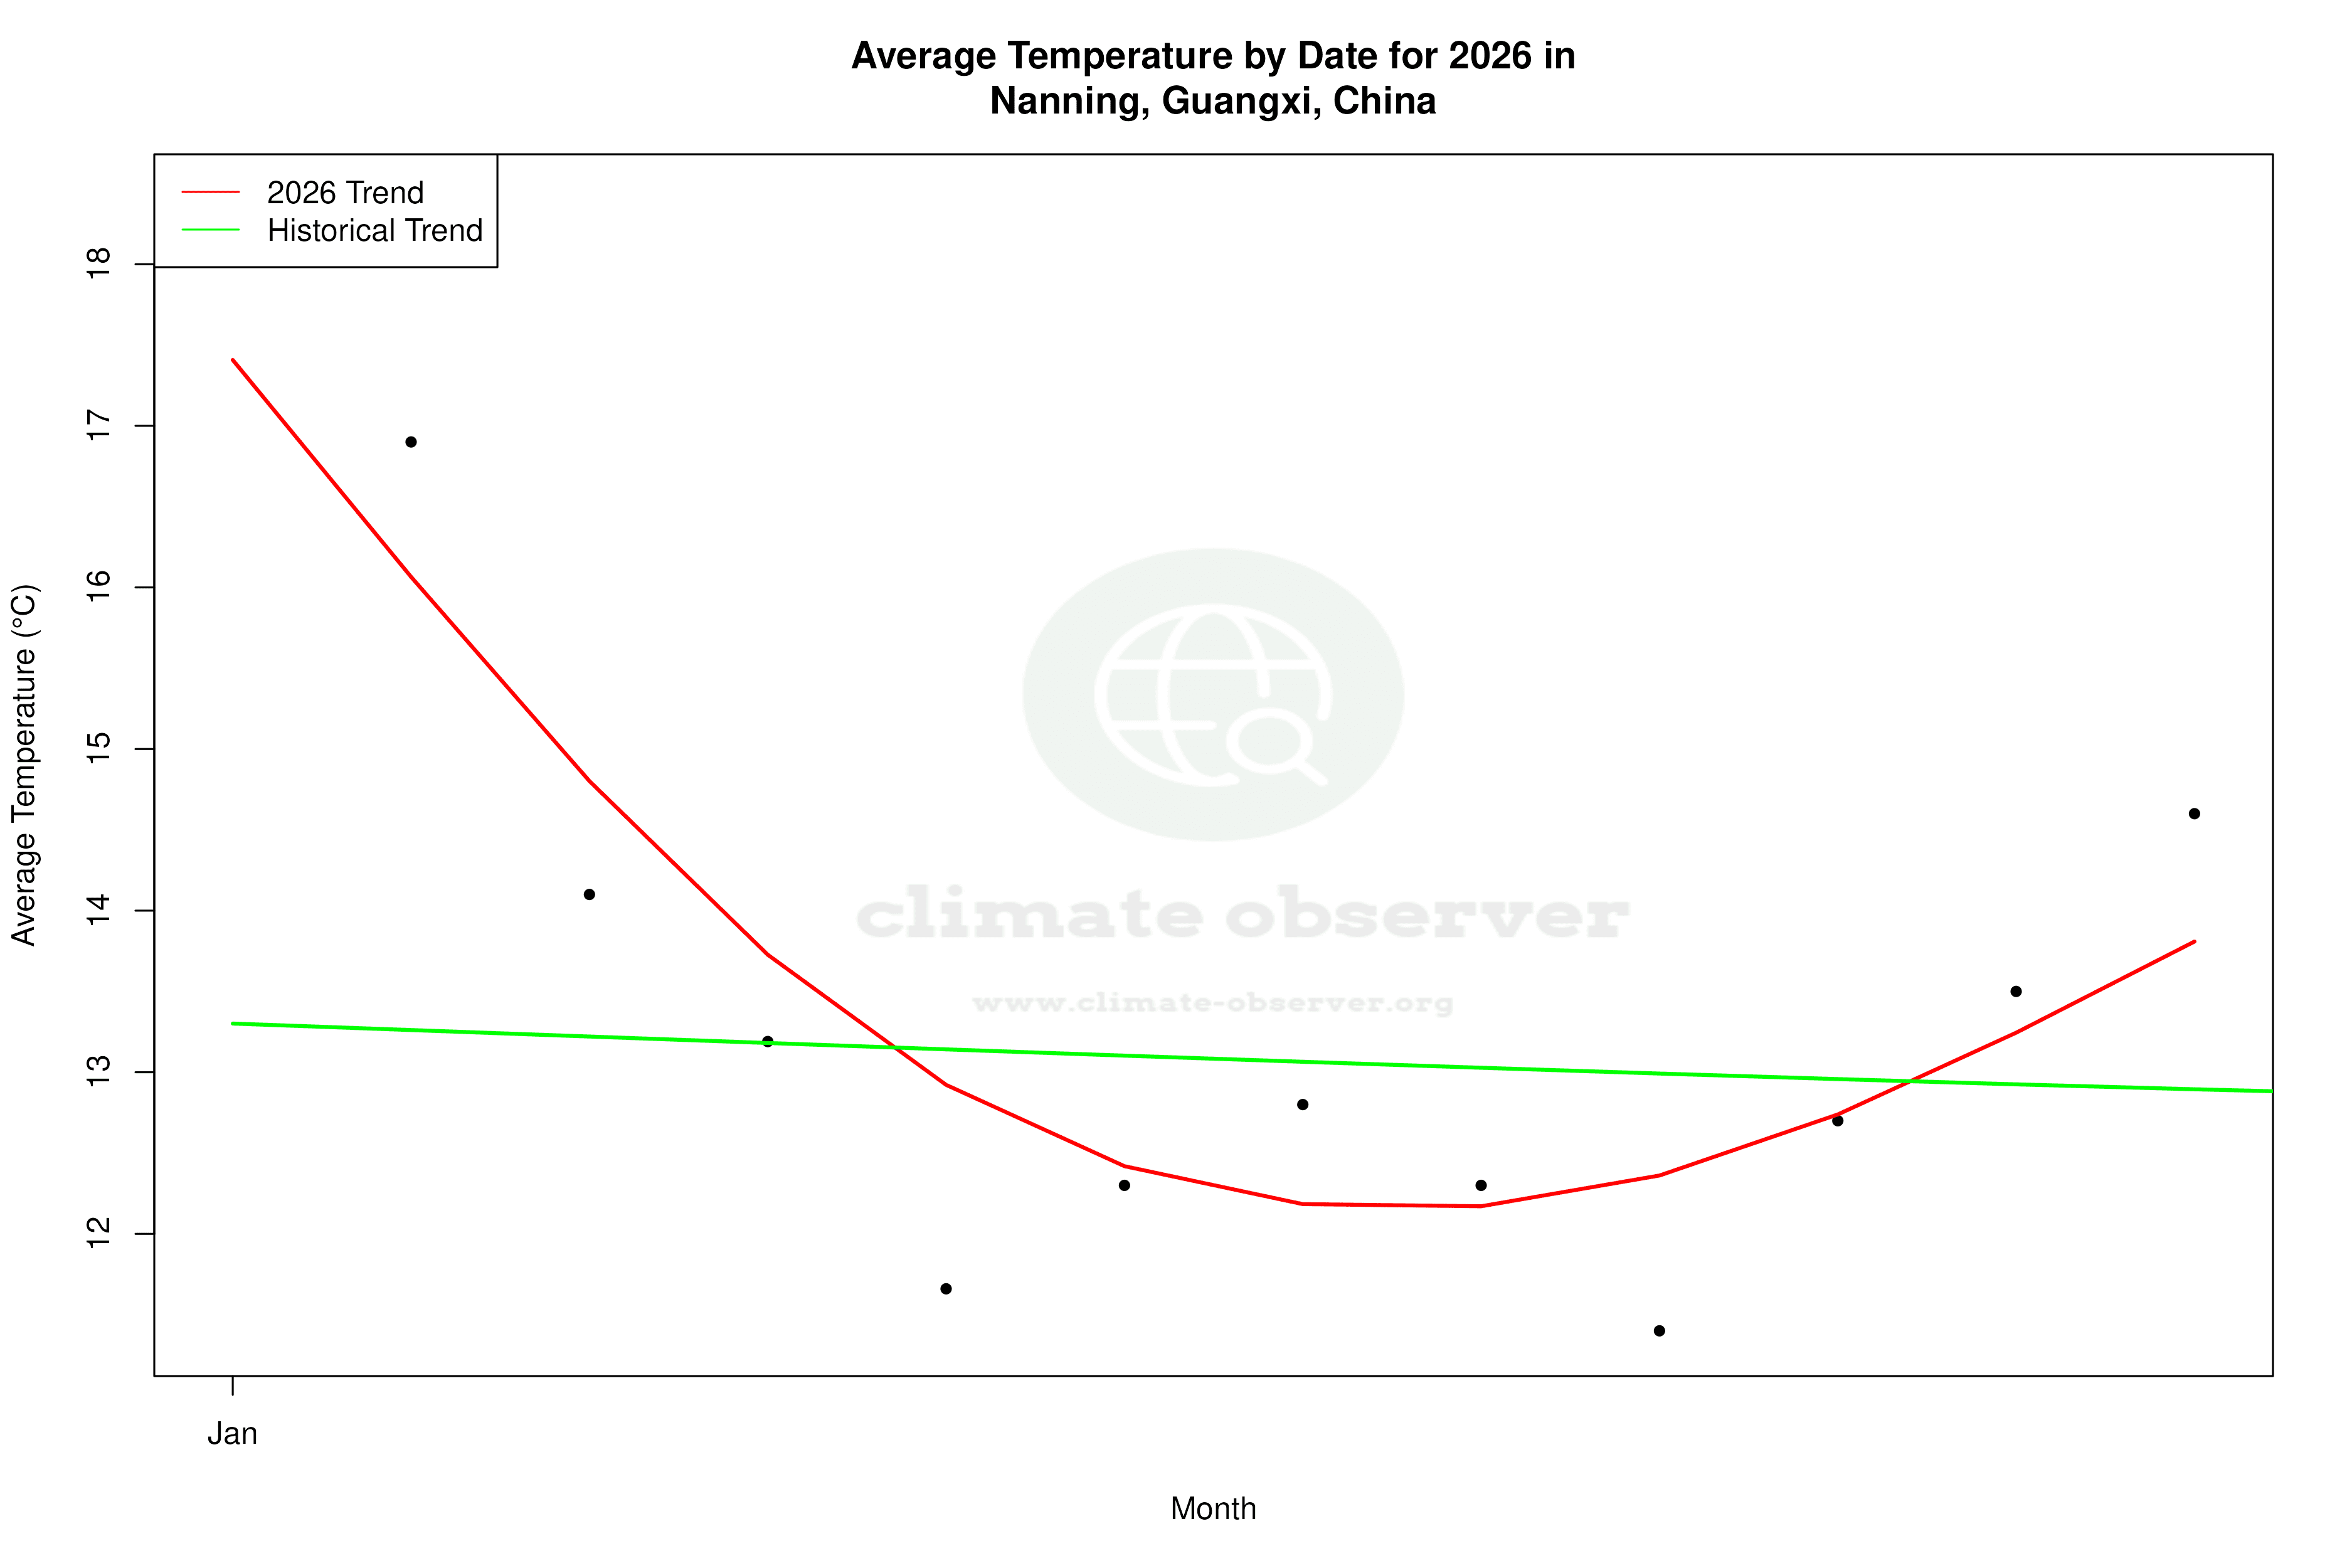
Nanning, situated in the subtropical zone of southern China, is experiencing a complex climate trajectory. While long-term warming trends are evident, recent years show divergent patterns in temperature extremes. Precipitation distribution has marginally evened out, possibly affecting local water management strategies.
Subtropical Climate Dynamics
Nanning, located at 22.633°N, 108.217°E, falls under the Köppen climate classification of Cfa, denoting a humid subtropical climate. This classification is characterised by hot, humid summers and mild winters, influenced by its proximity to the Tropic of Cancer. The city's geography, nestled between the Nanling Mountains and the South China Sea, contributes to its distinct seasonal patterns. The all-time temperature trends indicate a slight warming, with highs rising by 0.10°C (0.18°F) and lows by 0.03°C (0.05°F). These figures suggest a gradual increase in overall temperature, aligning with broader global warming patterns.
Decadal Temperature Anomalies
The past decade presents a more nuanced picture. High temperatures have surged by 1.83°C (3.29°F), a significant increase that suggests recent years have been notably warmer. Conversely, low temperatures have decreased by 0.27°C (0.49°F), indicating cooler nights. This divergence could be attributed to urban heat island effects or shifts in atmospheric circulation patterns, warranting further investigation. Such trends may have implications for energy consumption and public health, especially during heatwaves.
Precipitation Patterns and Implications
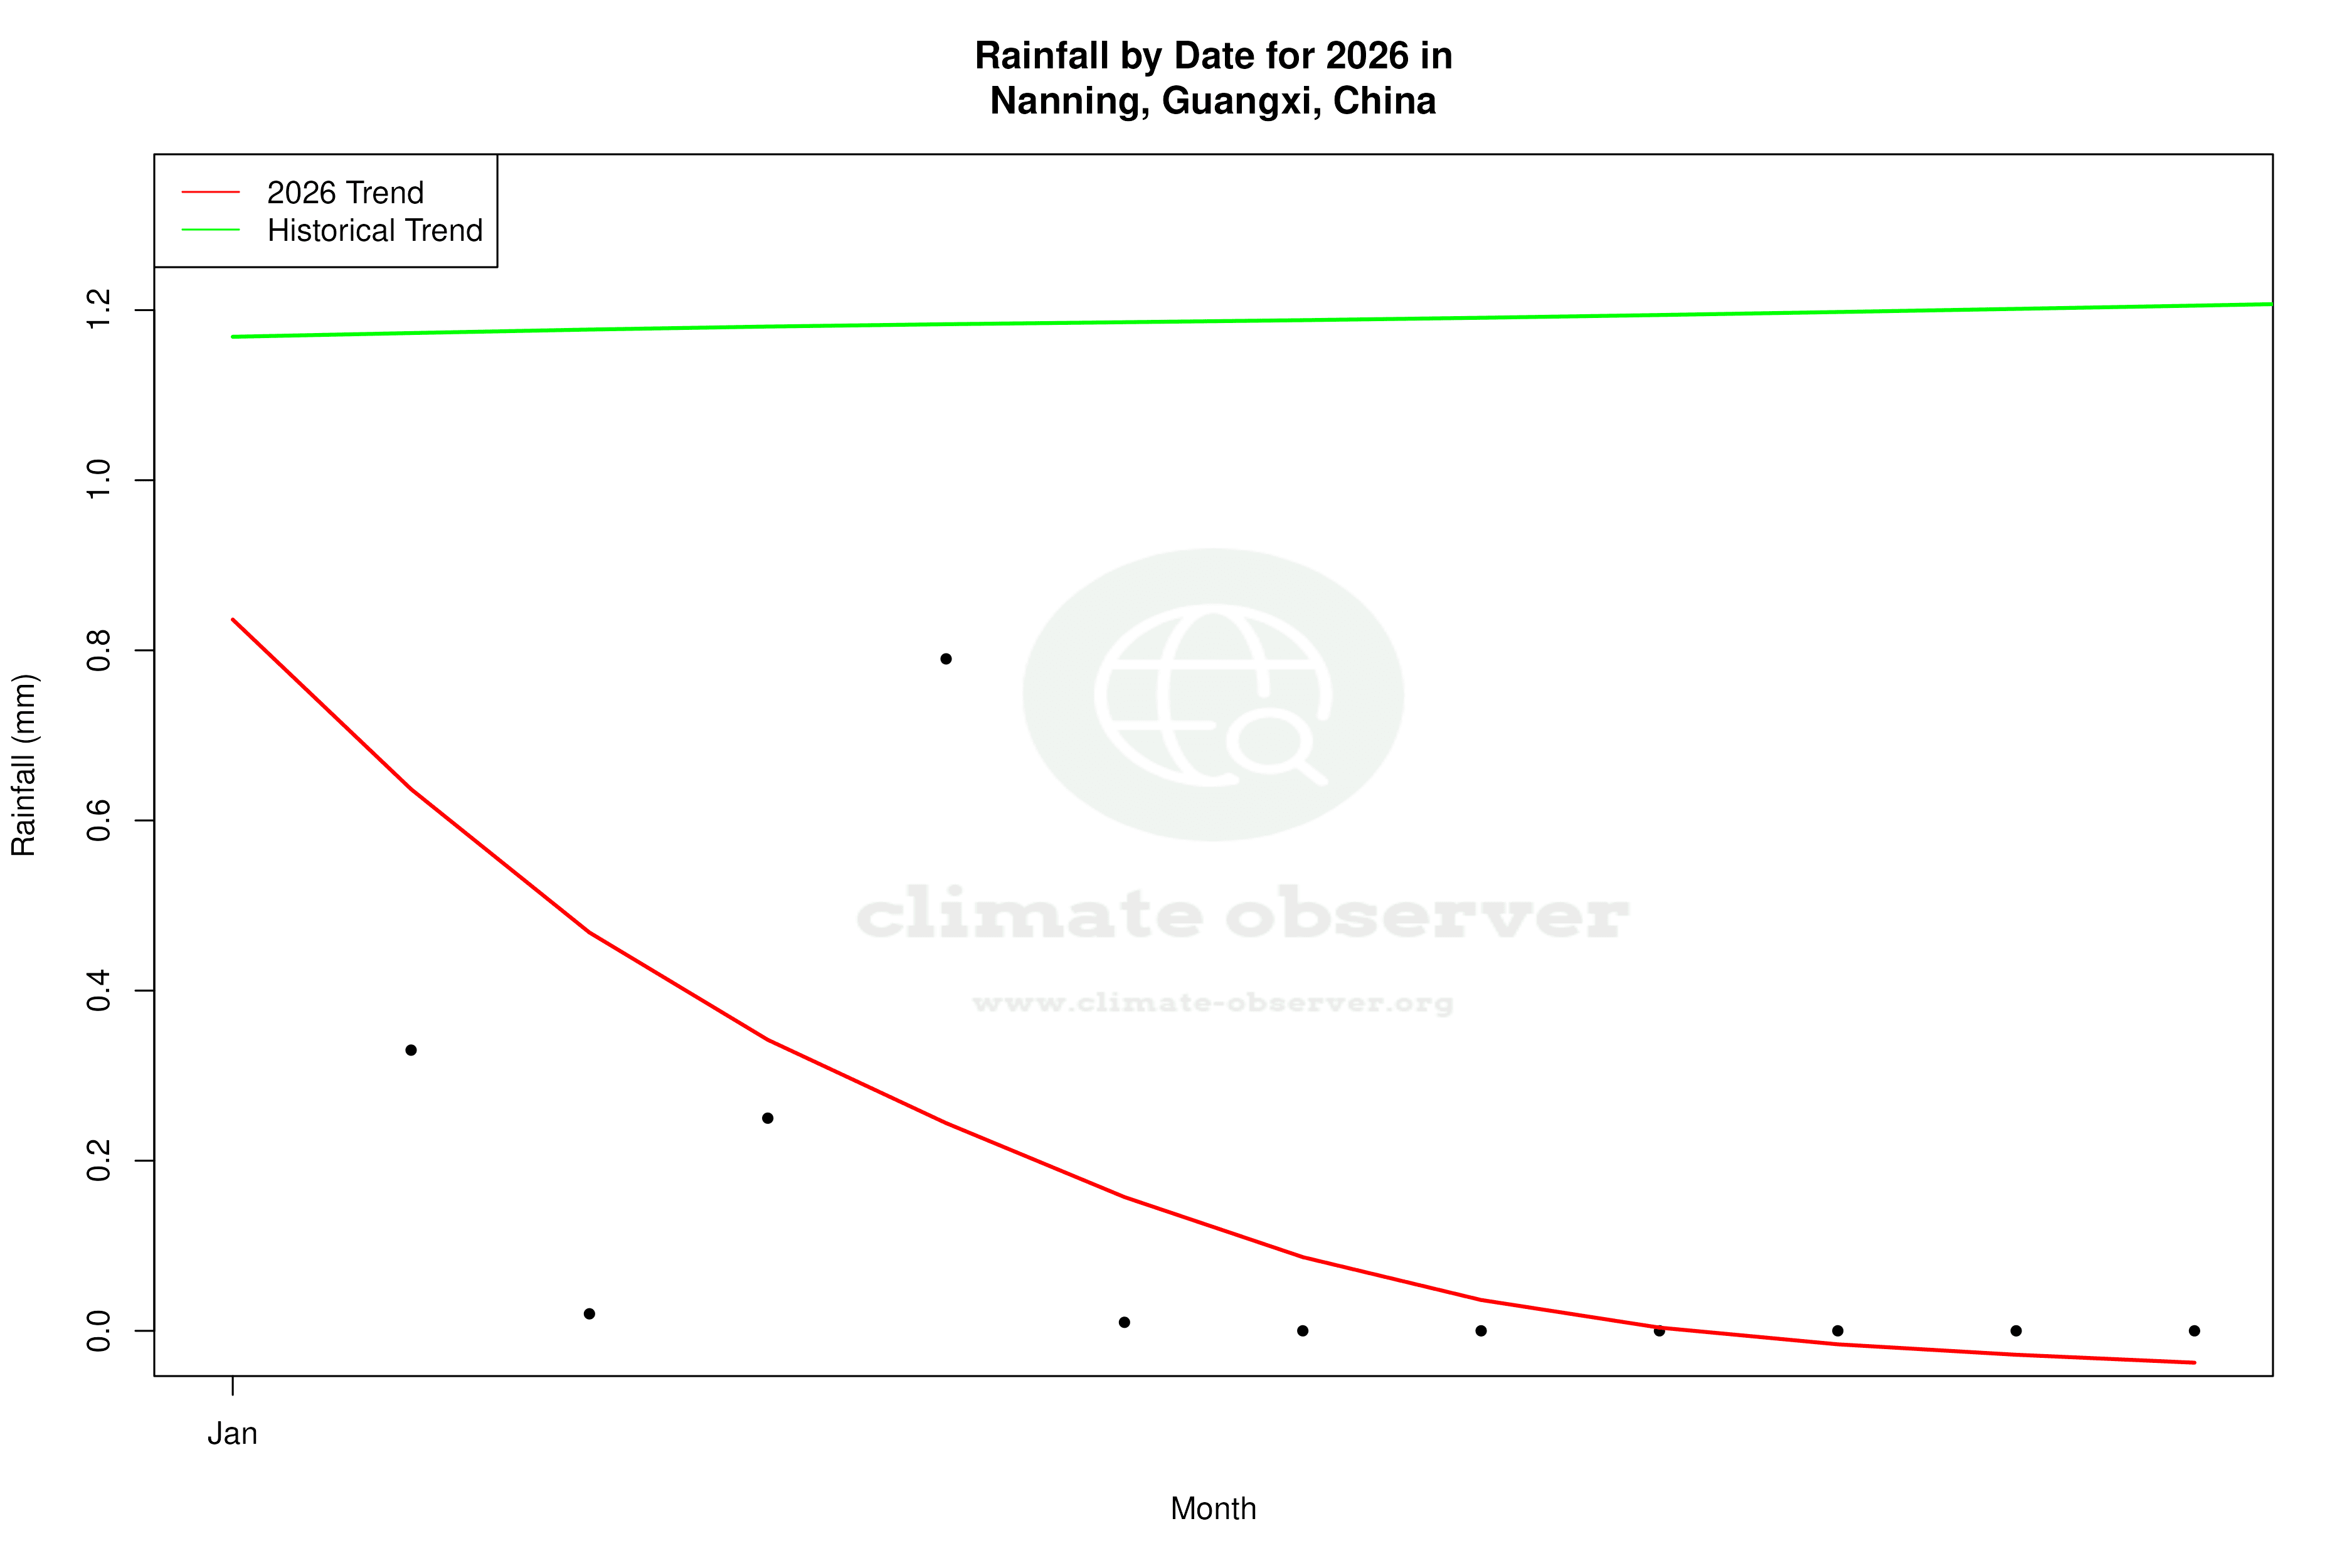
Nanning's Precipitation Concentration Index (PCI) has seen a marginal decrease from a baseline of 15.09 to 14.09. The PCI measures how precipitation is distributed over time, with lower values indicating more even distribution. This slight change suggests that rainfall events are becoming more evenly spread throughout the year. While not drastic, this shift could impact agricultural planning and flood management, as more evenly distributed rainfall can mitigate both drought and flood risks.
Temperature Extremes: A Tale of Two Records
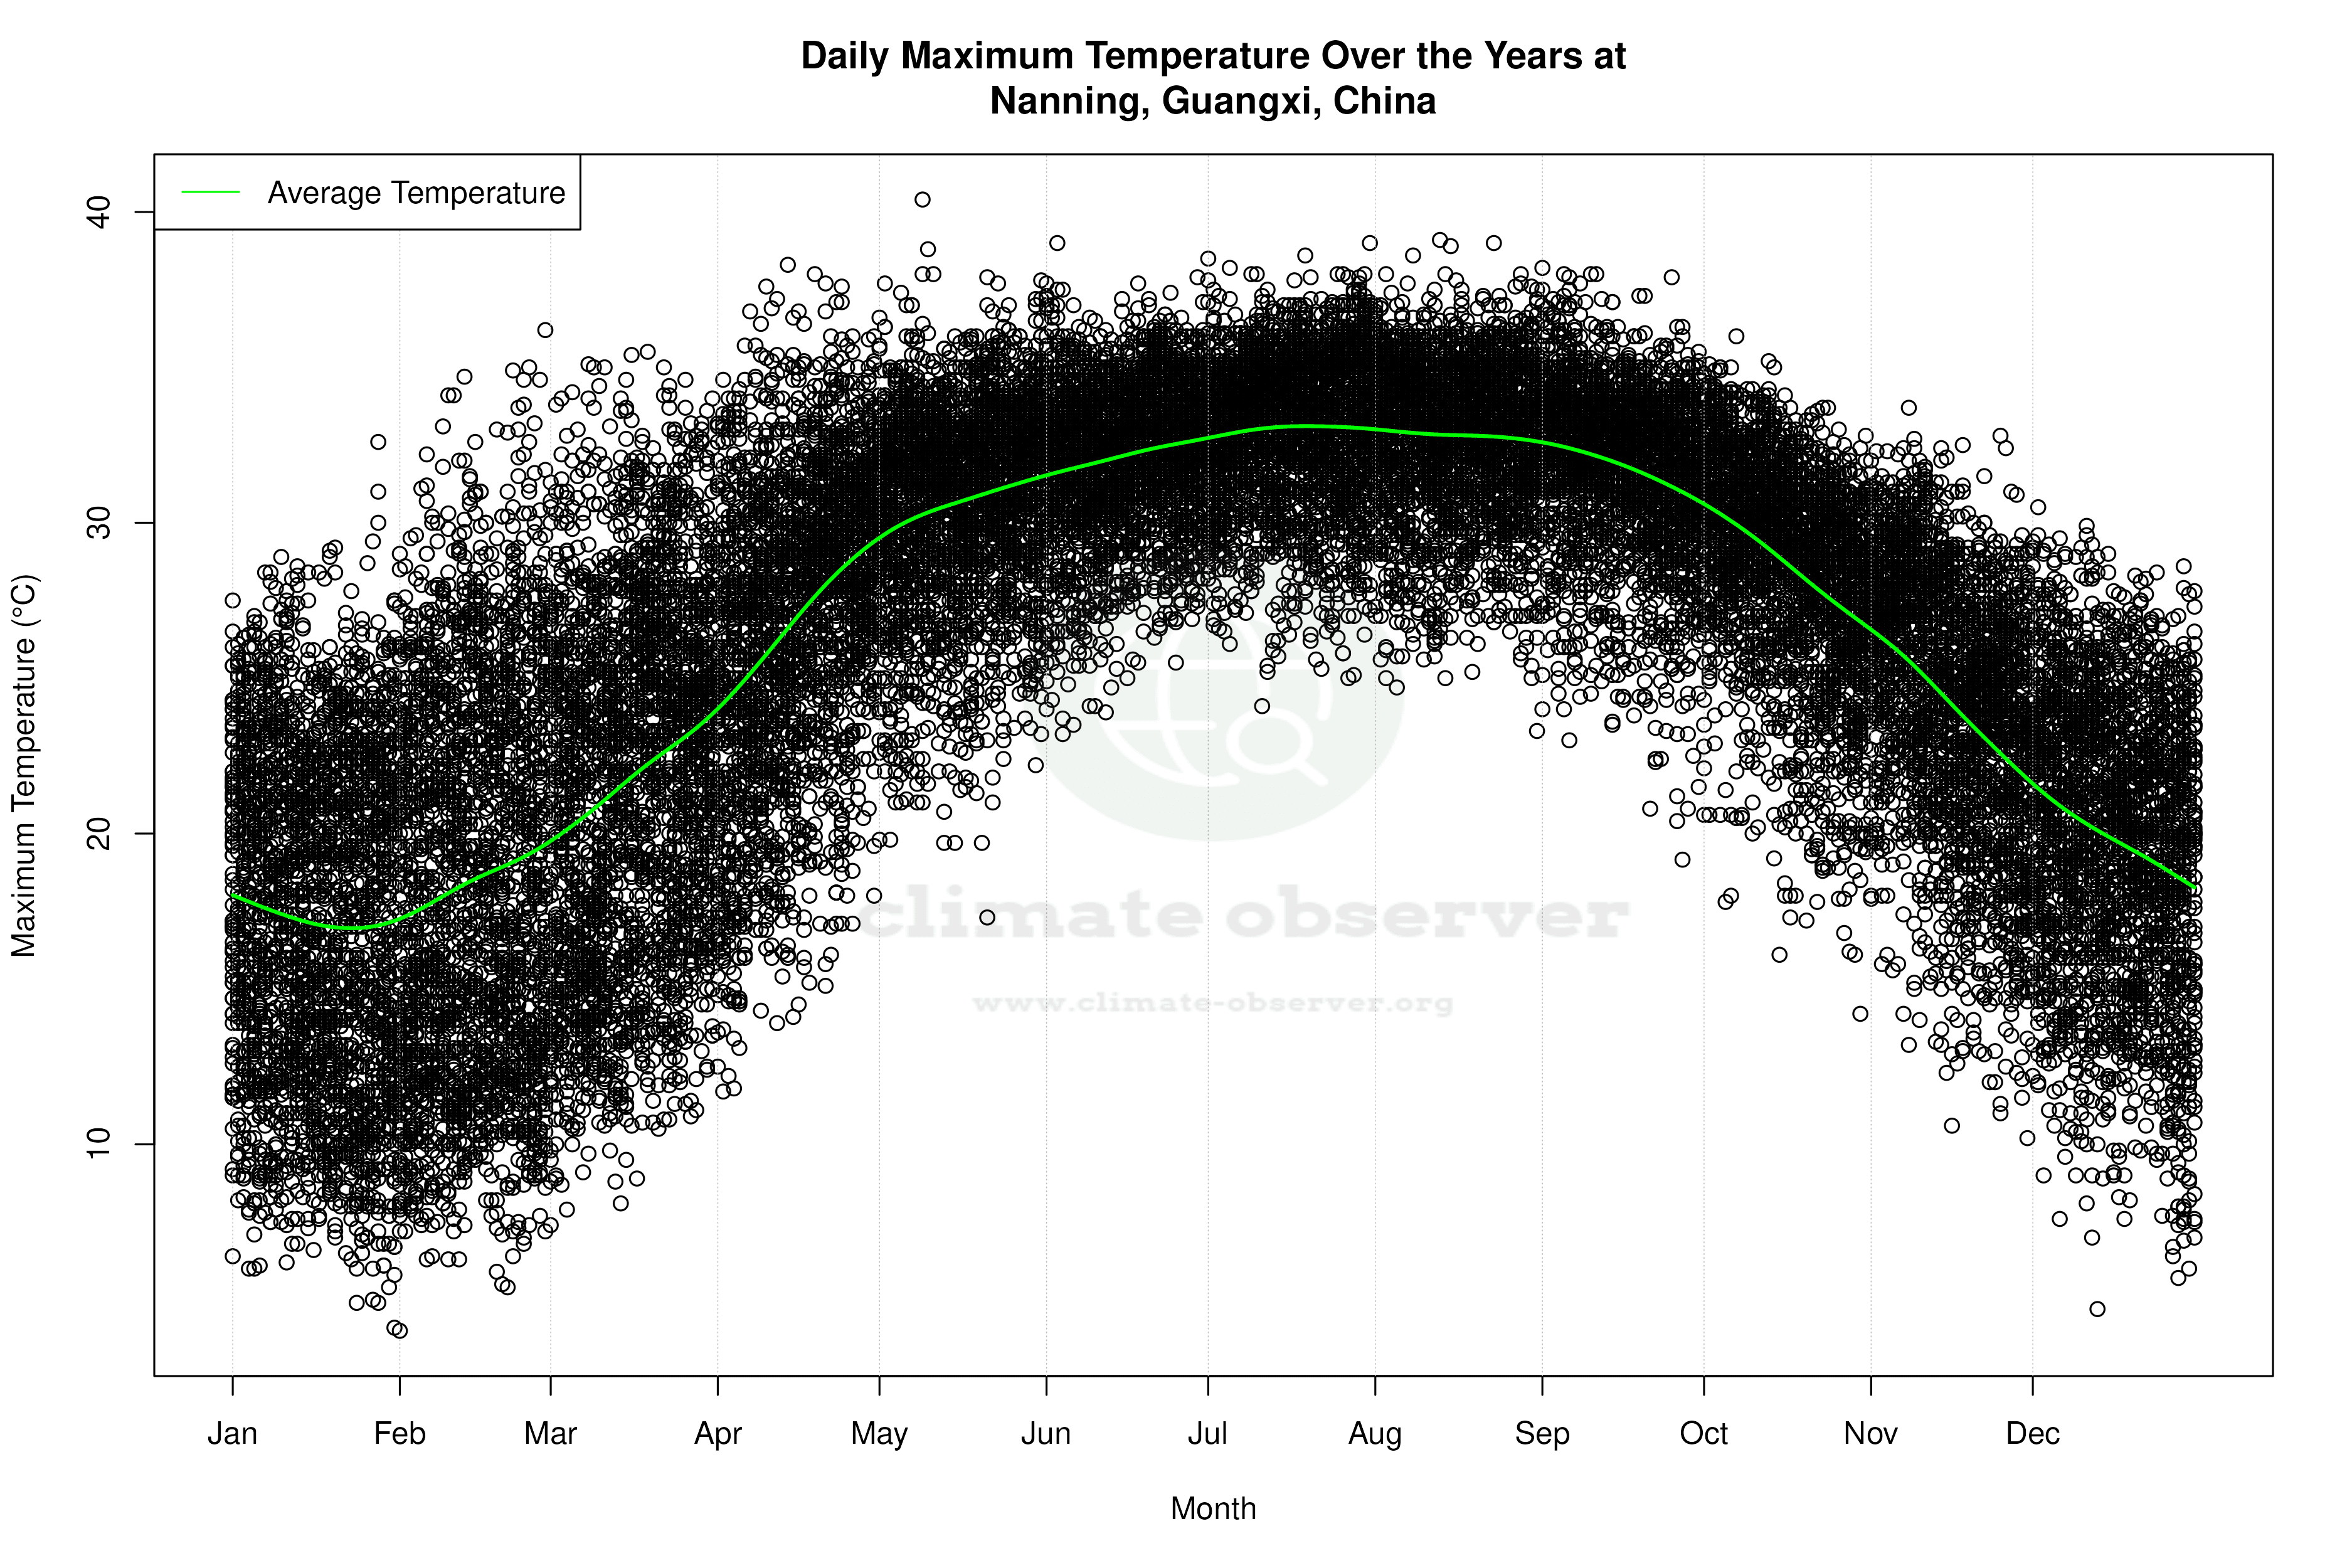
Nanning's historical temperature records underscore its climatic extremes. The highest recorded temperature stands at 40.4°C (104.7°F), while the lowest is -2.1°C (28.2°F). These records highlight the city's capacity for both intense heat and occasional cold snaps. Such extremes are critical for infrastructure resilience and emergency preparedness, as they test the limits of local adaptation measures.
Regional Climate Goals and Local Realities
China's commitment to reducing carbon emissions and enhancing climate resilience is a backdrop to these localised trends. Nanning's climate data, with its warming highs and cooling lows, reflects the broader challenges faced by the region. As China pursues its climate goals, understanding these local dynamics becomes crucial for targeted policy interventions and sustainable urban development.
Station Statistics
10-Year Trend
High: +3.04 °F/decade
Low: -0.13 °F/decade
Rain: -0.049 in/decade
25-Year Trend
High: +0.88 °F/decade
Low: +0.56 °F/decade
Rain: +0.007 in/decade
50-Year Trend
High: +0.45 °F/decade
Low: -0.09 °F/decade
Rain: +0.002 in/decade
All-Time Trend
High: +0.19 °F/decade
Low: +0.06 °F/decade
Rain: +0.001 in/decade
Percentage Above-Average Days
Last 12 Months: 57.7%
This Year: 69.8%
Precipitation Concentration Index (PCI) ℹ️
Last 12 Months: 12.6
Historical Average: 15.1
Percentile Rank of Last 12 Months ℹ️
High: 94th percentile
Low: 81st percentile
Rain: 82nd percentile
Change in Variance ℹ️
High: -9.1%
Low: -6.1%
Intraday: -20.2%
Data Coverage
92.3%
First Year of Data
1944
Station Location
Historical Weather Records
| Max High | Avg High | Min High | Max Avg | Avg Avg | Min Avg | Max Low | Avg Low | Min Low | Max Precipitation | Avg Precipitation | Max Snow | Avg Snow | |
|---|---|---|---|---|---|---|---|---|---|---|---|---|---|
| Record | 104.72 °F | — | 39.20 °F | 90.68 °F | — | 36.32 °F | 84.20 °F | — | 28.22 °F | 7.82 in | — | — | — |
| January | 90.68 °F | 63.09 °F | 39.38 °F | 74.12 °F | 55.34 °F | 36.32 °F | 69.80 °F | 49.66 °F | 28.22 °F | 2.70 in | 0.05 in | — | — |
| February | 97.16 °F | 65.21 °F | 39.20 °F | 78.26 °F | 57.93 °F | 38.66 °F | 73.04 °F | 52.69 °F | 29.84 °F | 2.50 in | 0.06 in | — | — |
| March | 95.90 °F | 71.33 °F | 45.32 °F | 81.32 °F | 64.18 °F | 41.90 °F | 75.38 °F | 58.97 °F | 38.66 °F | 3.17 in | 0.07 in | — | — |
| April | 100.94 °F | 80.41 °F | 53.06 °F | 86.00 °F | 72.50 °F | 50.36 °F | 78.44 °F | 66.73 °F | 48.56 °F | 4.11 in | 0.12 in | — | — |
| May | 104.72 °F | 87.15 °F | 63.14 °F | 88.16 °F | 78.77 °F | 60.80 °F | 81.50 °F | 72.75 °F | 56.30 °F | 6.21 in | 0.23 in | — | — |
| June | 102.20 °F | 89.87 °F | 73.76 °F | 89.42 °F | 81.94 °F | 71.06 °F | 83.30 °F | 76.46 °F | 63.12 °F | 5.73 in | 0.29 in | — | — |
| July | 102.20 °F | 91.47 °F | 75.38 °F | 90.68 °F | 83.10 °F | 72.68 °F | 83.84 °F | 77.41 °F | 67.46 °F | 7.82 in | 0.27 in | — | — |
| August | 102.38 °F | 91.03 °F | 73.94 °F | 90.32 °F | 82.42 °F | 69.08 °F | 83.30 °F | 76.78 °F | 67.82 °F | 5.66 in | 0.26 in | — | — |
| September | 100.76 °F | 89.25 °F | 66.49 °F | 90.32 °F | 80.28 °F | 62.53 °F | 84.20 °F | 74.14 °F | 59.72 °F | 4.56 in | 0.16 in | — | — |
| October | 96.80 °F | 83.58 °F | 57.56 °F | 85.46 °F | 74.27 °F | 55.22 °F | 78.80 °F | 67.62 °F | 44.42 °F | 3.54 in | 0.08 in | — | — |
| November | 92.66 °F | 75.77 °F | 50.36 °F | 82.58 °F | 66.21 °F | 47.48 °F | 76.10 °F | 59.45 °F | 33.26 °F | 4.27 in | 0.05 in | — | — |
| December | 86.90 °F | 67.67 °F | 40.46 °F | 76.64 °F | 58.40 °F | 39.02 °F | 72.14 °F | 51.68 °F | 28.58 °F | 2.34 in | 0.03 in | — | — |
Data Visualisations
Remove WatermarksCurrent Year Climate Trends vs Historical


Max Temperature this Year | 1 of 6
Climate 12-Month Moving Averages


Max Temperature 12-Month MA | 1 of 6
Daily Data Points and Averages Throughout the Year


Average Max Temperature Throughout Year | 1 of 5
