Climate for Station: Punta Arenas, Region of Magallanes and Chilean Antarctica, Chile
Loading live weather...
Climate Analysis & Overview
Punta Arenas, nestled in Chile's southernmost reaches, is experiencing a unique climatic narrative. While the region is witnessing a historical warming trend, the last decade hints at a cooling in daytime temperatures. Precipitation has become more evenly distributed, offering a nuanced shift in local weather patterns.
Oceanic Influence and Climate Classification
Punta Arenas is classified under the Köppen climate system as a Cfc climate, which is a subpolar oceanic climate. This classification is largely due to its proximity to the Strait of Magellan, which moderates temperatures and influences local weather patterns. The oceanic influence is evident in the mild summer highs and relatively cool winters that define the region. This maritime effect is crucial in understanding the area's climatic trends and variations.
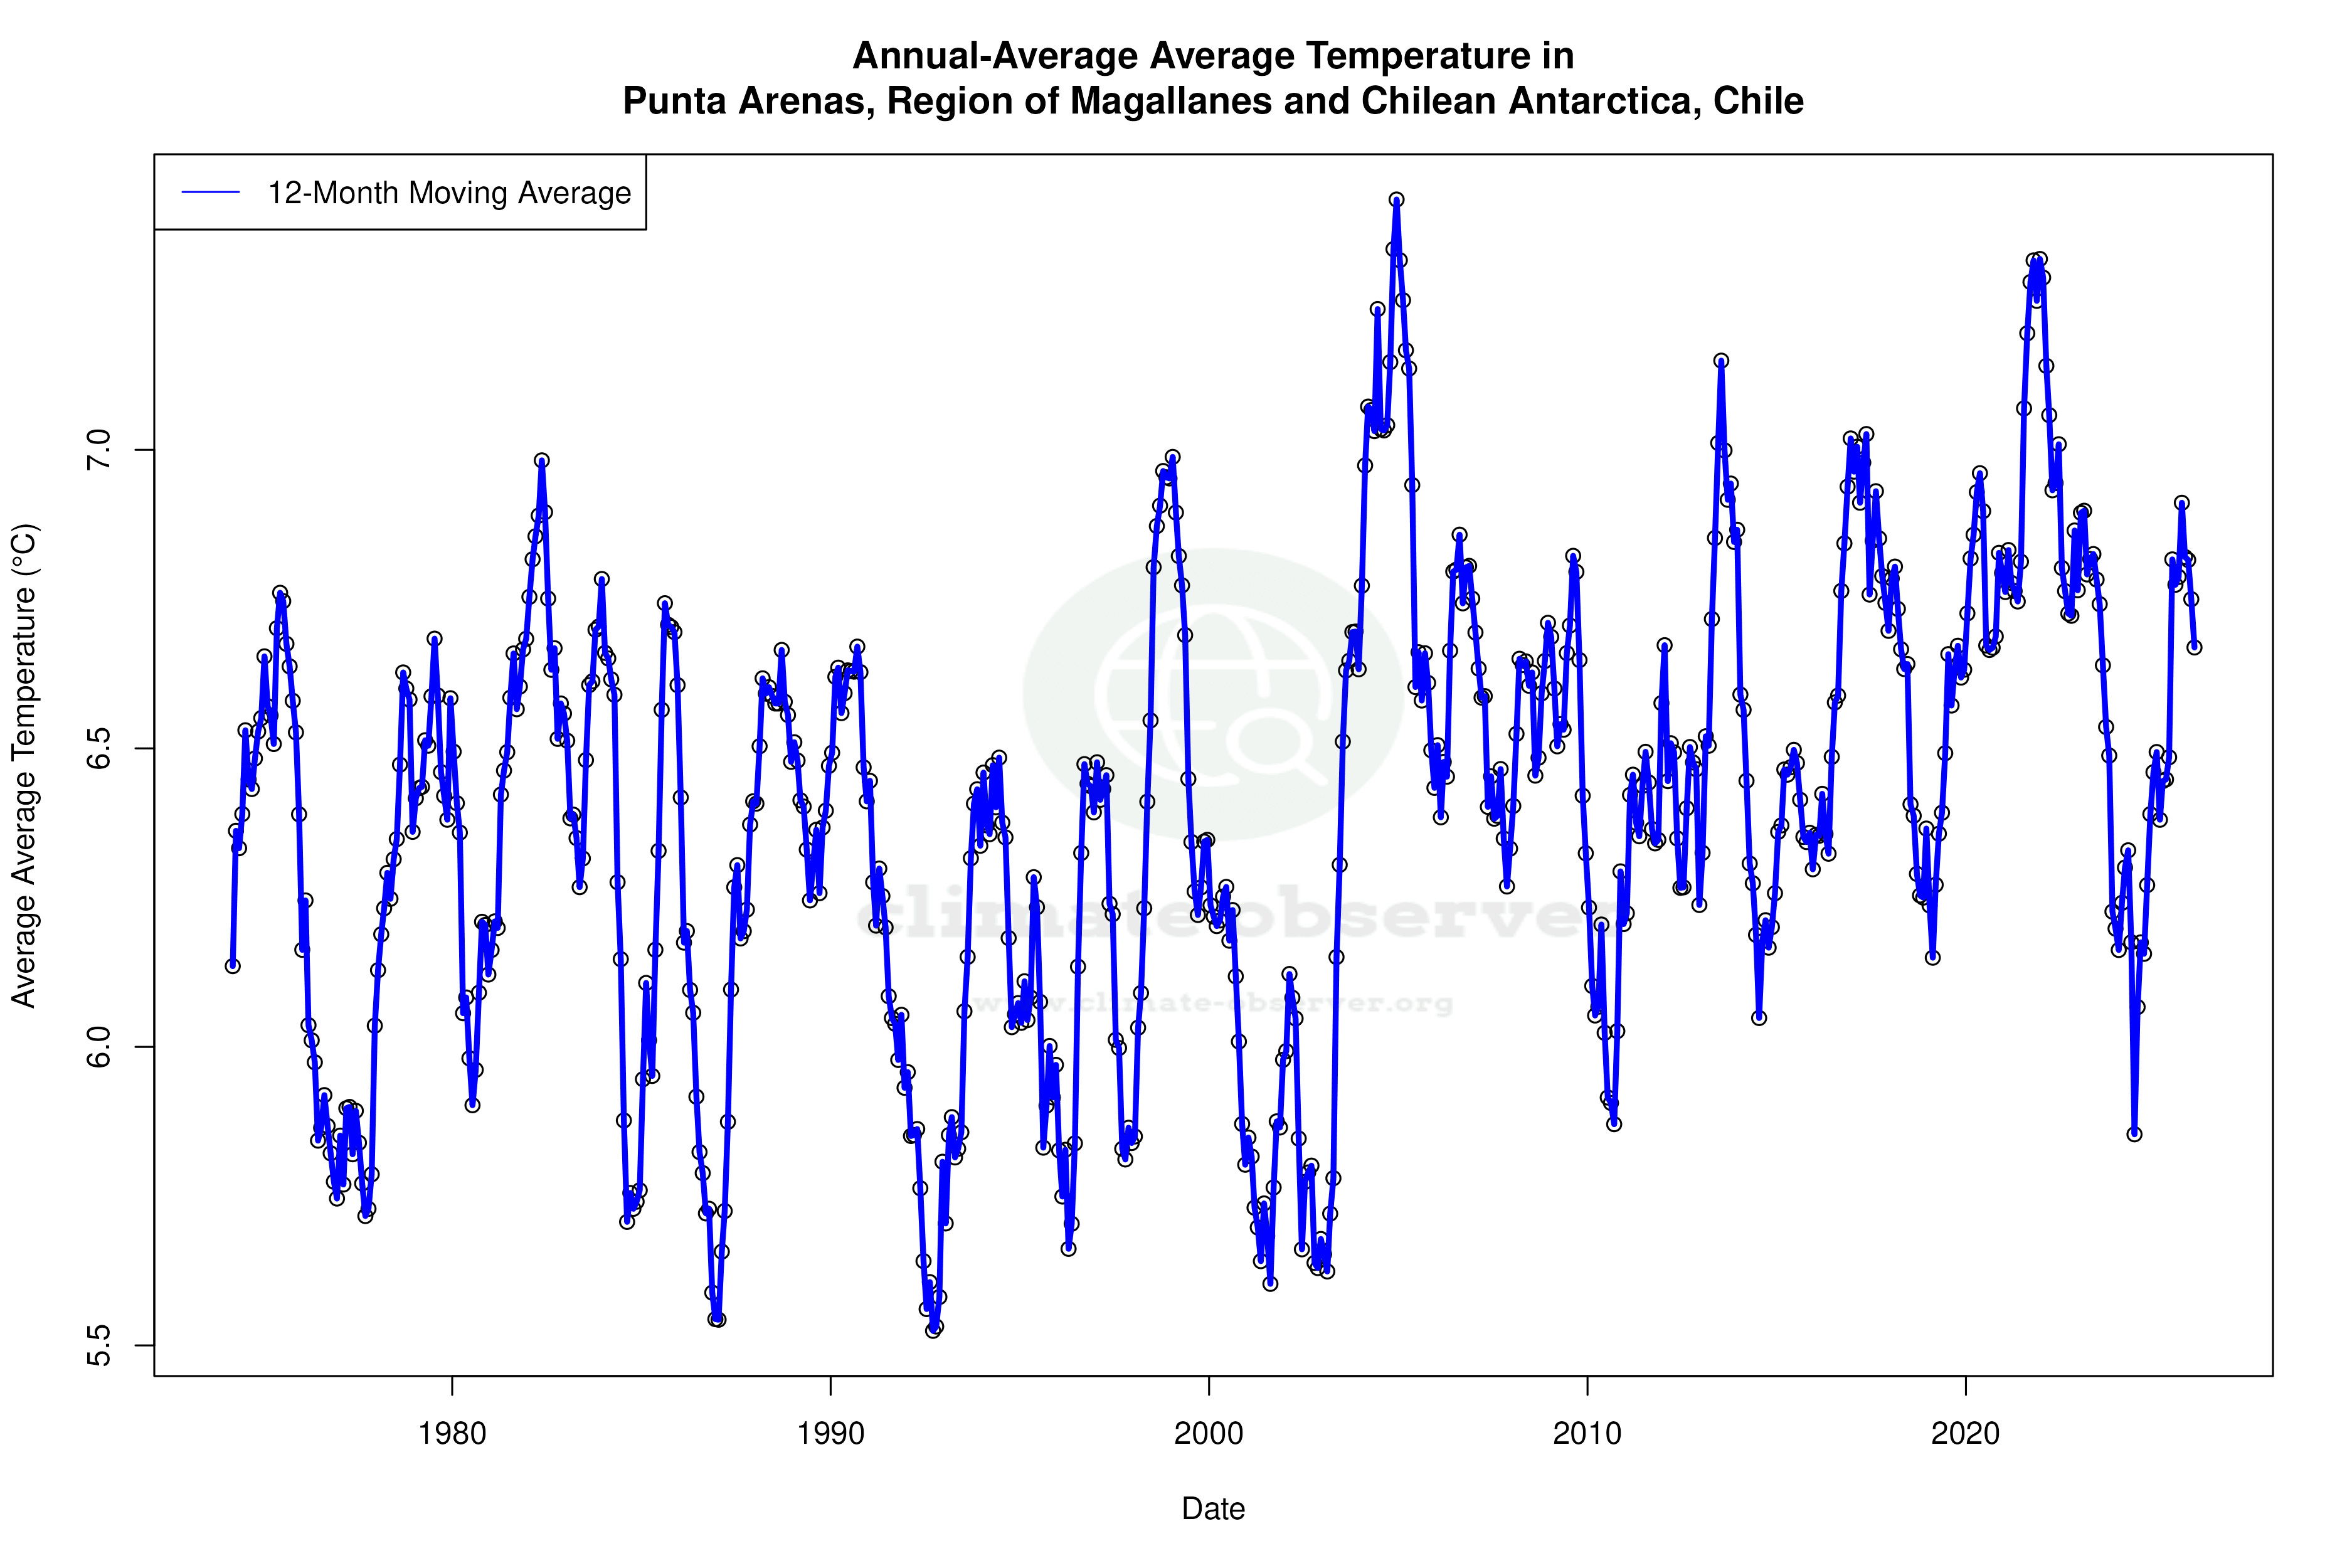
Temperature Trends: A Tale of Two Timelines
Examining the temperature trends in Punta Arenas reveals a fascinating dichotomy. Over the long term, there has been a warming trend, with all-time highs increasing by 0.37°C (0.67°F). Conversely, the last decade has seen a cooling in high temperatures, falling by 0.72°C (1.30°F). This recent cooling trend is an intriguing deviation from the historical warming and suggests a complex interplay of local and regional climatic factors. Meanwhile, low temperatures have shown a slight increase both in the long-term (0.09°C [0.16°F]) and the past decade (0.04°C [0.07°F]), indicating a subtle warming of nighttime conditions.
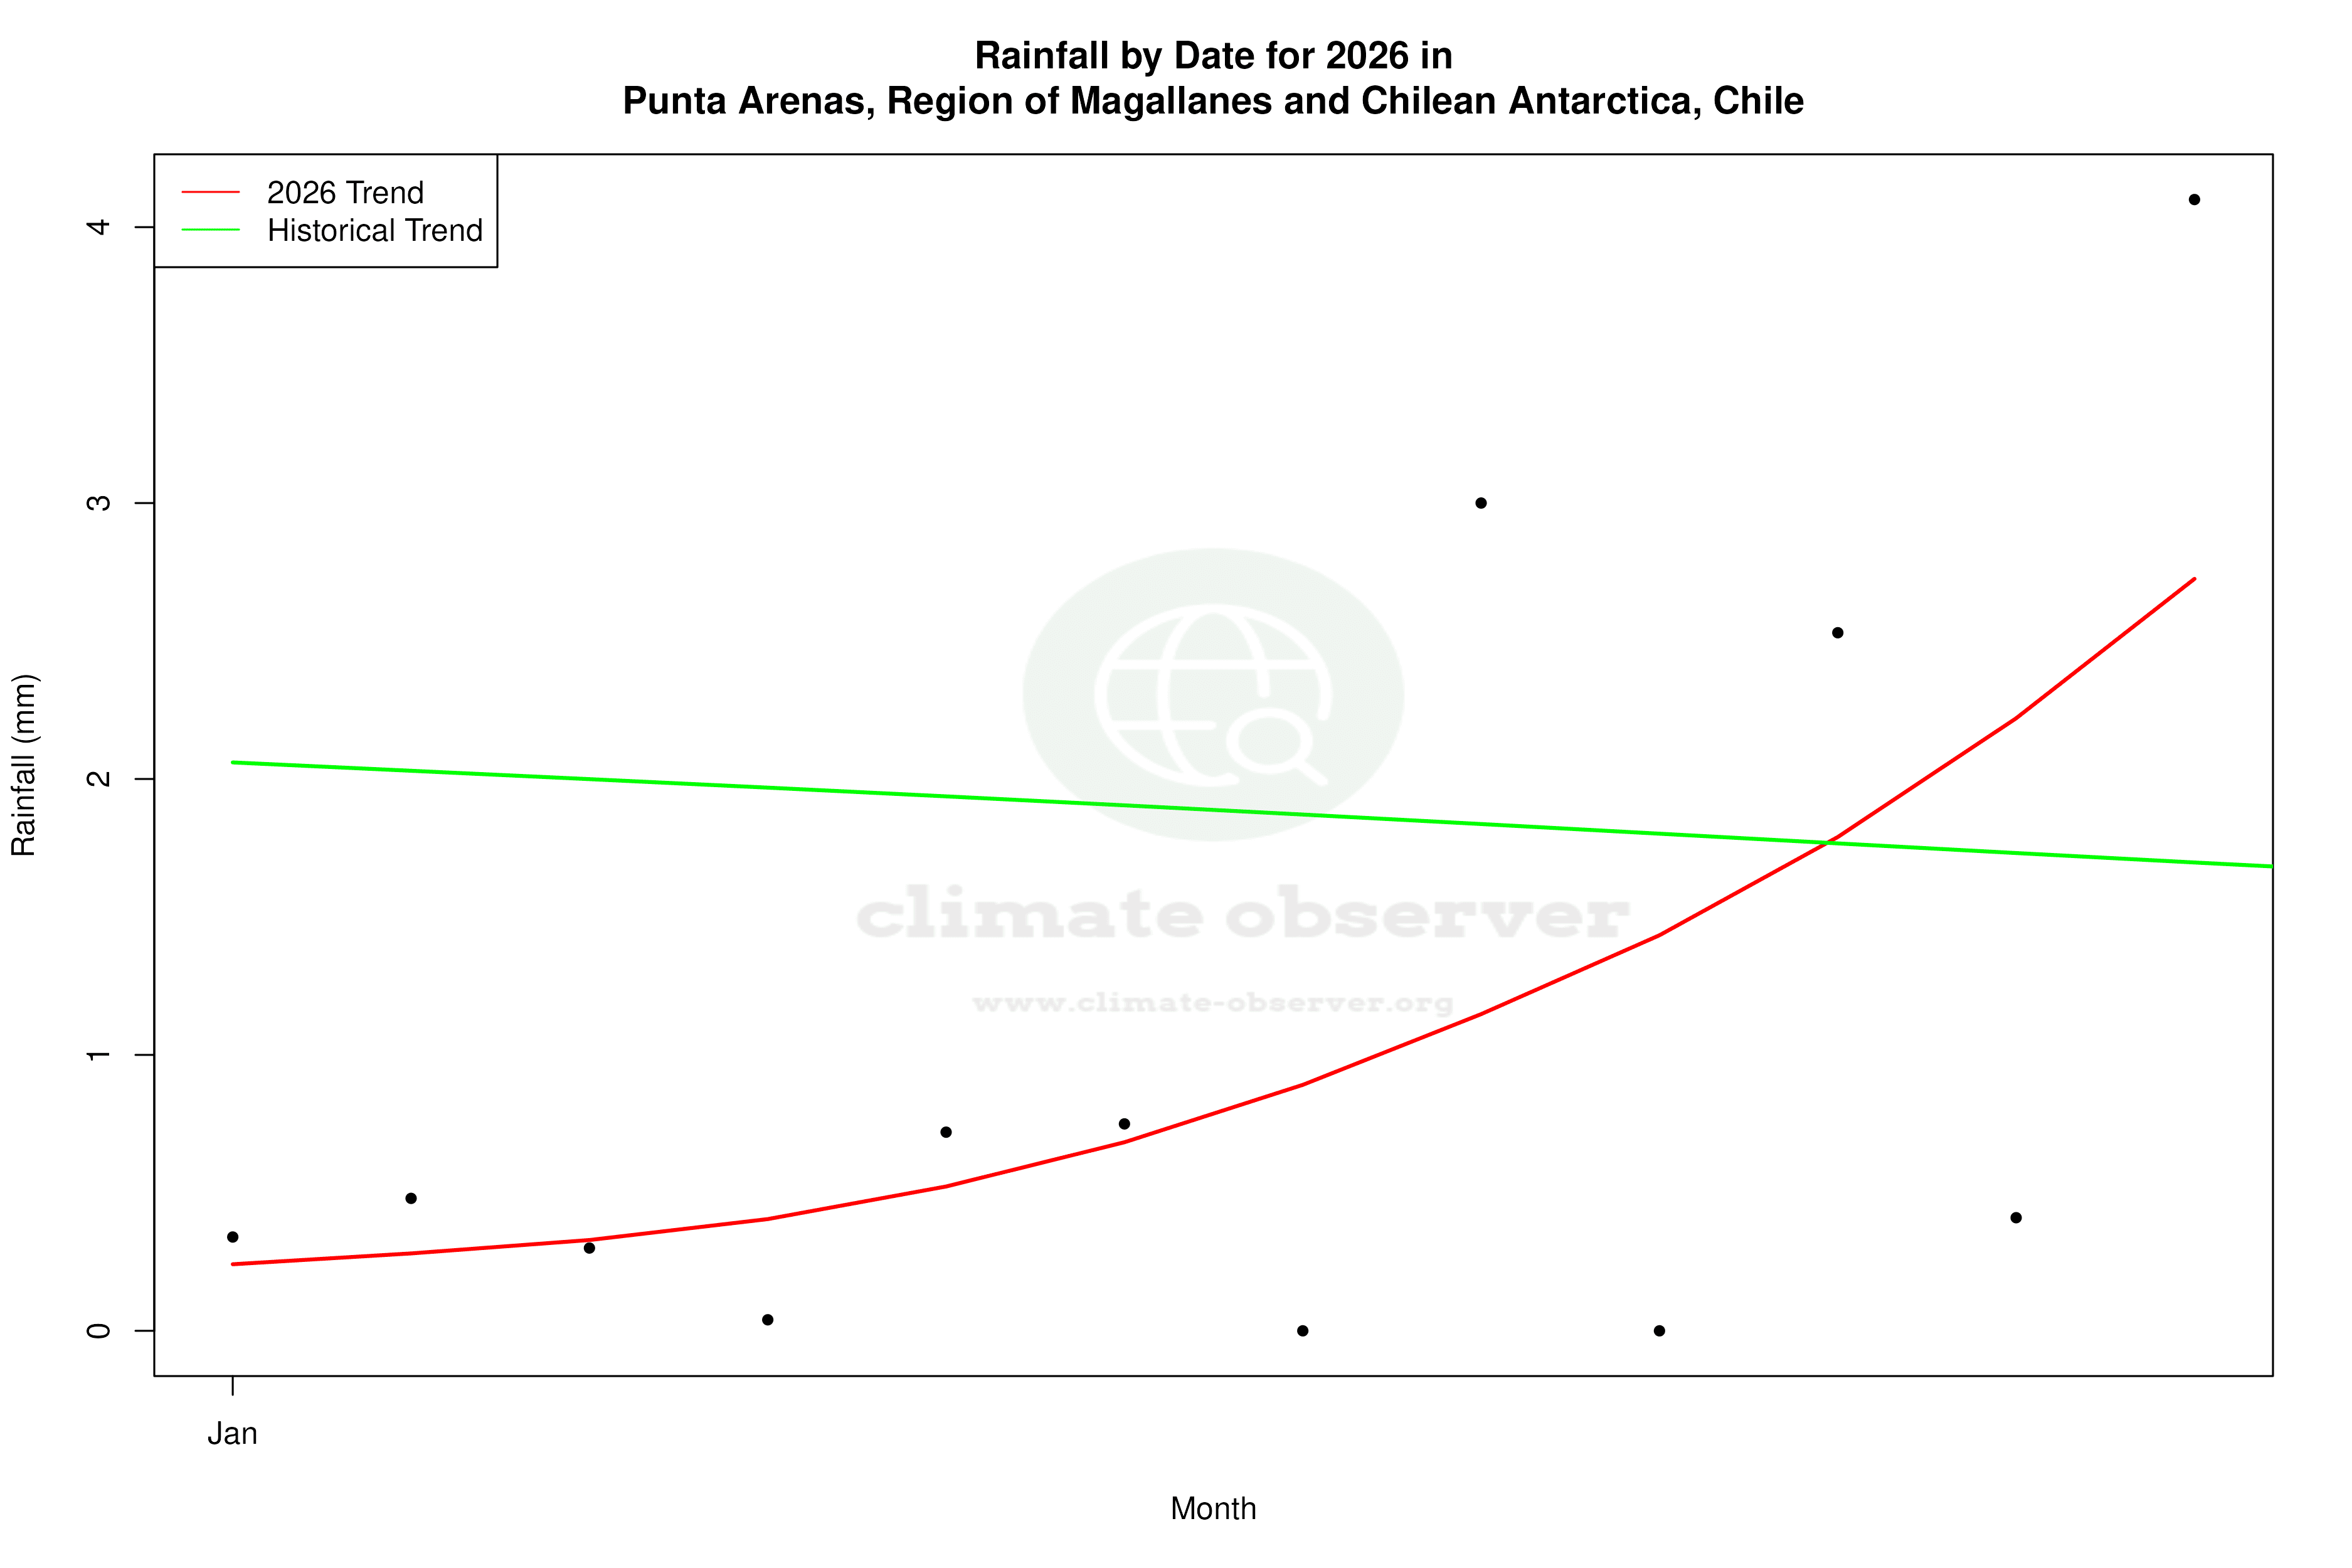
Precipitation Patterns: Towards Even Distribution
The Precipitation Concentration Index (PCI) provides insights into how rainfall is distributed throughout the year. Punta Arenas has seen a decrease in its PCI from a baseline of 10.62 to a current value of 9.71. This marginal change suggests that precipitation is becoming more evenly distributed across the year, reducing the intensity and concentration of rainfall events. Such a shift could have implications for local agriculture and water management, as it may lead to more consistent water availability.
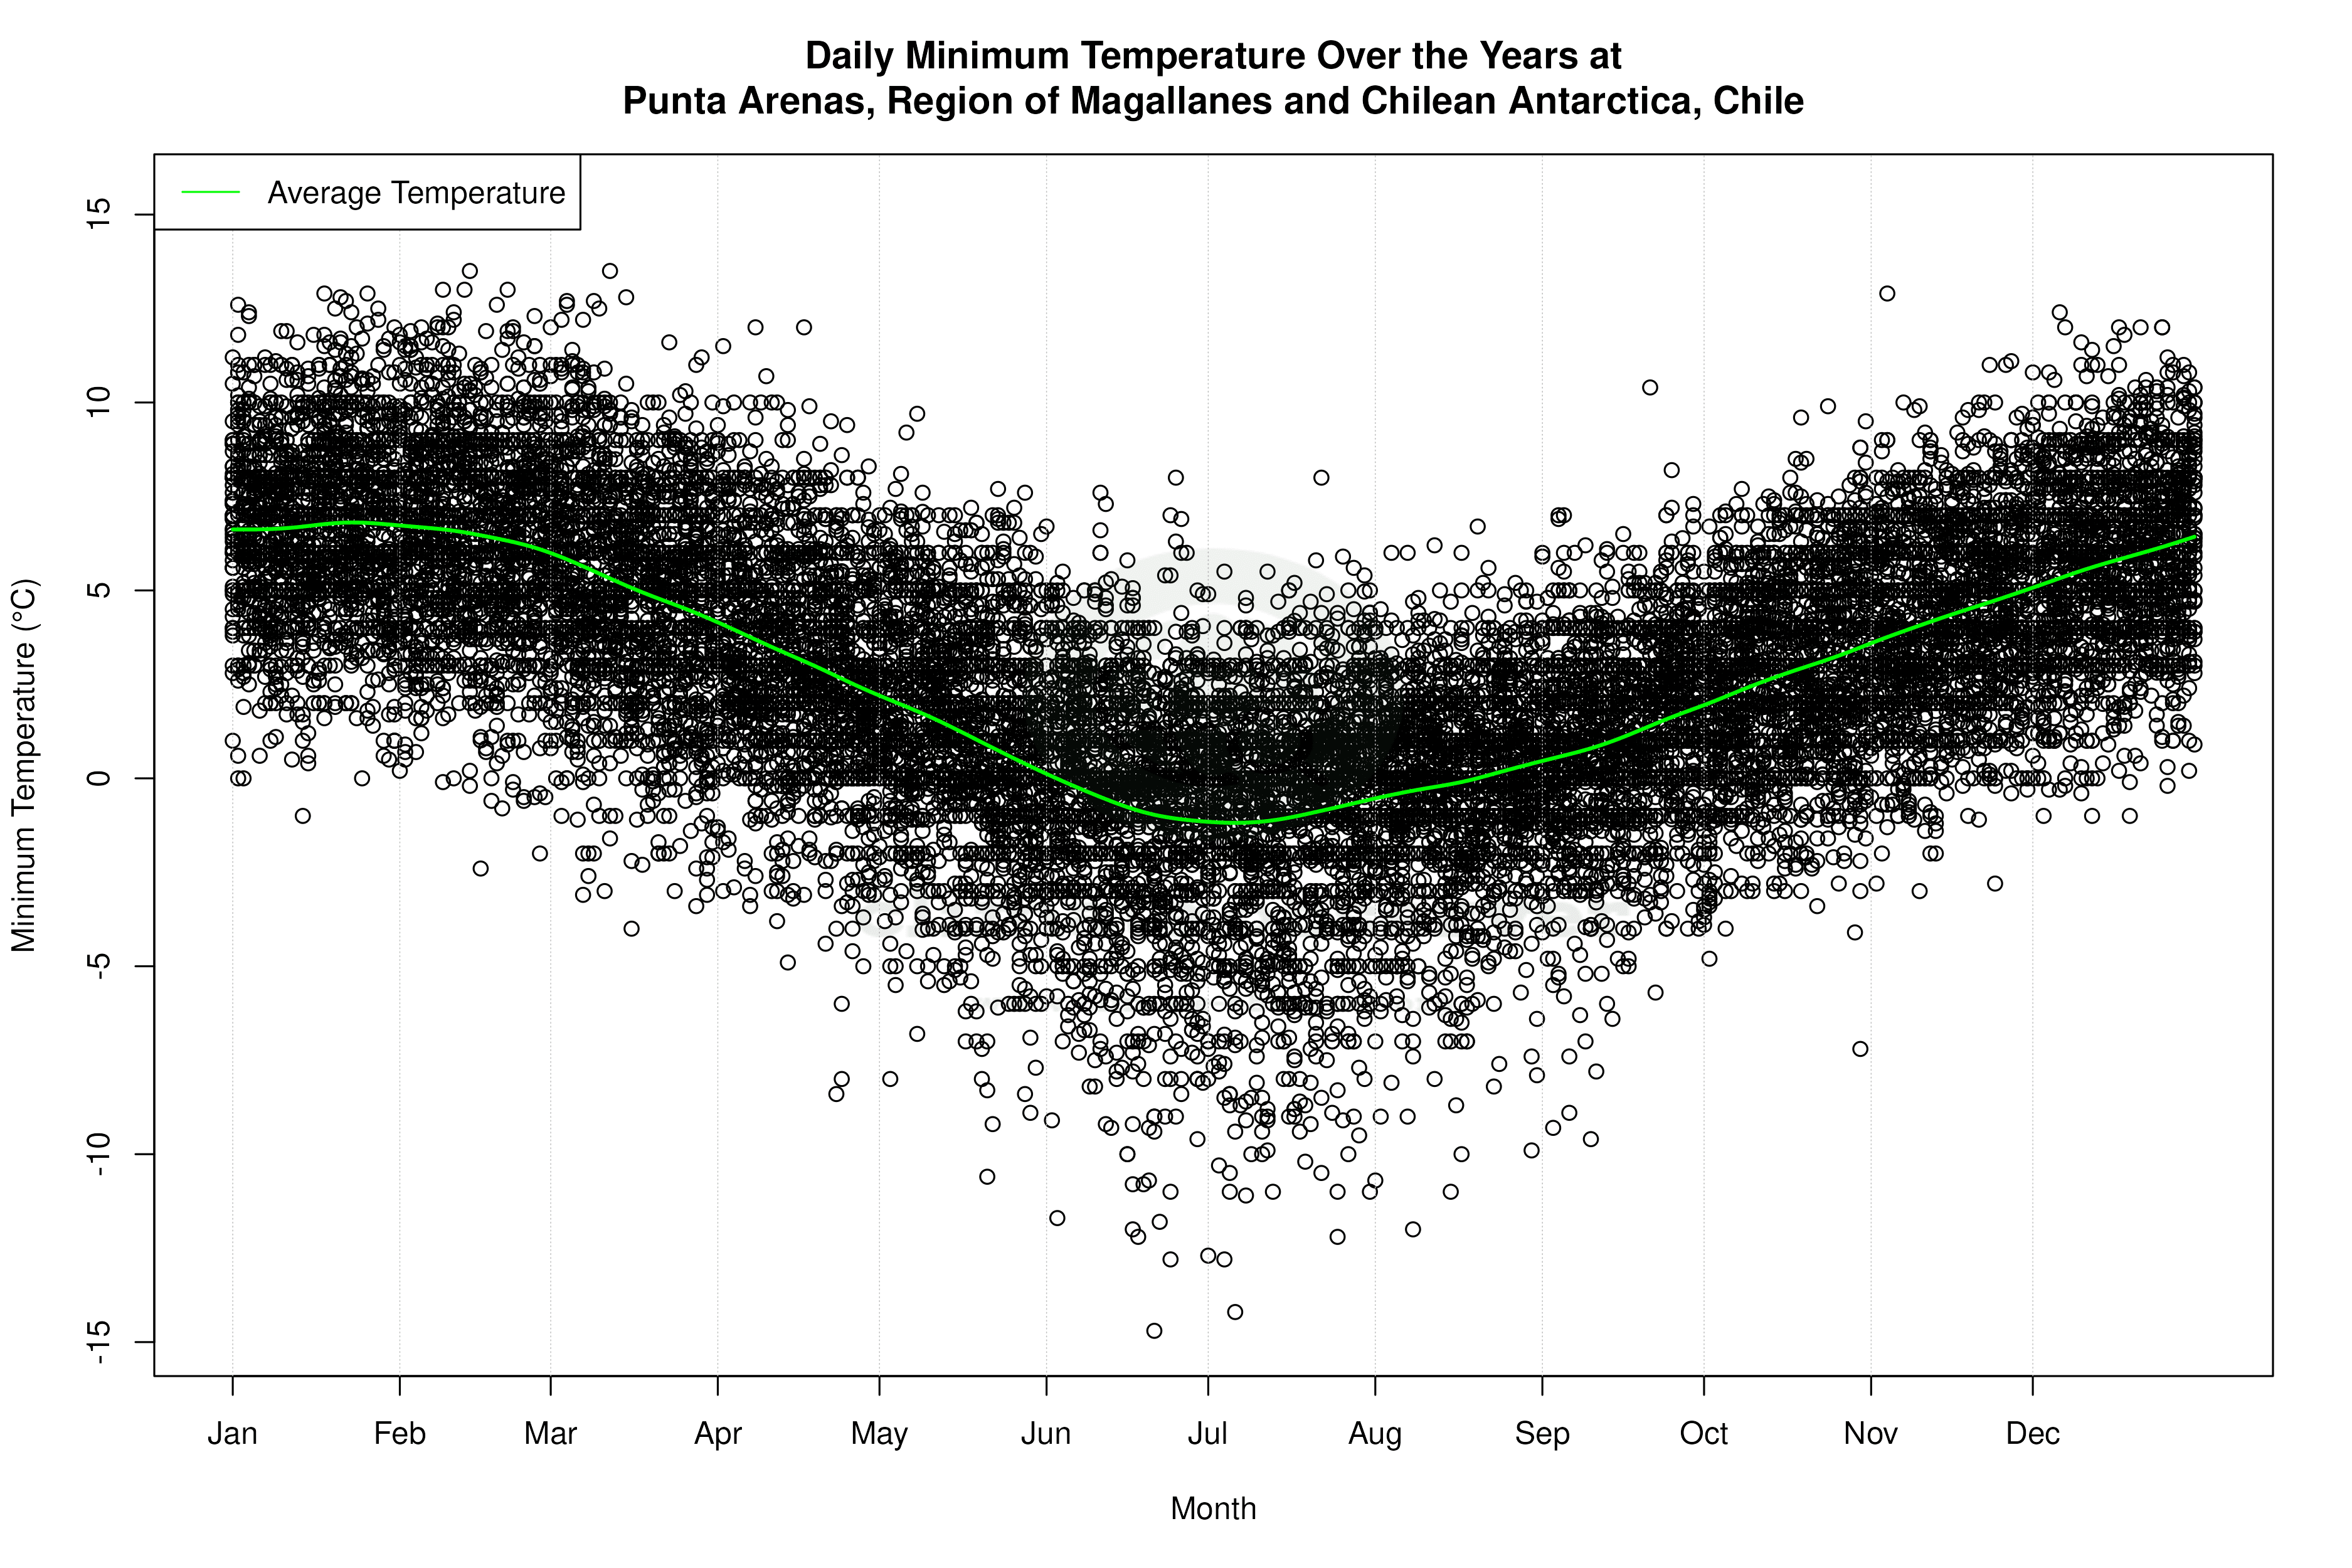
Record Extremes and Regional Implications
Punta Arenas experiences a wide range of temperature extremes, with recorded highs reaching 28.0°C (82.4°F) and lows plummeting to -14.7°C (5.5°F). These extremes highlight the region's vulnerability to sudden weather changes, which can impact local ecosystems and human activities. In the context of Chile's regional climate goals, understanding these extremes is vital for developing adaptive strategies to mitigate potential impacts on infrastructure and livelihoods.
Navigating the Climatic Future
As Punta Arenas navigates its climatic future, the interplay between historical warming and recent cooling trends will be crucial to monitor. The even distribution of precipitation could offer some respite from extreme weather events, yet the potential for sudden temperature fluctuations remains a concern. With regional climate goals focusing on sustainability and resilience, Punta Arenas stands at a crossroads, balancing its unique climatic identity with the broader challenges posed by a changing global climate.
Station Statistics
10-Year Trend
High: -0.88 °F/decade
Low: +0.37 °F/decade
Rain: +0.022 in/decade
25-Year Trend
High: +0.49 °F/decade
Low: +0.42 °F/decade
Rain: -0.007 in/decade
50-Year Trend
High: +0.70 °F/decade
Low: +0.17 °F/decade
Rain: -0.001 in/decade
All-Time Trend
High: +0.70 °F/decade
Low: +0.17 °F/decade
Rain: -0.001 in/decade
Percentage Above-Average Days
Last 12 Months: 45.0%
This Year: 27.7%
Precipitation Concentration Index (PCI) ℹ️
Last 12 Months: 10.3
Historical Average: 10.6
Percentile Rank of Last 12 Months ℹ️
High: 55th percentile
Low: 79th percentile
Rain: 78th percentile
Change in Variance ℹ️
High: +1.1%
Low: +8.4%
Intraday: -5.0%
Data Coverage
83.1%
First Year of Data
1963
Station Location
Historical Weather Records
| Max High | Avg High | Min High | Max Avg | Avg Avg | Min Avg | Max Low | Avg Low | Min Low | Max Precipitation | Avg Precipitation | Max Snow | Avg Snow | |
|---|---|---|---|---|---|---|---|---|---|---|---|---|---|
| Record | 82.40 °F | — | 23.25 °F | 71.96 °F | — | 12.92 °F | 59.72 °F | — | 5.54 °F | 2.01 in | — | — | — |
| January | 77.00 °F | 59.59 °F | 44.87 °F | 71.96 °F | 51.35 °F | 41.36 °F | 57.20 °F | 44.09 °F | 21.74 °F | 2.01 in | 0.07 in | — | — |
| February | 82.40 °F | 59.17 °F | 45.54 °F | 65.84 °F | 50.85 °F | 39.85 °F | 59.72 °F | 43.73 °F | 27.68 °F | 2.01 in | 0.06 in | — | — |
| March | 78.80 °F | 55.88 °F | 42.03 °F | 64.94 °F | 48.02 °F | 35.06 °F | 56.30 °F | 41.16 °F | 24.80 °F | 2.01 in | 0.07 in | — | — |
| April | 72.50 °F | 50.84 °F | 38.66 °F | 59.36 °F | 43.88 °F | 25.16 °F | 53.60 °F | 37.79 °F | 16.88 °F | 2.01 in | 0.07 in | — | — |
| May | 60.80 °F | 45.00 °F | 29.66 °F | 57.20 °F | 39.54 °F | 22.82 °F | 49.46 °F | 34.30 °F | 12.92 °F | 2.01 in | 0.06 in | — | — |
| June | 60.80 °F | 40.58 °F | 26.24 °F | 50.72 °F | 35.57 °F | 12.92 °F | 46.40 °F | 30.83 °F | 5.54 °F | 2.01 in | 0.05 in | — | — |
| July | 53.60 °F | 40.09 °F | 23.25 °F | 49.82 °F | 35.02 °F | 17.96 °F | 46.40 °F | 30.22 °F | 6.44 °F | 2.01 in | 0.07 in | — | — |
| August | 57.20 °F | 42.86 °F | 29.03 °F | 49.10 °F | 36.93 °F | 21.56 °F | 44.06 °F | 31.85 °F | 10.40 °F | 2.01 in | 0.07 in | — | — |
| September | 66.20 °F | 47.23 °F | 33.66 °F | 54.50 °F | 40.22 °F | 25.16 °F | 50.72 °F | 34.09 °F | 14.72 °F | 2.01 in | 0.06 in | — | — |
| October | 74.30 °F | 51.88 °F | 37.40 °F | 55.58 °F | 43.89 °F | 31.28 °F | 49.82 °F | 36.85 °F | 19.04 °F | 2.01 in | 0.05 in | — | — |
| November | 76.82 °F | 55.37 °F | 42.80 °F | 60.26 °F | 47.10 °F | 35.78 °F | 55.22 °F | 39.82 °F | 26.60 °F | 2.01 in | 0.06 in | — | — |
| December | 80.60 °F | 57.80 °F | 44.15 °F | 62.24 °F | 49.60 °F | 39.38 °F | 54.32 °F | 42.36 °F | 30.20 °F | 2.01 in | 0.06 in | — | — |
Data Visualisations
Remove WatermarksCurrent Year Climate Trends vs Historical


Max Temperature this Year | 1 of 6
Climate 12-Month Moving Averages


Max Temperature 12-Month MA | 1 of 6
Daily Data Points and Averages Throughout the Year


Average Max Temperature Throughout Year | 1 of 5
