Climate for Station: Arturo Merino Benitez Intl, Region Metropolitana de Santiago, Chile
Loading live weather...
Climate Analysis & Overview
Arturo Merino Benitez International Airport is experiencing a complex climate narrative. While long-term data indicates a warming trend, recent years have shown a cooling in high temperatures. Additionally, precipitation events have become significantly more concentrated, posing challenges for the region's climate resilience efforts.
Climate Classification and Geographic Influences
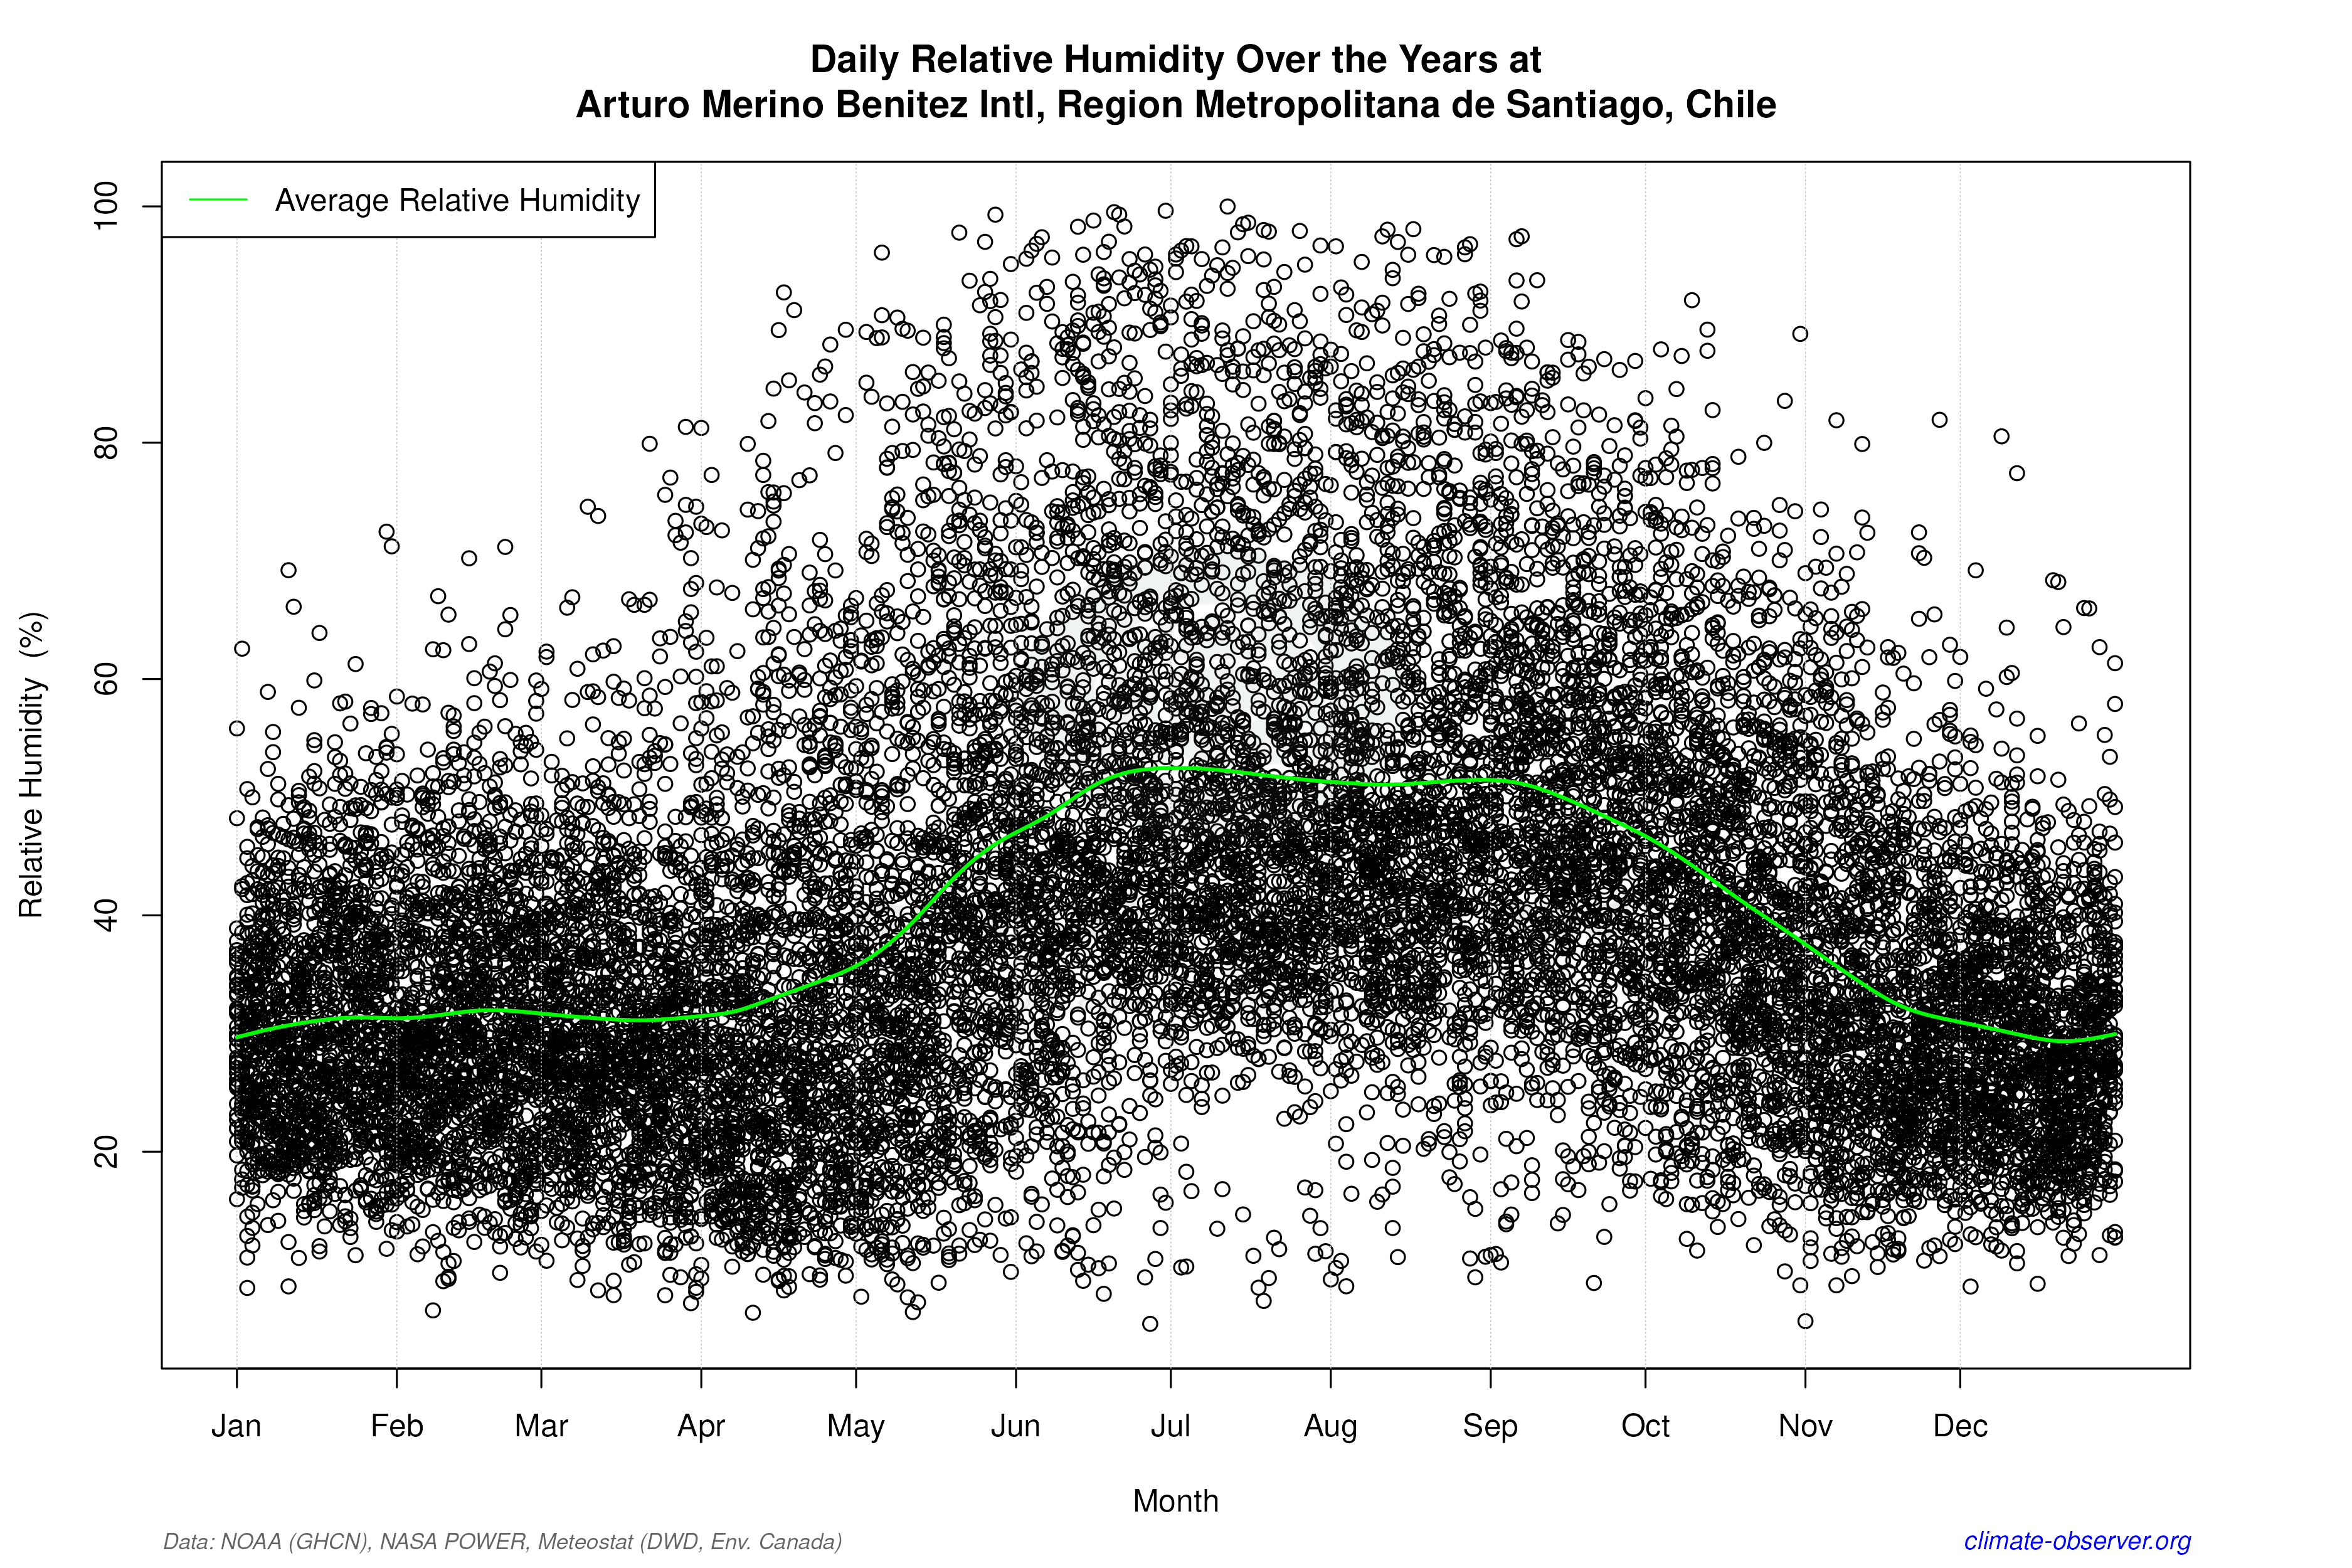
Arturo Merino Benitez International Airport, located in Santiago, Chile, falls under the Mediterranean climate classification (Köppen Csb), characterised by hot, dry summers and mild, wet winters. The Andes Mountains to the east and the Pacific Ocean to the west significantly influence this climate, creating a rain shadow effect that limits precipitation in the region. This geographical setup plays a crucial role in the observed climate trends at the airport.
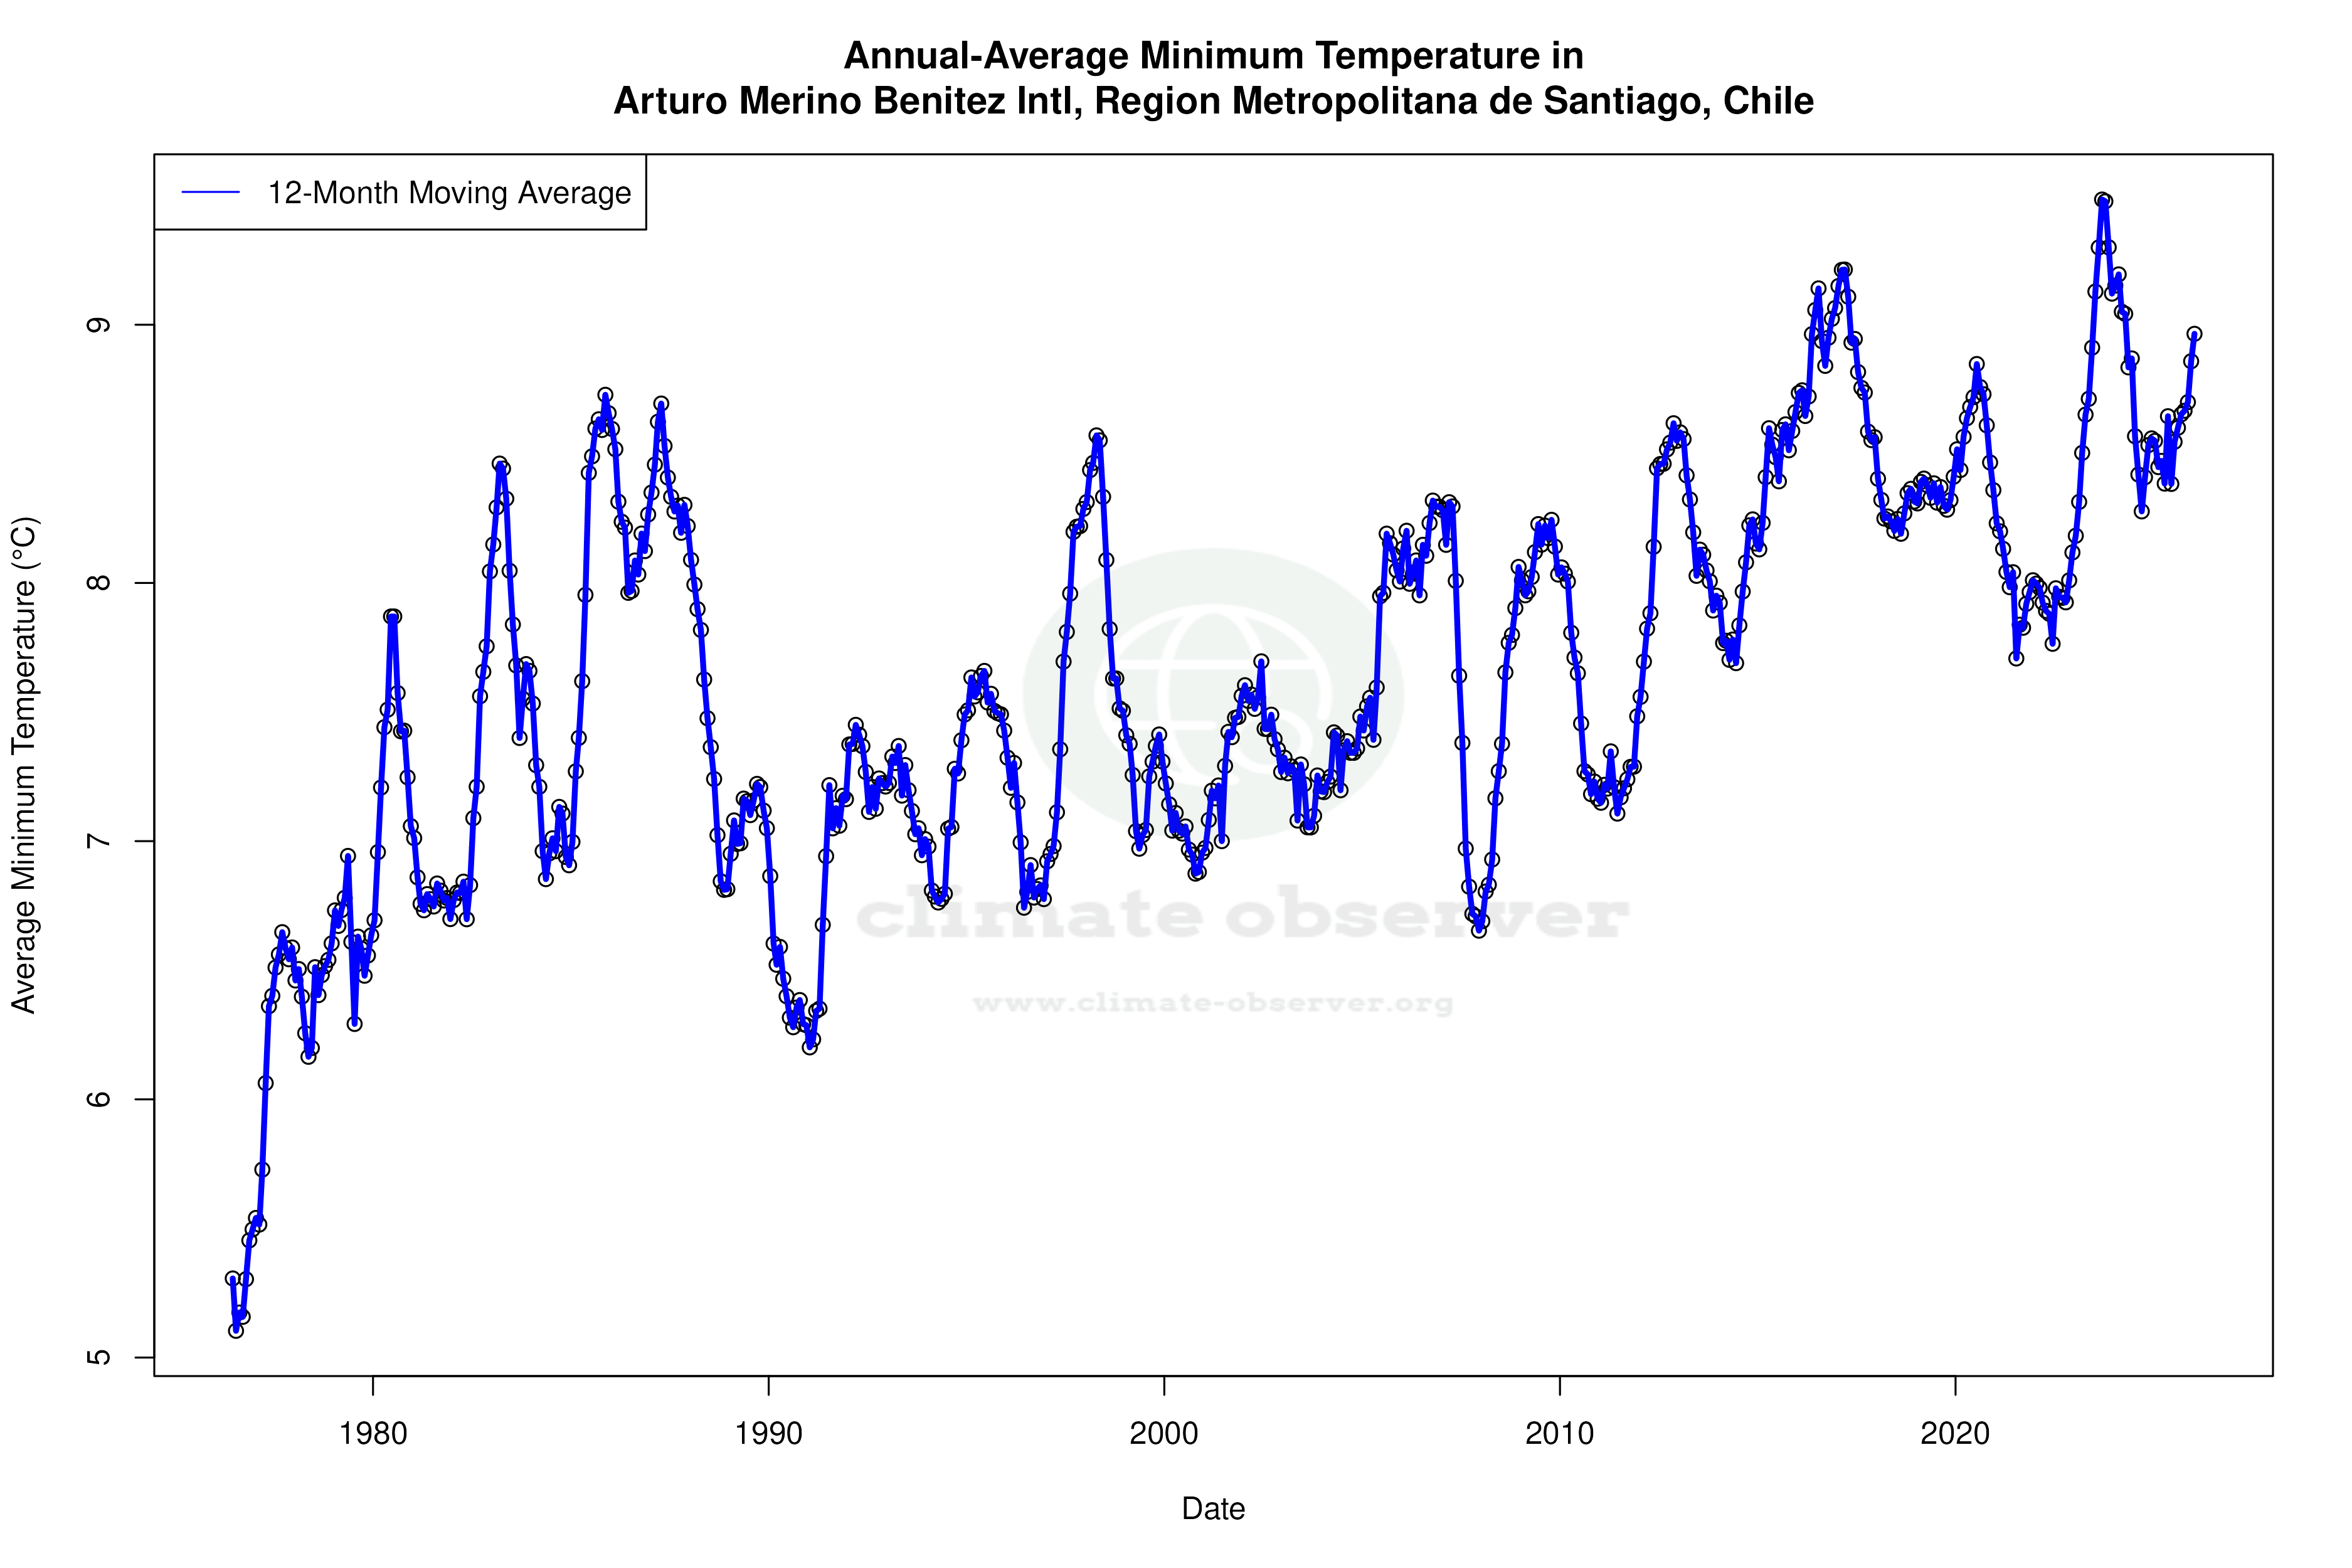
Long-term Warming Trends
Over the all-time record, there has been a warming trend in both high and low temperatures. Highs have increased by 0.32°C (0.58°F), while lows have risen by 0.37°C (0.67°F). This warming aligns with global climate patterns and Chile's national climate goals, which aim to mitigate the impacts of rising temperatures. The increase in minimum temperatures suggests a reduction in the frequency of extremely cold nights, which can have implications for local agriculture and energy consumption.
Recent Cooling Anomalies
Contrasting the long-term warming, the past decade has shown a cooling trend in high temperatures, with a decrease of 0.55°C (0.99°F). This anomaly could be attributed to various factors, including natural climate variability or regional atmospheric changes. Meanwhile, low temperatures have shown a marginal decline of 0.08°C (0.14°F), indicating a slight cooling trend. These recent patterns underscore the complexity of climate dynamics in the region and highlight the importance of continuous monitoring.
Precipitation Patterns and Challenges
The Precipitation Concentration Index (PCI) has increased from a baseline of 21.0 to 26.2, indicating a significant shift towards more concentrated precipitation events. A PCI over 20 suggests that rainfall is becoming less frequent but more intense, which can lead to challenges such as increased risk of flooding and water management issues. This change in precipitation patterns necessitates adaptive strategies to enhance the region's resilience to extreme weather events.
Implications for Regional Climate Goals
Chile's commitment to reducing greenhouse gas emissions and adapting to climate change is set against the backdrop of these climatic shifts. The observed trends at Arturo Merino Benitez International Airport provide valuable insights into the broader regional climate dynamics. As the country seeks to balance economic growth with environmental sustainability, understanding these localised climate patterns will be crucial for informed decision-making and policy development.
Station Statistics
10-Year Trend
High: -0.95 °F/decade
Low: +0.09 °F/decade
Rain: +0.016 in/decade
25-Year Trend
High: +0.80 °F/decade
Low: +1.10 °F/decade
Rain: -0.008 in/decade
50-Year Trend
High: +0.64 °F/decade
Low: +0.62 °F/decade
Rain: -0.003 in/decade
All-Time Trend
High: +0.64 °F/decade
Low: +0.62 °F/decade
Rain: -0.003 in/decade
Percentage Above-Average Days
Last 12 Months: 55.2%
This Year: 50.0%
Precipitation Concentration Index (PCI) ℹ️
Last 12 Months: 20.2
Historical Average: 27.3
Percentile Rank of Last 12 Months ℹ️
High: 50th percentile
Low: 84th percentile
Rain: 73rd percentile
Change in Variance ℹ️
High: +0.7%
Low: +16.4%
Intraday: -15.6%
Data Coverage
85.3%
First Year of Data
1964
Station Location
Historical Weather Records
| Max High | Avg High | Min High | Max Avg | Avg Avg | Min Avg | Max Low | Avg Low | Min Low | Max Precipitation | Avg Precipitation | Max Snow | Avg Snow | |
|---|---|---|---|---|---|---|---|---|---|---|---|---|---|
| Record | 102.74 °F | — | 33.62 °F | 82.94 °F | — | 35.42 °F | 67.80 °F | — | 19.65 °F | 12.28 in | — | — | — |
| January | 102.74 °F | 86.88 °F | 66.25 °F | 82.94 °F | 70.20 °F | 57.38 °F | 66.20 °F | 54.82 °F | 41.72 °F | 2.01 in | 0.01 in | — | — |
| February | 100.04 °F | 86.13 °F | 66.02 °F | 81.68 °F | 69.01 °F | 54.86 °F | 67.10 °F | 54.06 °F | 41.00 °F | 12.28 in | 0.03 in | — | — |
| March | 98.24 °F | 82.86 °F | 50.20 °F | 80.06 °F | 65.36 °F | 50.68 °F | 67.80 °F | 50.80 °F | 32.00 °F | 12.01 in | 0.01 in | — | — |
| April | 94.10 °F | 75.53 °F | 54.68 °F | 75.74 °F | 58.69 °F | 41.90 °F | 60.57 °F | 45.79 °F | 28.94 °F | 2.01 in | 0.02 in | — | — |
| May | 87.80 °F | 67.63 °F | 43.18 °F | 70.16 °F | 52.57 °F | 38.48 °F | 57.72 °F | 41.32 °F | 21.38 °F | 2.01 in | 0.06 in | — | — |
| June | 81.27 °F | 61.93 °F | 33.62 °F | 63.86 °F | 48.12 °F | 35.42 °F | 56.30 °F | 38.14 °F | 20.84 °F | 3.78 in | 0.11 in | — | — |
| July | 95.00 °F | 61.08 °F | 35.26 °F | 59.54 °F | 47.15 °F | 35.42 °F | 53.96 °F | 36.91 °F | 19.65 °F | 2.76 in | 0.07 in | — | — |
| August | 84.74 °F | 64.00 °F | 37.89 °F | 64.76 °F | 49.64 °F | 36.32 °F | 54.30 °F | 38.80 °F | 20.84 °F | 2.01 in | 0.06 in | — | — |
| September | 89.60 °F | 68.02 °F | 46.18 °F | 67.28 °F | 53.44 °F | 38.12 °F | 58.32 °F | 41.72 °F | 23.00 °F | 2.01 in | 0.03 in | — | — |
| October | 92.12 °F | 74.10 °F | 50.43 °F | 79.88 °F | 58.44 °F | 39.56 °F | 59.90 °F | 45.42 °F | 26.60 °F | 2.01 in | 0.02 in | — | — |
| November | 95.36 °F | 79.92 °F | 59.00 °F | 79.16 °F | 63.46 °F | 48.38 °F | 62.42 °F | 49.14 °F | 34.88 °F | 2.01 in | 0.02 in | — | — |
| December | 100.40 °F | 84.56 °F | 62.60 °F | 80.06 °F | 67.73 °F | 48.92 °F | 65.43 °F | 52.64 °F | 37.94 °F | 2.09 in | 0.01 in | — | — |
Data Visualisations
Remove WatermarksCurrent Year Climate Trends vs Historical


Max Temperature this Year | 1 of 6
Climate 12-Month Moving Averages


Max Temperature 12-Month MA | 1 of 6
Daily Data Points and Averages Throughout the Year

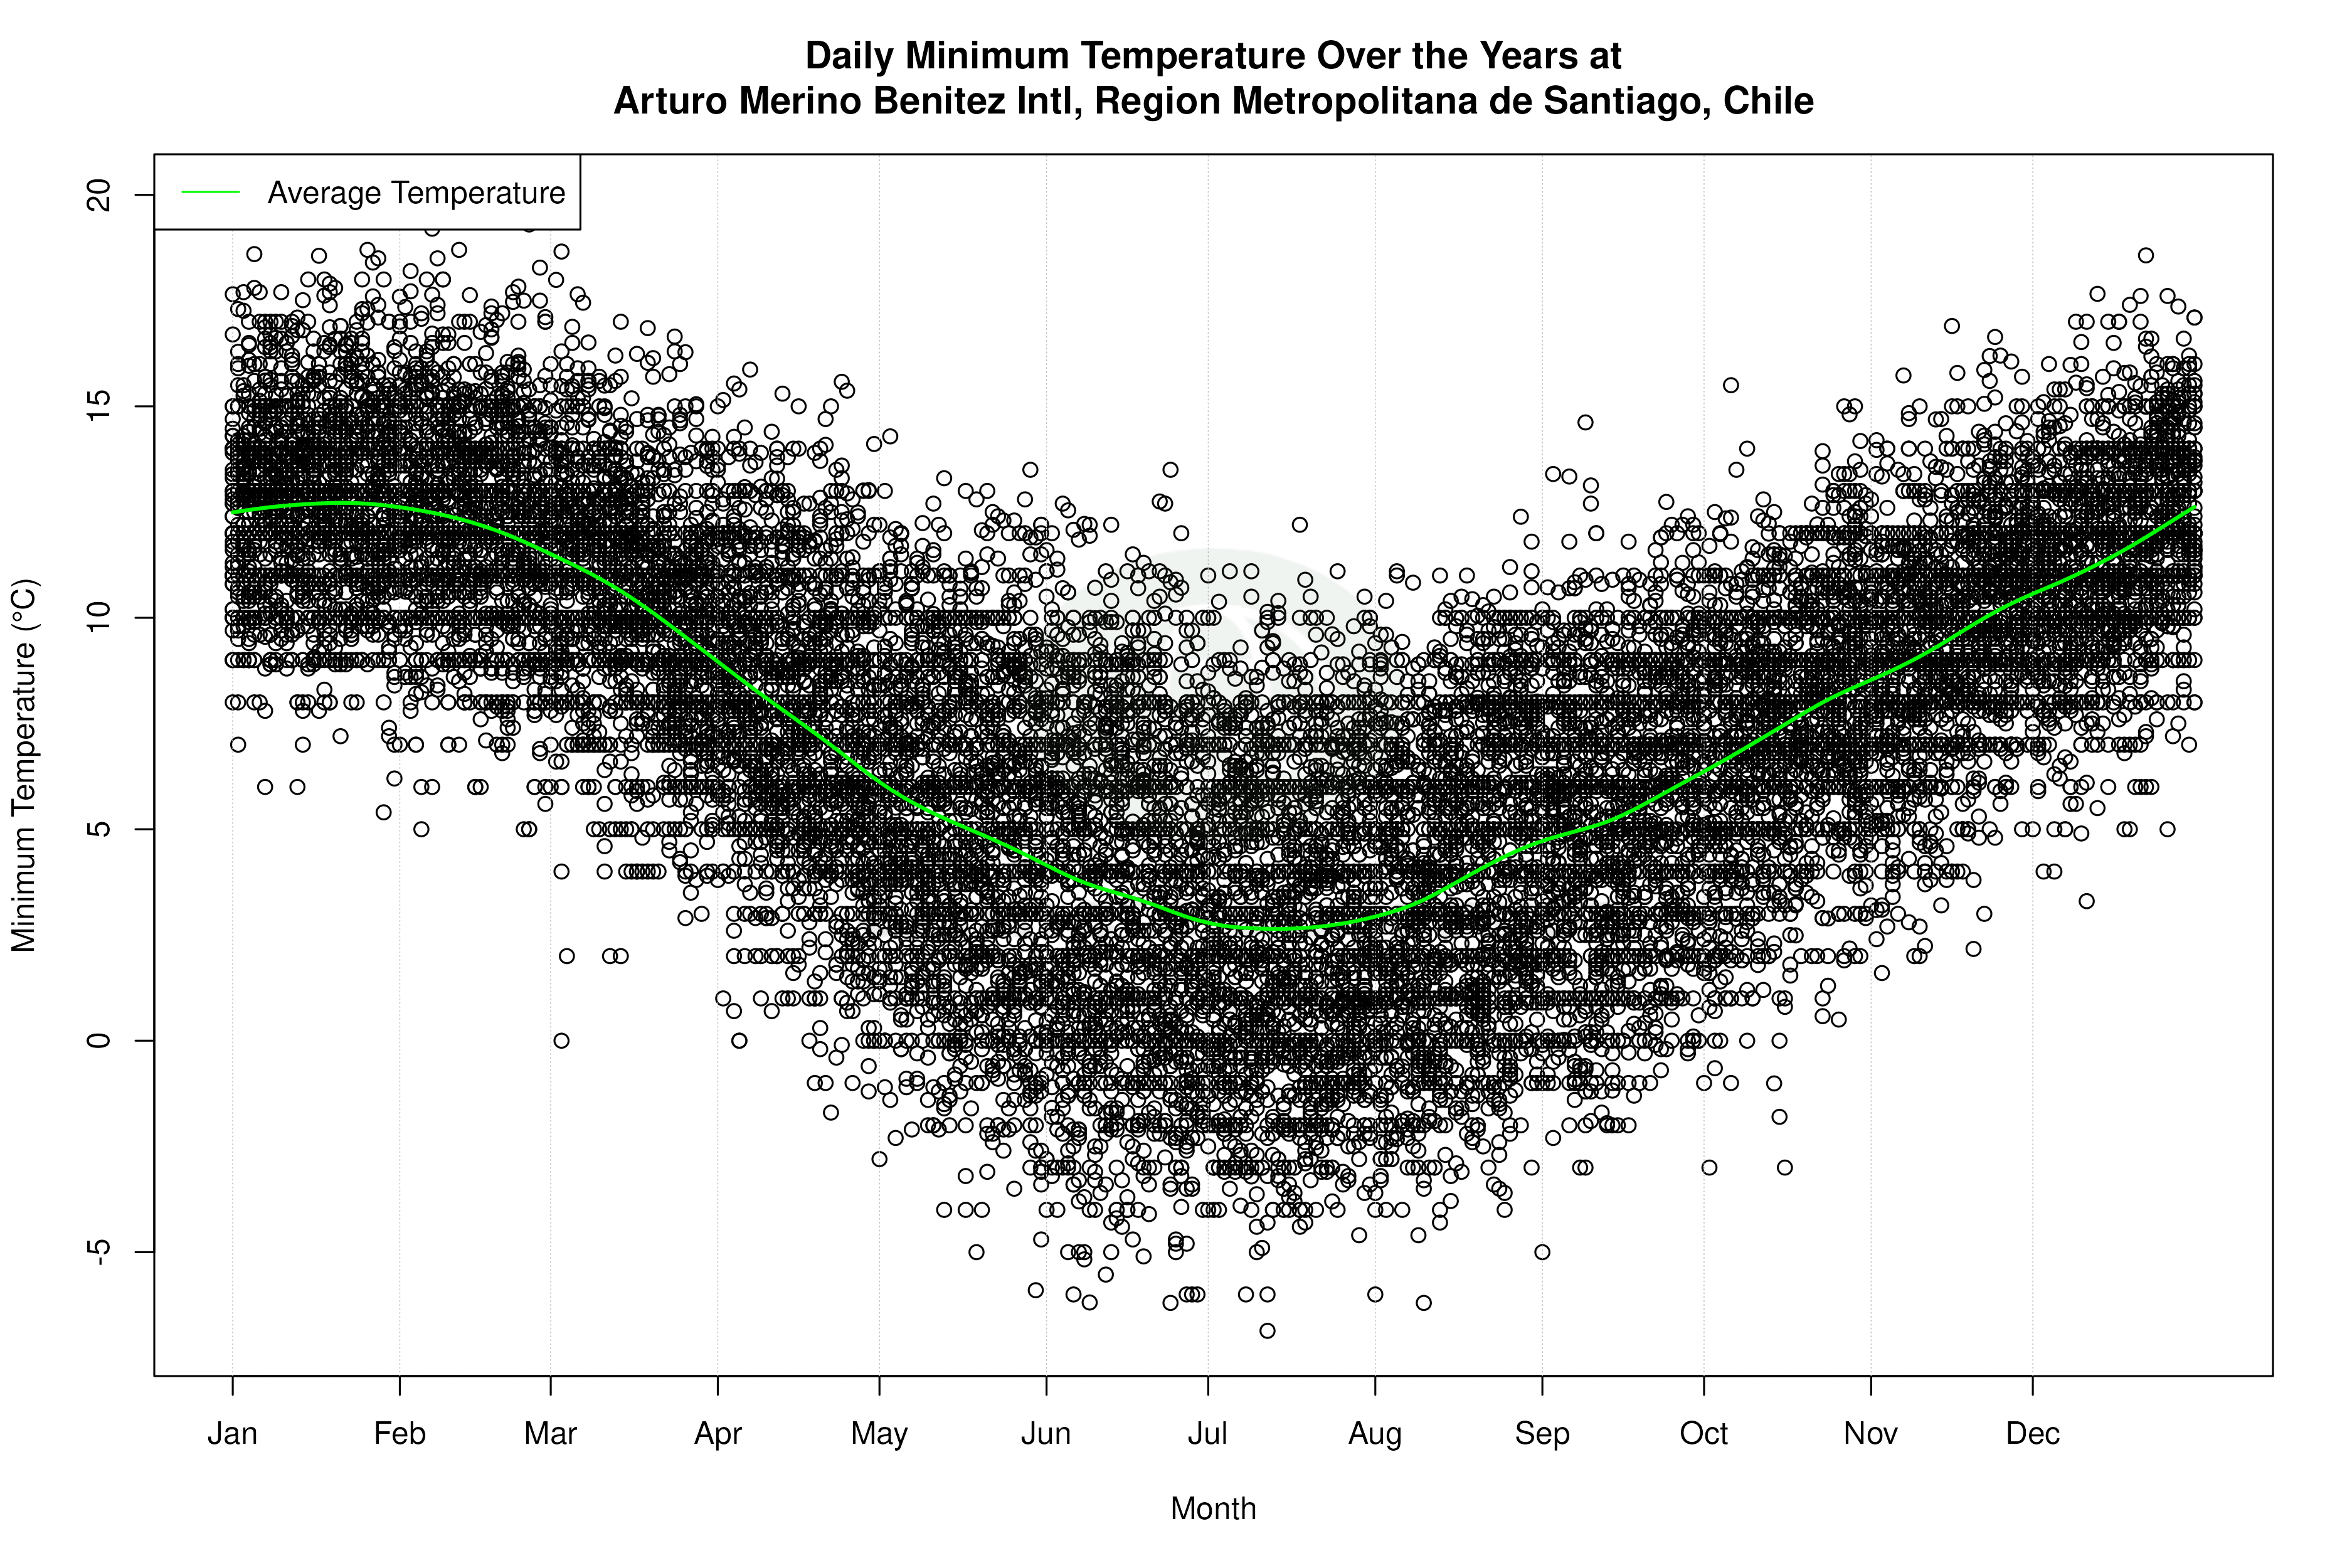


Average Max Temperature Throughout Year | 1 of 5
