Climate for Station: Carriel Sur Intl, Region of Biobío, Chile
Loading live weather...
Climate Analysis & Overview
Over the past decade, Carriel Sur International Airport has experienced a notable cooling trend in high temperatures, juxtaposed with a slight warming of lows. This shift, alongside a marginal increase in precipitation concentration, paints a complex picture of climate dynamics in the Biobío region, influenced by its coastal geography.
A Coastal Climate in Transition
Carriel Sur International Airport, located in the Biobío region of Chile, is classified under the Köppen climate system as Csb, indicating a Mediterranean climate with dry summers. Nestled between the Pacific Ocean and the Andes, the region's climate is heavily influenced by maritime conditions. Over the last decade, the airport has recorded a cooling trend in high temperatures, with a decrease of 1.41°C (2.54°F). This contrasts with a slight warming in low temperatures, which have risen by 0.27°C (0.49°F). These changes suggest a narrowing of the temperature range, possibly due to increased oceanic influence or other regional climatic shifts.
Long-term Cooling Amidst Short-term Variability
Examining the all-time data, Carriel Sur shows a subtle long-term cooling trend in high temperatures, decreasing by 0.09°C (0.16°F). Meanwhile, low temperatures have risen by 0.16°C (0.29°F). This long-term pattern of cooling highs and warming lows could be indicative of broader climatic changes, such as increased cloud cover or changes in atmospheric circulation. The juxtaposition of a decade-long cooling trend with a slight all-time cooling suggests that recent years may have been particularly anomalous, possibly influenced by regional weather events or global climate phenomena.
Precipitation Patterns: A Slight Shift Towards Concentration
The Precipitation Concentration Index (PCI) at Carriel Sur has increased from a baseline of 17.9 to a current value of 19.2. This indicates a marginal shift towards more concentrated precipitation events, where rainfall is becoming less evenly distributed throughout the year. While not yet reaching the threshold of high concentration (PCI > 20), this change could have implications for water management and agriculture in the region, as more intense rainfall events can lead to increased runoff and reduced water infiltration.
Temperature Extremes: A Historical Perspective
Carriel Sur's historical temperature records reveal an absolute maximum of 34.3°C (93.7°F) and a minimum of -6.0°C (21.2°F). These extremes highlight the region's capacity for significant temperature variability, despite the overall trends. The record high underscores the potential for heatwaves, while the record low reflects the influence of cold air masses, possibly descending from the Andes or the Antarctic.
Regional Climate Goals and Future Considerations
Chile has been proactive in addressing climate change, aiming to reduce greenhouse gas emissions and enhance climate resilience. The observed trends at Carriel Sur, including the cooling of highs and the slight increase in precipitation concentration, provide critical data for informing these efforts. Understanding these localised changes is essential for developing adaptive strategies that align with national climate objectives.
Station Statistics
10-Year Trend
High: -1.66 °F/decade
Low: +1.34 °F/decade
Rain: +0.004 in/decade
25-Year Trend
High: -0.41 °F/decade
Low: +0.95 °F/decade
Rain: -0.024 in/decade
50-Year Trend
High: -0.23 °F/decade
Low: +0.19 °F/decade
Rain: -0.008 in/decade
All-Time Trend
High: -0.23 °F/decade
Low: +0.19 °F/decade
Rain: -0.008 in/decade
Percentage Above-Average Days
Last 12 Months: 42.3%
This Year: 29.1%
Precipitation Concentration Index (PCI) ℹ️
Last 12 Months: 14.4
Historical Average: 18.3
Percentile Rank of Last 12 Months ℹ️
High: 31st percentile
Low: 91st percentile
Rain: 39th percentile
Change in Variance ℹ️
High: -12.0%
Low: -0.2%
Intraday: -20.1%
Data Coverage
95.4%
First Year of Data
1973
Station Location
Historical Weather Records
| Max High | Avg High | Min High | Max Avg | Avg Avg | Min Avg | Max Low | Avg Low | Min Low | Max Precipitation | Avg Precipitation | Max Snow | Avg Snow | |
|---|---|---|---|---|---|---|---|---|---|---|---|---|---|
| Record | 93.74 °F | — | 43.12 °F | 75.02 °F | — | 34.88 °F | 64.89 °F | — | 21.20 °F | 12.01 in | — | — | — |
| January | 93.49 °F | 74.50 °F | 62.60 °F | 74.66 °F | 62.65 °F | 54.32 °F | 63.99 °F | 52.34 °F | 41.00 °F | 2.01 in | 0.02 in | — | — |
| February | 92.64 °F | 74.14 °F | 62.06 °F | 75.02 °F | 61.94 °F | 51.44 °F | 64.51 °F | 52.12 °F | 33.44 °F | 2.01 in | 0.02 in | — | — |
| March | 93.74 °F | 71.54 °F | 57.92 °F | 72.68 °F | 59.49 °F | 48.56 °F | 62.96 °F | 49.91 °F | 32.00 °F | 3.92 in | 0.04 in | — | — |
| April | 85.66 °F | 66.25 °F | 53.74 °F | 69.44 °F | 55.42 °F | 42.44 °F | 61.50 °F | 46.85 °F | 21.20 °F | 2.17 in | 0.09 in | — | — |
| May | 77.90 °F | 61.03 °F | 50.18 °F | 65.48 °F | 52.41 °F | 39.74 °F | 59.00 °F | 45.45 °F | 28.40 °F | 12.01 in | 0.20 in | — | — |
| June | 71.60 °F | 57.34 °F | 44.28 °F | 67.28 °F | 49.93 °F | 37.94 °F | 57.20 °F | 43.51 °F | 28.04 °F | 6.38 in | 0.26 in | — | — |
| July | 71.06 °F | 56.31 °F | 44.62 °F | 66.38 °F | 48.75 °F | 35.24 °F | 55.40 °F | 42.04 °F | 24.80 °F | 5.63 in | 0.24 in | — | — |
| August | 73.94 °F | 57.74 °F | 43.12 °F | 61.70 °F | 49.85 °F | 34.88 °F | 55.40 °F | 42.60 °F | 27.50 °F | 5.12 in | 0.20 in | — | — |
| September | 79.16 °F | 60.36 °F | 48.43 °F | 62.78 °F | 51.47 °F | 41.18 °F | 55.22 °F | 43.19 °F | 30.02 °F | 3.54 in | 0.13 in | — | — |
| October | 80.96 °F | 63.45 °F | 51.80 °F | 67.82 °F | 54.15 °F | 43.88 °F | 57.20 °F | 45.21 °F | 30.56 °F | 2.64 in | 0.08 in | — | — |
| November | 90.45 °F | 67.66 °F | 53.28 °F | 68.72 °F | 57.45 °F | 45.32 °F | 60.98 °F | 47.91 °F | 33.08 °F | 2.01 in | 0.05 in | — | — |
| December | 89.60 °F | 71.74 °F | 55.58 °F | 73.58 °F | 60.74 °F | 52.16 °F | 64.89 °F | 50.73 °F | 32.00 °F | 2.11 in | 0.03 in | — | — |
Data Visualisations
Remove WatermarksCurrent Year Climate Trends vs Historical


Max Temperature this Year | 1 of 6
Climate 12-Month Moving Averages


Max Temperature 12-Month MA | 1 of 6
Daily Data Points and Averages Throughout the Year


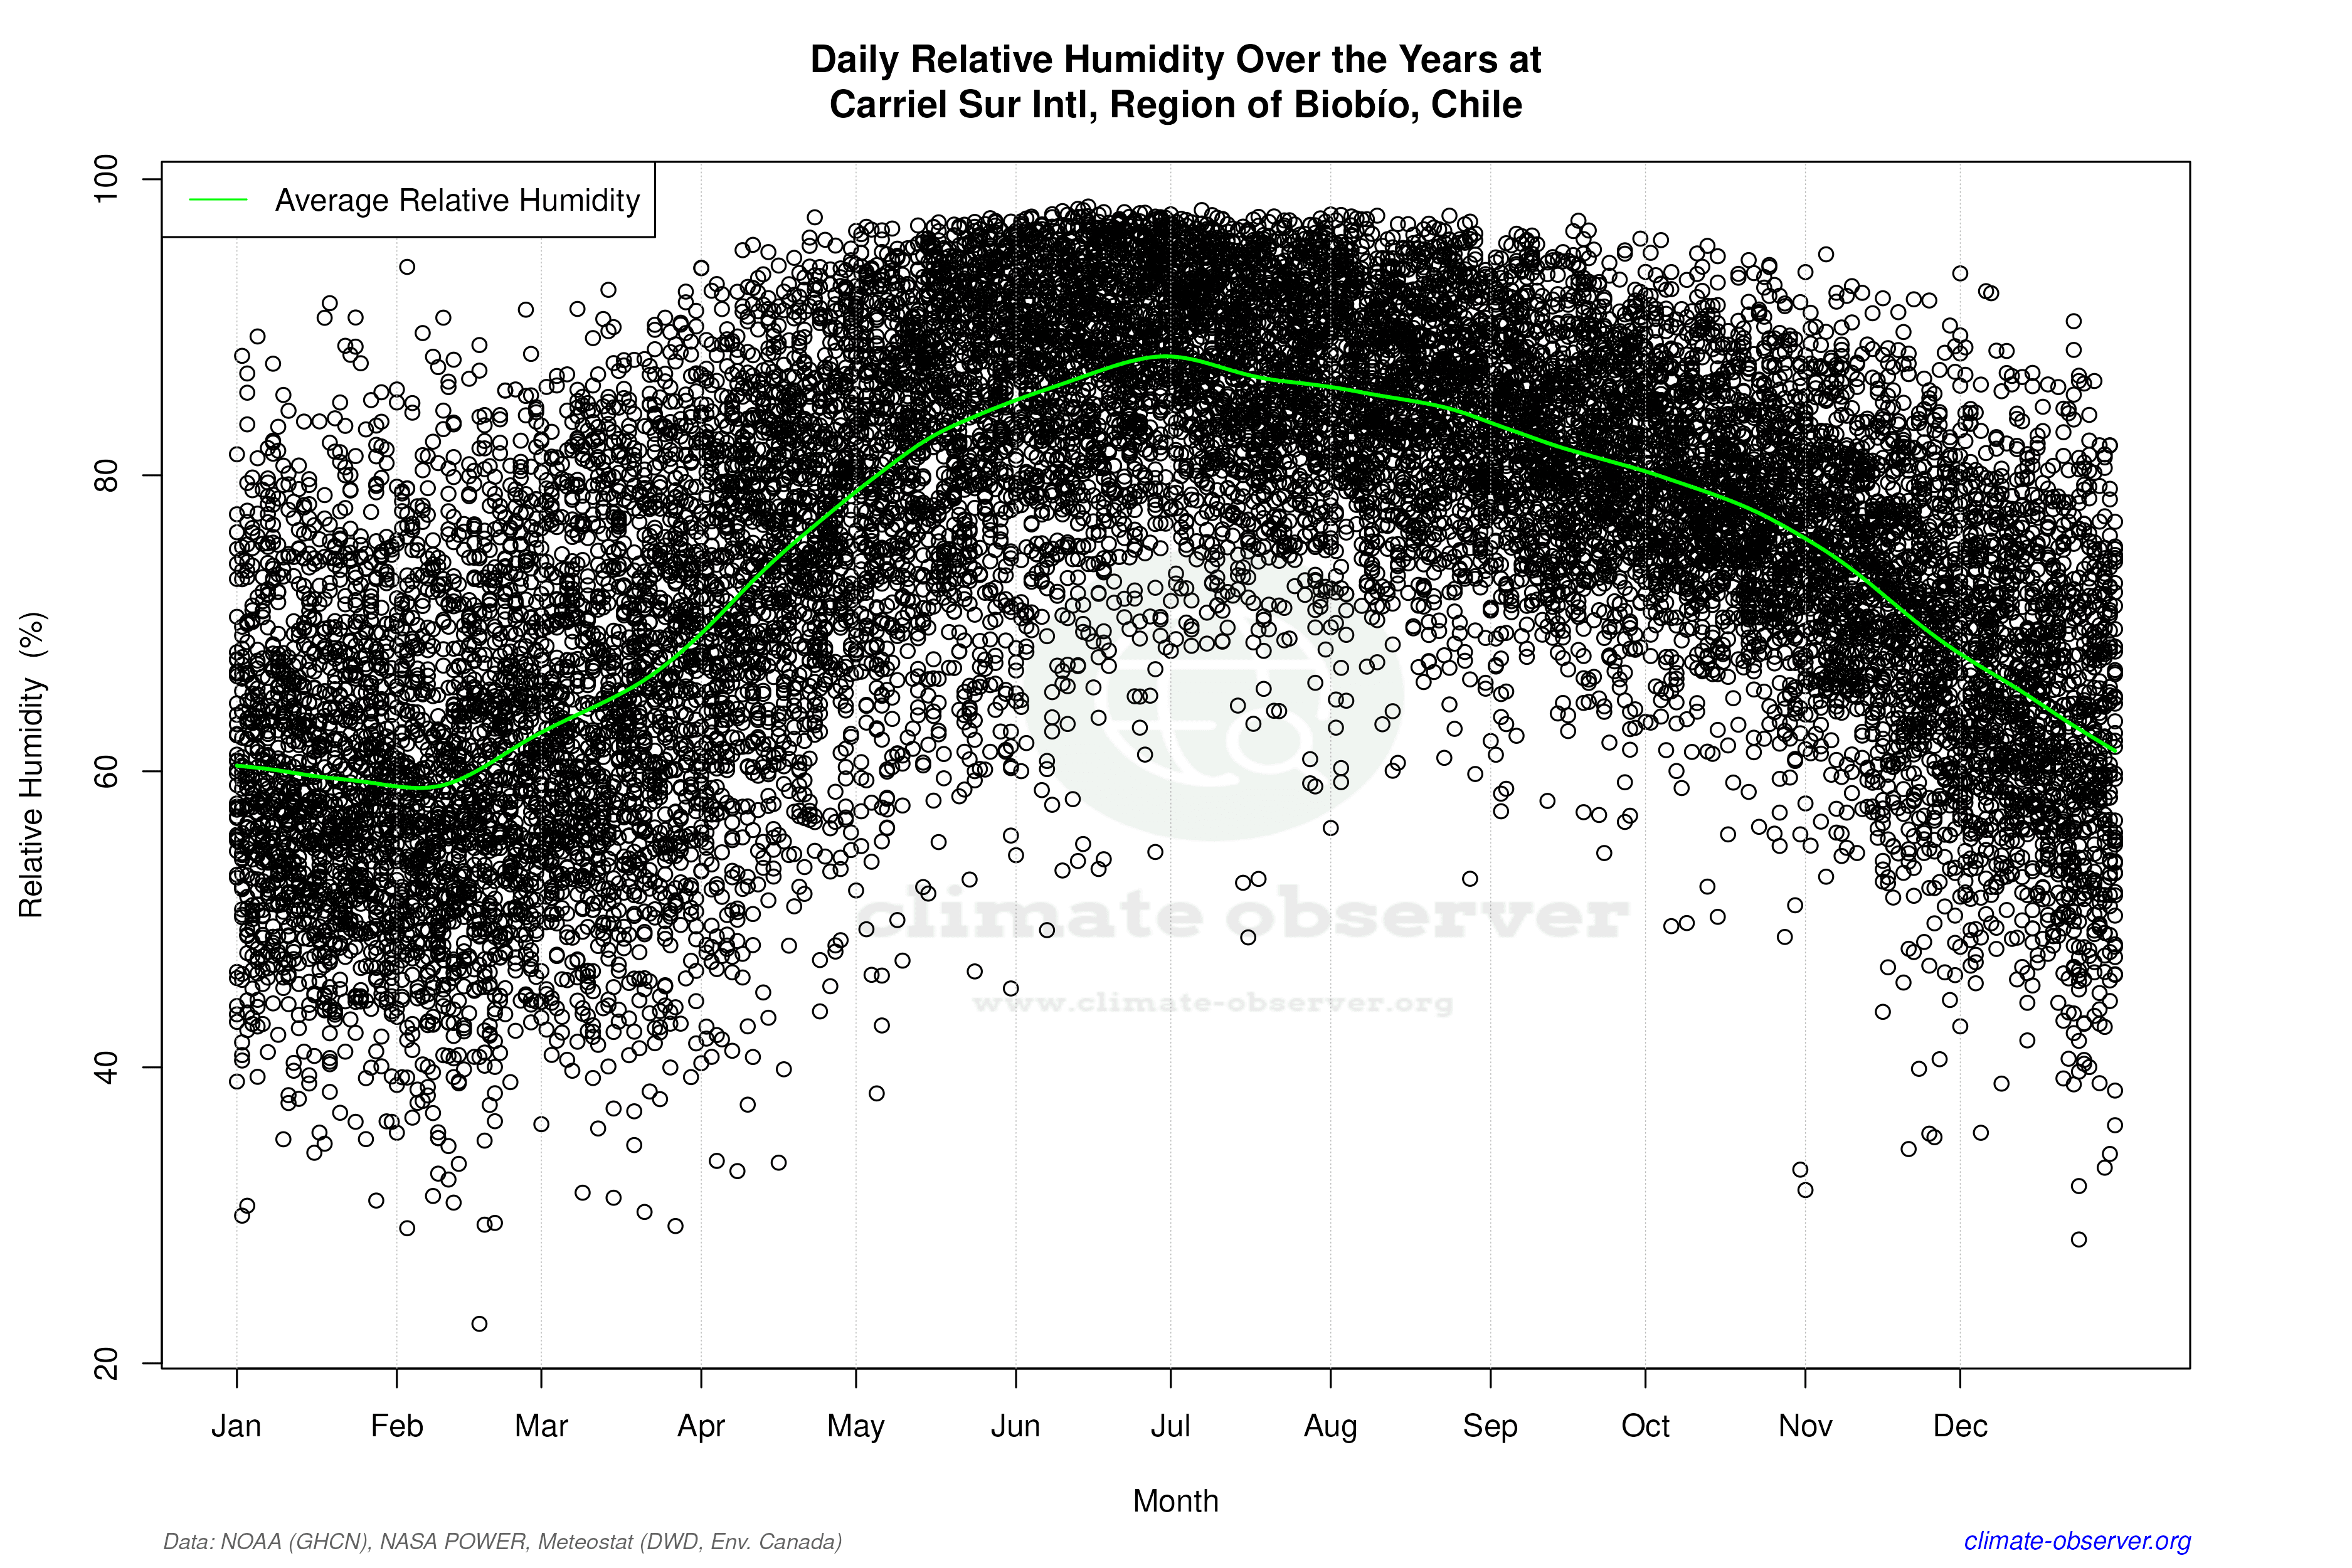

Average Max Temperature Throughout Year | 1 of 5
