Climate for Station: Douala, Littoral, Cameroon
Loading live weather...
Climate Analysis & Overview
Douala's climate is characterised by a warming trend, with notable increases in both high and low temperatures over the past decade. The precipitation pattern has become slightly more even, indicating a shift in rainfall distribution. These changes align with Cameroon's broader climate goals of adapting to and mitigating climate impacts.
Equatorial Climate Dynamics
Douala, situated in the Littoral region of Cameroon, experiences a tropical monsoon climate (Am) according to the Köppen classification. This climate is heavily influenced by its proximity to the Atlantic Ocean and the surrounding lowland geography, which contribute to its high humidity and significant rainfall. Over the past ten years, Douala has seen a warming trend, with the highs increasing by 0.86°C (1.55°F) and the lows by 0.55°C (0.99°F). This trend is more pronounced than the all-time warming, which shows increases of 0.35°C (0.63°F) for highs and 0.27°C (0.49°F) for lows. Such warming trends are consistent with regional observations and underscore the importance of climate adaptation strategies.
Temperature Extremes and Variability
The absolute temperature records for Douala highlight the extremes the city can experience. The maximum recorded temperature is 39.2°C (102.6°F), while the minimum is 16.0°C (60.8°F). These extremes reflect the variability within the tropical monsoon climate, where periods of intense heat can be followed by cooler spells, particularly during the rainy season. The all-time temperature trends, although showing a rise, are less steep than the recent decade's data, suggesting an acceleration in warming that may be linked to broader global climate change patterns.
Precipitation Patterns and Distribution
Douala's Precipitation Concentration Index (PCI) has seen a slight decrease from a baseline of 13.09 to a current value of 11.90. The PCI measures how precipitation is distributed over time, with a lower value indicating more evenly spread rainfall events. This marginal change suggests a shift towards a more consistent rainfall pattern, which could have implications for agriculture and water management in the region. While the PCI does not indicate highly concentrated rainfall events, the even distribution aligns with Cameroon's efforts to manage water resources effectively.
Regional Climate Goals and Adaptation
Cameroon has been proactive in setting regional climate goals that focus on both mitigation and adaptation strategies. Douala's climate data, with its warming trends and evolving precipitation patterns, provides a critical insight into the challenges and opportunities facing the region. The observed changes in temperature and precipitation distribution underscore the need for continued investment in climate resilience and sustainable development practices. These efforts are crucial for ensuring that Douala and the wider region can adapt to the ongoing impacts of climate change while working towards a more sustainable future.
Station Statistics
10-Year Trend
High: +1.33 °F/decade
Low: +1.01 °F/decade
Rain: -0.154 in/decade
25-Year Trend
High: +0.89 °F/decade
Low: +0.55 °F/decade
Rain: -0.031 in/decade
50-Year Trend
High: +0.78 °F/decade
Low: +0.60 °F/decade
Rain: +0.005 in/decade
All-Time Trend
High: +0.64 °F/decade
Low: +0.49 °F/decade
Rain: -0.002 in/decade
Percentage Above-Average Days
Last 12 Months: 51.7%
This Year: 32.2%
Precipitation Concentration Index (PCI) ℹ️
Last 12 Months: 10.4
Historical Average: 13.2
Percentile Rank of Last 12 Months ℹ️
High: 96th percentile
Low: 96th percentile
Rain: 6th percentile
Change in Variance ℹ️
High: -5.3%
Low: -20.5%
Intraday: -9.8%
Data Coverage
64.7%
First Year of Data
1948
Station Location
Historical Weather Records
| Max High | Avg High | Min High | Max Avg | Avg Avg | Min Avg | Max Low | Avg Low | Min Low | Max Precipitation | Avg Precipitation | Max Snow | Avg Snow | |
|---|---|---|---|---|---|---|---|---|---|---|---|---|---|
| Record | 102.56 °F | — | 74.84 °F | 91.94 °F | — | 68.90 °F | 81.50 °F | — | 60.80 °F | 12.60 in | — | — | — |
| January | 97.34 °F | 90.26 °F | 77.67 °F | 89.24 °F | 81.35 °F | 72.86 °F | 80.60 °F | 74.47 °F | 60.96 °F | 3.15 in | 0.06 in | — | — |
| February | 102.56 °F | 91.30 °F | 79.41 °F | 91.94 °F | 82.43 °F | 74.48 °F | 81.50 °F | 75.70 °F | 66.79 °F | 3.90 in | 0.10 in | — | — |
| March | 100.04 °F | 90.37 °F | 77.00 °F | 90.14 °F | 81.89 °F | 71.06 °F | 80.60 °F | 75.40 °F | 60.80 °F | 4.65 in | 0.20 in | — | — |
| April | 97.52 °F | 89.18 °F | 77.47 °F | 89.60 °F | 81.01 °F | 73.76 °F | 80.96 °F | 74.93 °F | 64.94 °F | 7.87 in | 0.31 in | — | — |
| May | 97.88 °F | 88.52 °F | 76.64 °F | 90.14 °F | 80.59 °F | 73.40 °F | 80.60 °F | 74.70 °F | 66.20 °F | 4.72 in | 0.31 in | — | — |
| June | 102.20 °F | 85.64 °F | 76.03 °F | 89.24 °F | 78.96 °F | 71.60 °F | 78.80 °F | 73.83 °F | 64.76 °F | 8.27 in | 0.42 in | — | — |
| July | 90.50 °F | 82.98 °F | 75.20 °F | 83.12 °F | 77.20 °F | 71.06 °F | 78.08 °F | 73.10 °F | 65.48 °F | 9.84 in | 0.57 in | — | — |
| August | 91.72 °F | 82.46 °F | 74.84 °F | 81.86 °F | 76.74 °F | 70.34 °F | 77.00 °F | 72.99 °F | 67.46 °F | 12.60 in | 0.66 in | — | — |
| September | 93.92 °F | 84.31 °F | 75.20 °F | 83.84 °F | 77.70 °F | 72.68 °F | 77.00 °F | 73.26 °F | 65.48 °F | 9.41 in | 0.60 in | — | — |
| October | 96.80 °F | 85.91 °F | 77.00 °F | 84.74 °F | 78.48 °F | 68.90 °F | 77.36 °F | 73.35 °F | 64.04 °F | 6.38 in | 0.42 in | — | — |
| November | 100.40 °F | 87.71 °F | 76.10 °F | 87.80 °F | 79.85 °F | 72.32 °F | 78.80 °F | 74.22 °F | 65.30 °F | 4.57 in | 0.20 in | — | — |
| December | 96.80 °F | 89.25 °F | 77.83 °F | 88.34 °F | 80.86 °F | 73.40 °F | 78.80 °F | 74.46 °F | 64.40 °F | 1.74 in | 0.06 in | — | — |
Data Visualisations
Remove WatermarksCurrent Year Climate Trends vs Historical


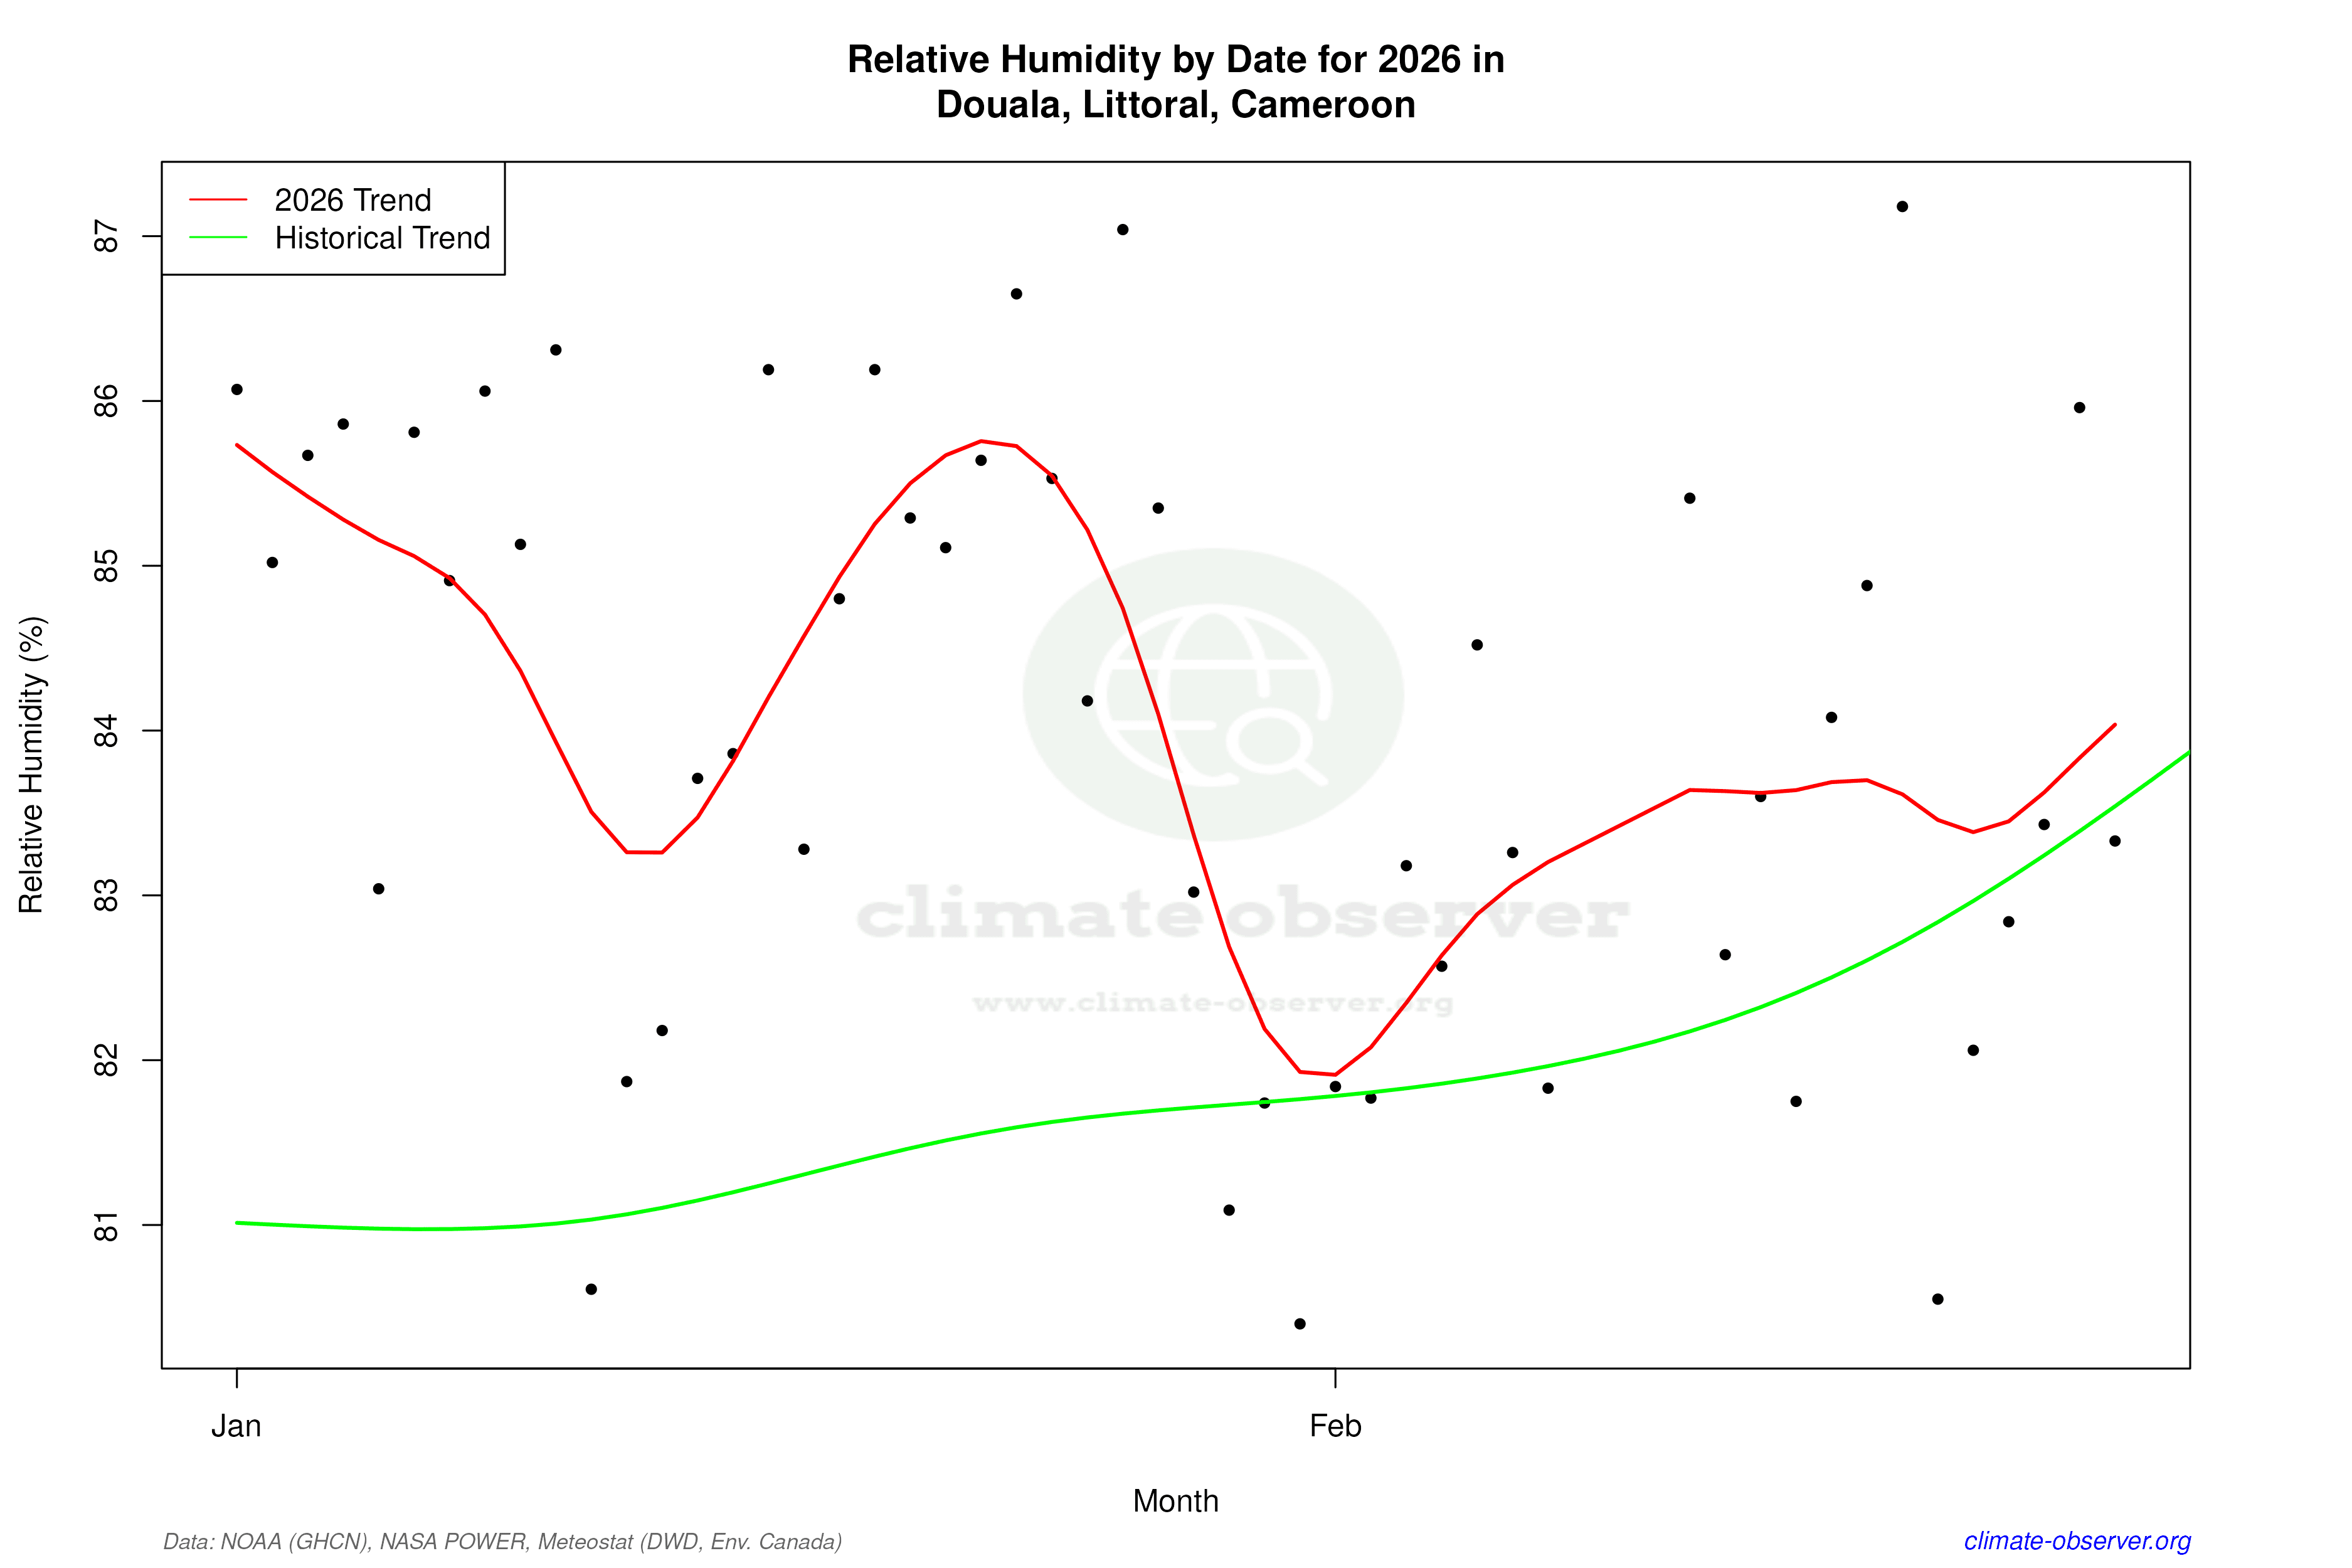

Max Temperature this Year | 1 of 6
Climate 12-Month Moving Averages


Max Temperature 12-Month MA | 1 of 6
Daily Data Points and Averages Throughout the Year


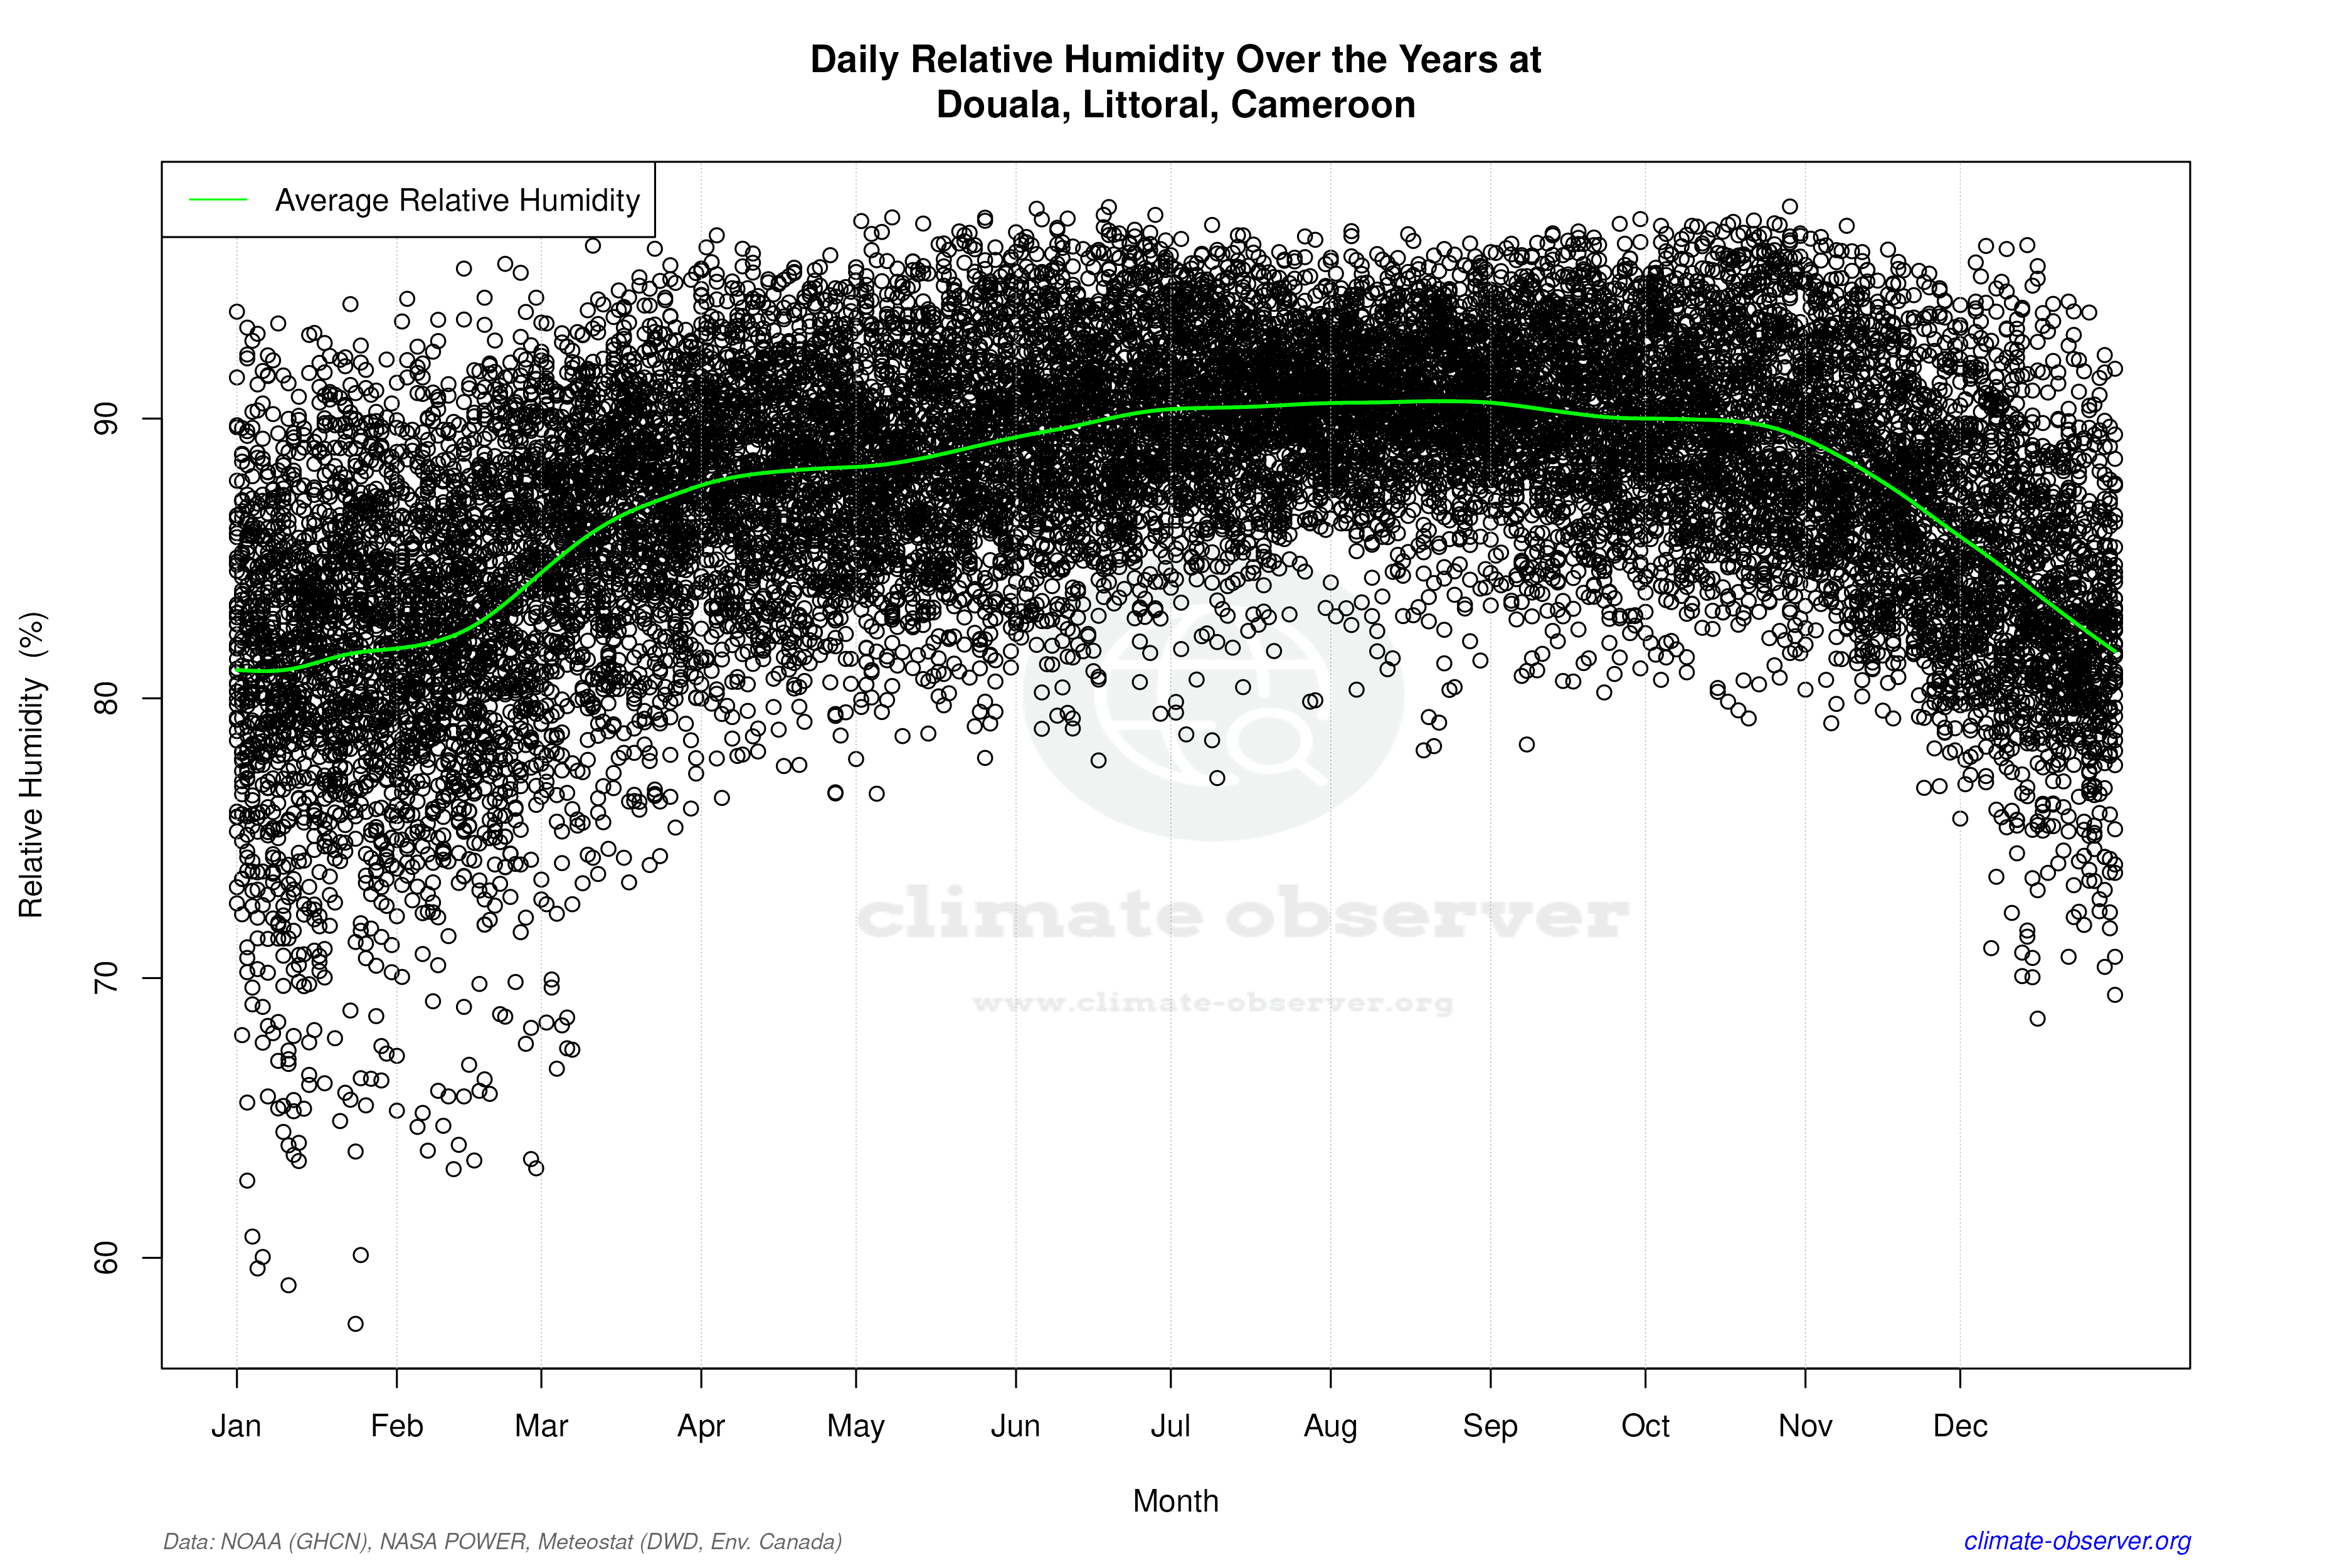

Average Max Temperature Throughout Year | 1 of 5
