Climate for Station: San Andres (Isla)/s, Archipelago of San Andrés, Providencia and Santa Catalina, Colombia
Loading live weather...
Climate Analysis & Overview
San Andrés, a tropical island in the Caribbean Sea, is experiencing a nuanced climate shift. The island's temperatures are rising, with a notable increase in high temperatures over the past decade, while precipitation patterns have become slightly more even. These changes align with Colombia's broader climate adaptation strategies.
Tropical Warming Trends
San Andrés, known for its tropical rainforest climate (Köppen classification: Af), is witnessing a warming trend. Over the past decade, the island has experienced a rise in high temperatures by 0.71°C (1.28°F). This increase is more pronounced than the all-time trend, which shows a rise of 0.35°C (0.63°F). The warming is likely influenced by the island's geographic position, surrounded by the Caribbean Sea, which moderates temperature extremes but can also amplify warming trends due to oceanic heat absorption.
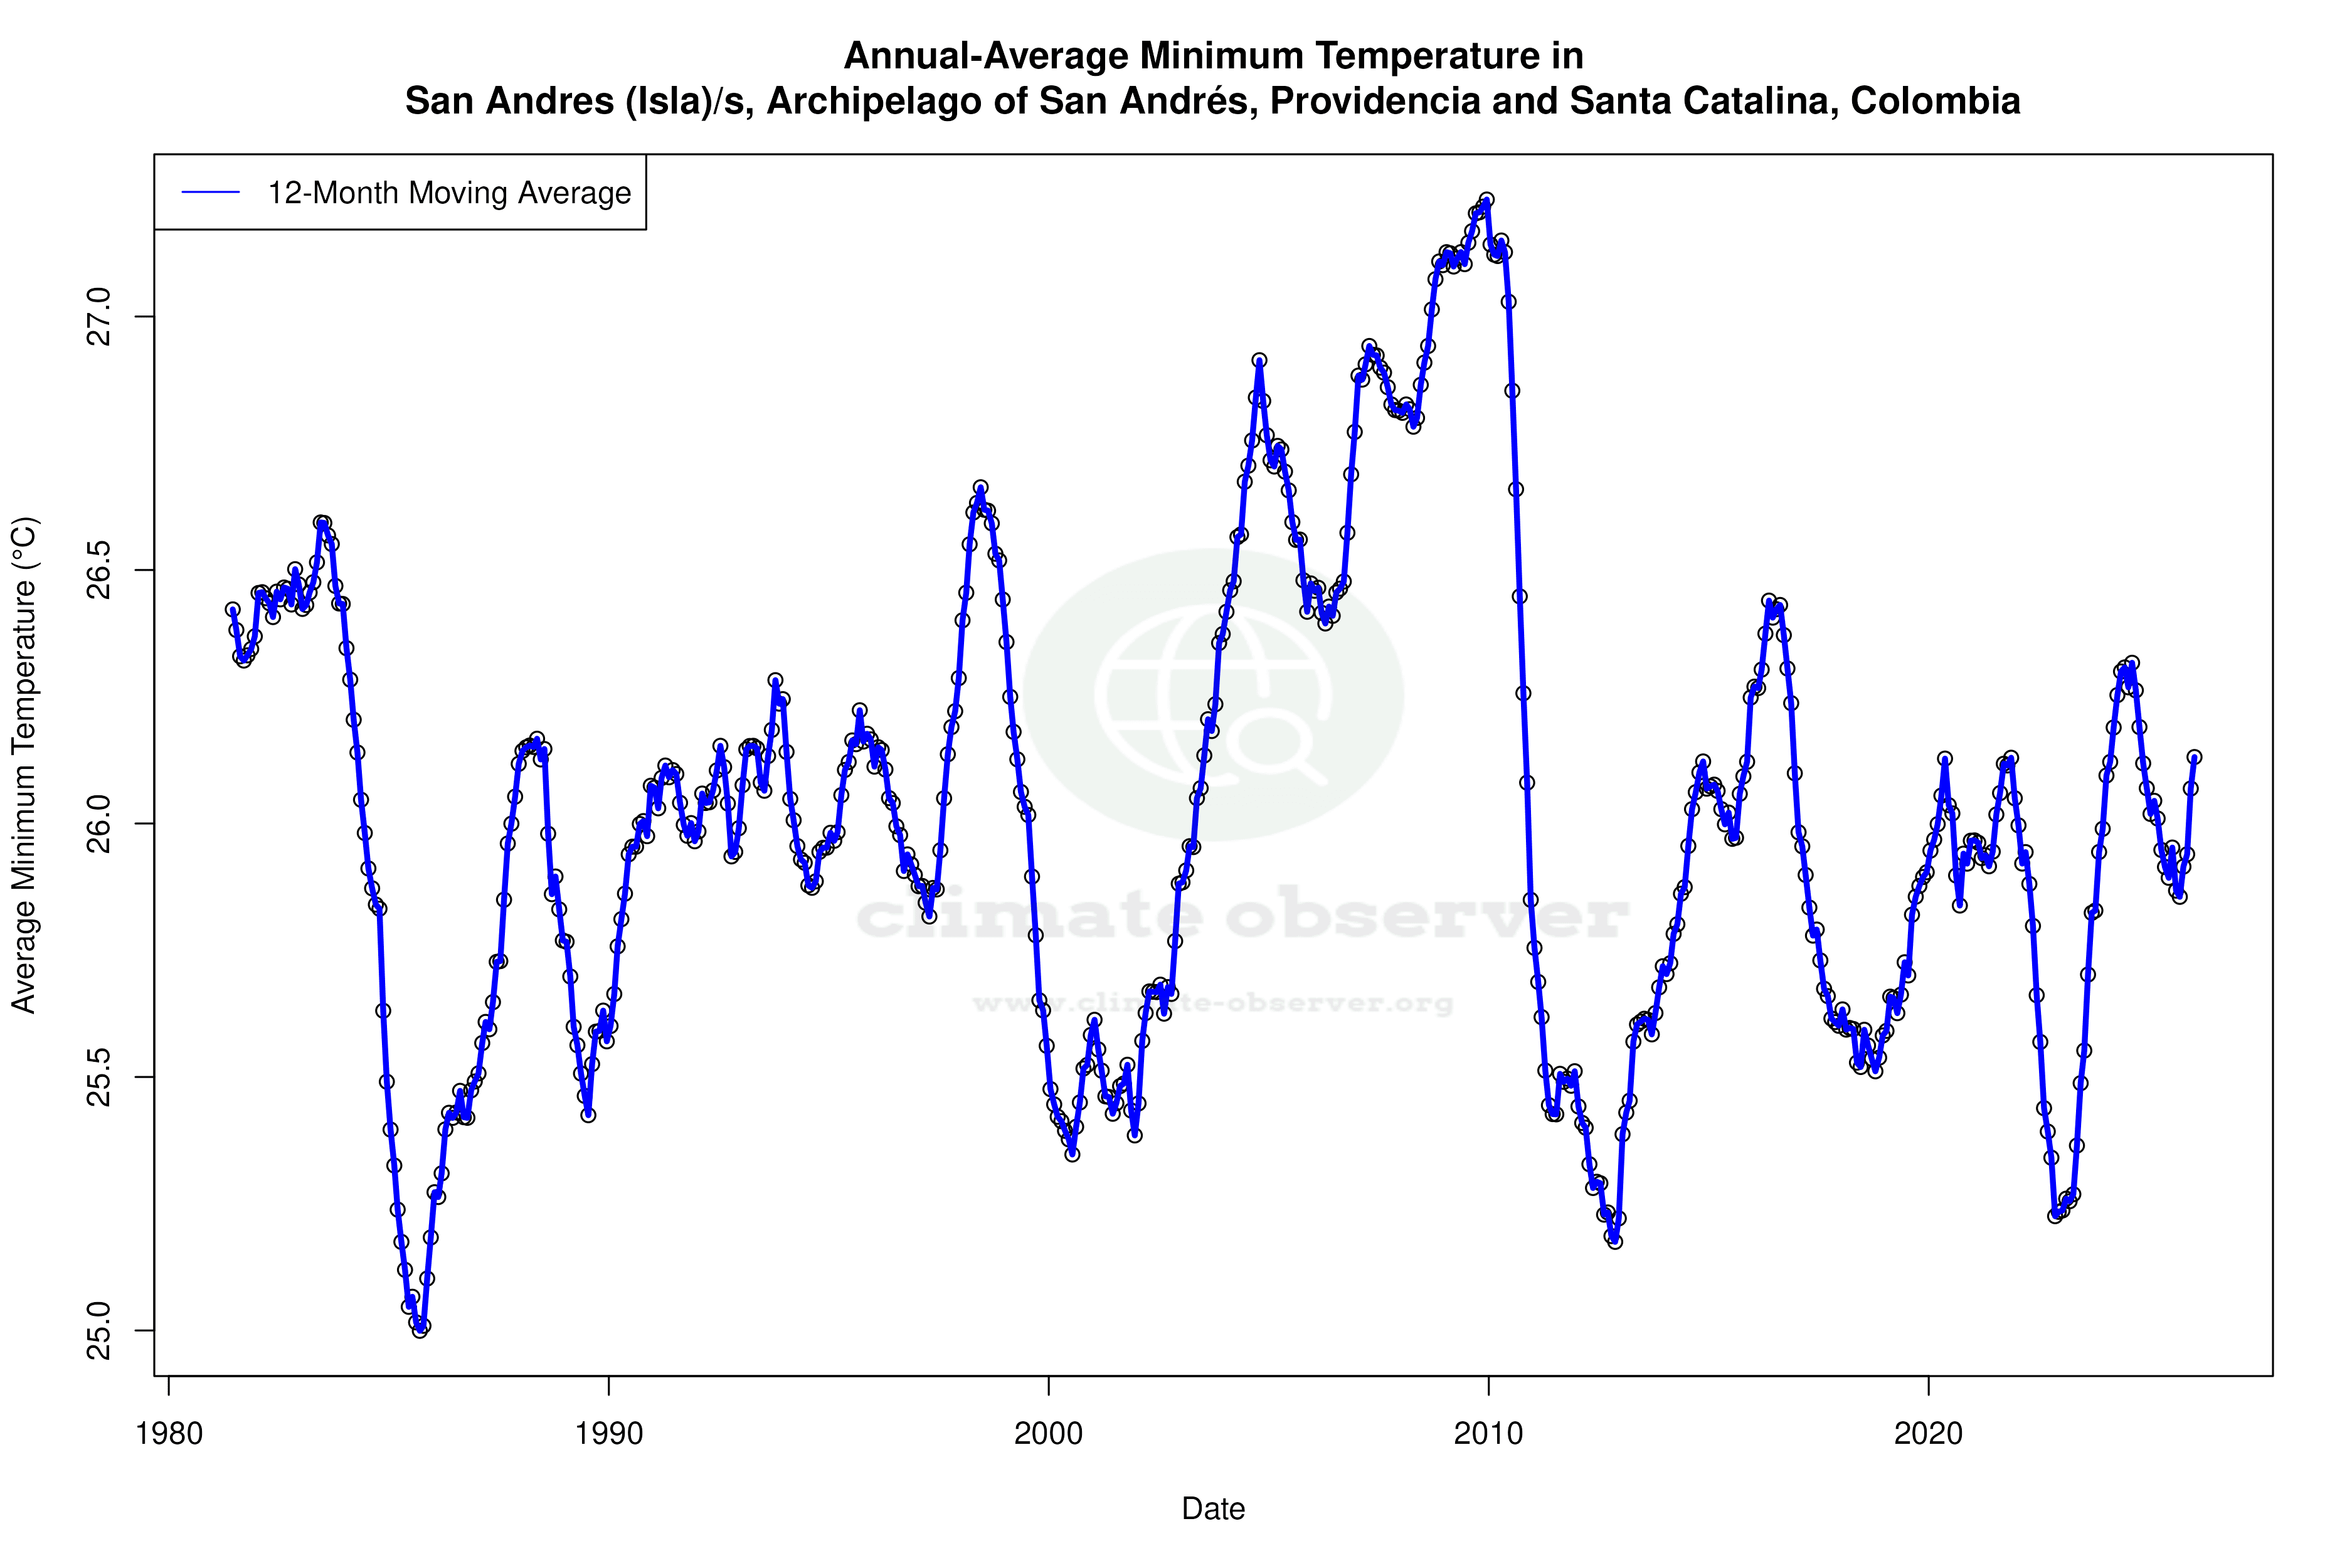
Stable Low Temperature Patterns
In contrast to the highs, the low temperatures have remained relatively stable. The decade-long trend shows a minimal increase of 0.00°C (0.00°F), while the all-time trend indicates a slight cooling of -0.00°C (-0.00°F). This stability in low temperatures suggests that the island's nocturnal cooling processes, possibly aided by ocean breezes, remain effective despite the overall warming trend.
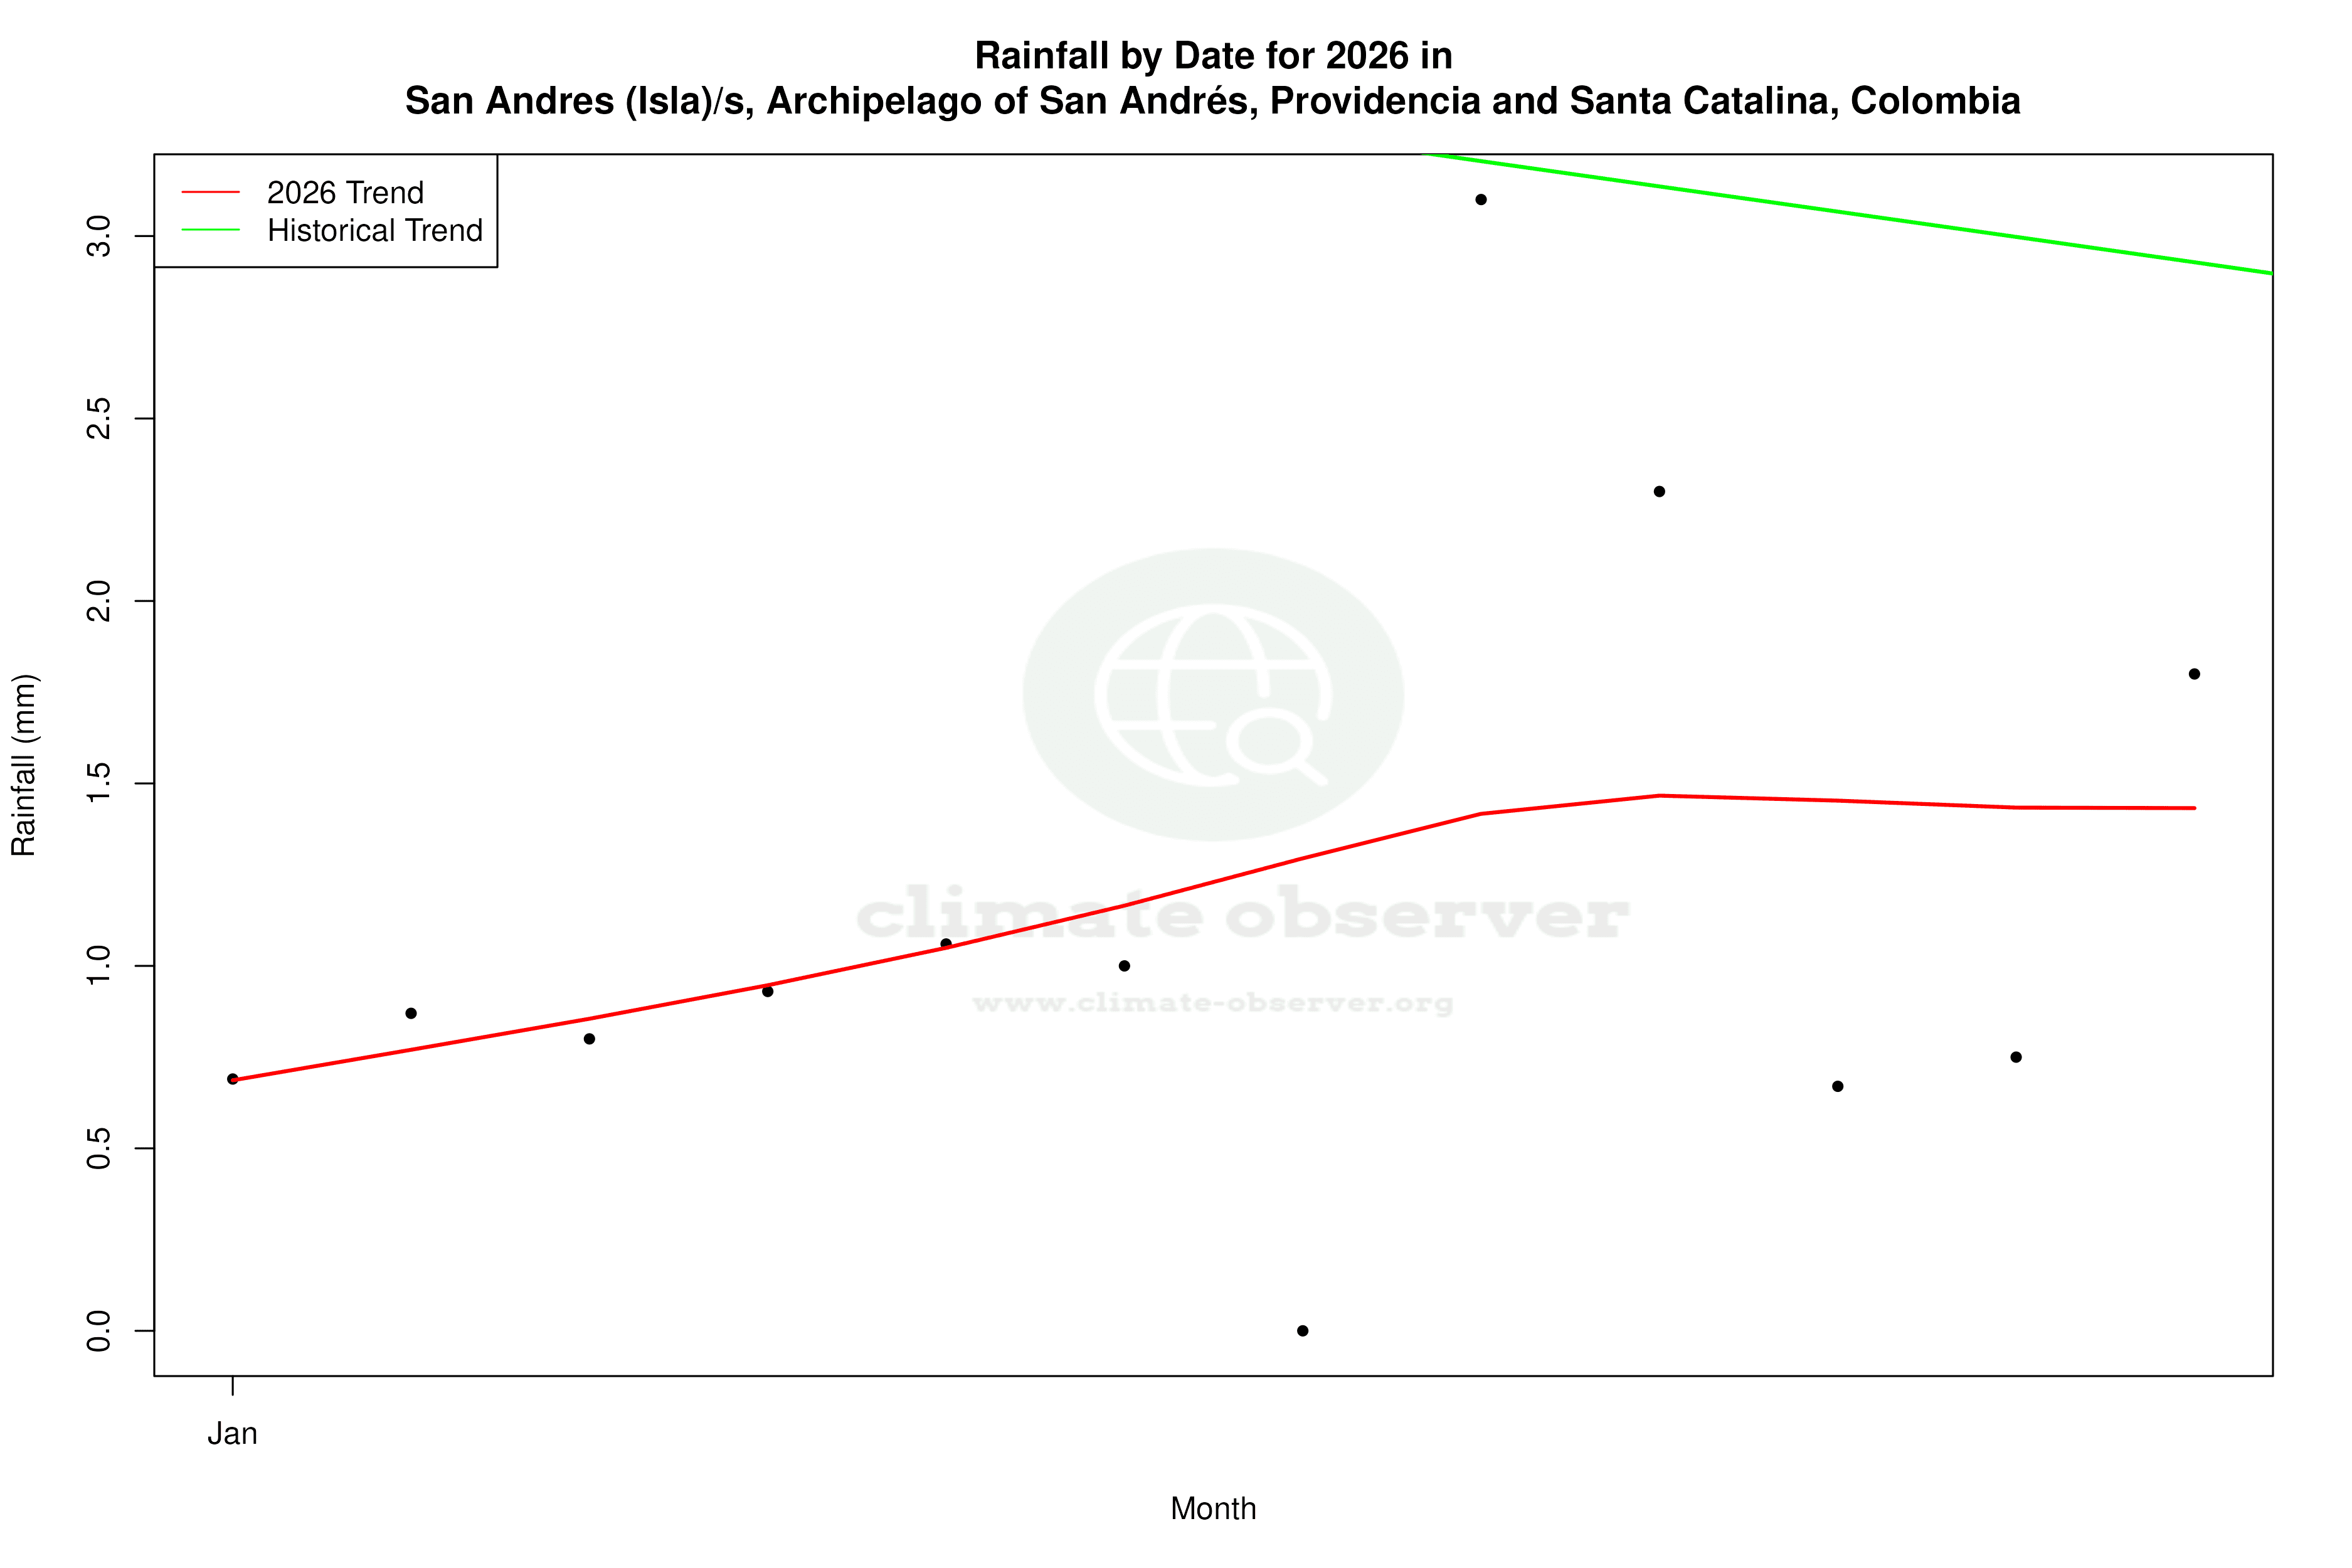
Precipitation Distribution Shifts
The Precipitation Concentration Index (PCI) for San Andrés has decreased from a baseline of 14.0 to a current value of 12.4. This slight decrease indicates that rainfall is now more evenly distributed throughout the year, reducing the likelihood of intense, concentrated rain events. Such a shift can be beneficial for water management and agriculture, aligning with Colombia's goals to enhance climate resilience and reduce vulnerability to extreme weather events.
Temperature Extremes and Records
San Andrés has recorded temperature extremes with a maximum of 36.0°C (96.8°F) and a minimum of 17.7°C (63.9°F). These records highlight the island's capacity for significant thermal variation, albeit moderated by its maritime climate. The record high underscores the potential for heat stress, a growing concern in the context of global warming.
Regional Climate Context
The climate dynamics of San Andrés are emblematic of broader regional trends in the Caribbean, where rising sea temperatures and shifting precipitation patterns are prevalent. These changes are occurring against the backdrop of Colombia's commitment to international climate agreements, aiming to mitigate climate change impacts through adaptive strategies and sustainable practices. The island's climate profile serves as a microcosm of these larger efforts, illustrating both the challenges and opportunities in navigating a changing climate.
Station Statistics
10-Year Trend
High: +0.84 °F/decade
Low: +0.26 °F/decade
Rain: +0.061 in/decade
25-Year Trend
High: +1.71 °F/decade
Low: -0.46 °F/decade
Rain: +0.003 in/decade
50-Year Trend
High: +0.62 °F/decade
Low: +0.00 °F/decade
Rain: -0.008 in/decade
All-Time Trend
High: +0.62 °F/decade
Low: +0.00 °F/decade
Rain: -0.010 in/decade
Percentage Above-Average Days
Last 12 Months: 60.3%
This Year: 26.6%
Precipitation Concentration Index (PCI) ℹ️
Last 12 Months: 12.1
Historical Average: 13.8
Percentile Rank of Last 12 Months ℹ️
High: 84th percentile
Low: 50th percentile
Rain: 51st percentile
Change in Variance ℹ️
High: -23.0%
Low: +1.3%
Intraday: -25.9%
Data Coverage
86.3%
First Year of Data
1962
Station Location
Historical Weather Records
| Max High | Avg High | Min High | Max Avg | Avg Avg | Min Avg | Max Low | Avg Low | Min Low | Max Precipitation | Avg Precipitation | Max Snow | Avg Snow | |
|---|---|---|---|---|---|---|---|---|---|---|---|---|---|
| Record | 96.80 °F | — | 77.90 °F | 88.16 °F | — | 75.38 °F | 85.46 °F | — | 63.86 °F | 11.30 in | — | — | — |
| January | 89.60 °F | 83.68 °F | 77.99 °F | 86.00 °F | 80.72 °F | 75.38 °F | 81.86 °F | 77.33 °F | 65.12 °F | 3.03 in | 0.10 in | — | — |
| February | 94.64 °F | 83.63 °F | 77.90 °F | 84.20 °F | 80.59 °F | 75.63 °F | 81.07 °F | 77.45 °F | 68.00 °F | 1.50 in | 0.05 in | — | — |
| March | 91.40 °F | 84.38 °F | 77.99 °F | 85.64 °F | 81.20 °F | 75.56 °F | 81.59 °F | 77.94 °F | 69.80 °F | 0.79 in | 0.03 in | — | — |
| April | 96.80 °F | 85.45 °F | 79.16 °F | 86.36 °F | 82.21 °F | 76.82 °F | 83.53 °F | 79.11 °F | 71.24 °F | 2.24 in | 0.03 in | — | — |
| May | 93.74 °F | 86.21 °F | 80.02 °F | 87.26 °F | 82.98 °F | 76.82 °F | 84.20 °F | 79.61 °F | 68.00 °F | 6.77 in | 0.15 in | — | — |
| June | 96.80 °F | 86.13 °F | 78.80 °F | 87.44 °F | 82.95 °F | 75.56 °F | 84.81 °F | 79.66 °F | 64.94 °F | 7.01 in | 0.27 in | — | — |
| July | 93.20 °F | 85.92 °F | 79.70 °F | 86.54 °F | 82.86 °F | 76.64 °F | 83.84 °F | 79.66 °F | 68.00 °F | 5.47 in | 0.22 in | — | — |
| August | 95.90 °F | 86.25 °F | 79.39 °F | 88.16 °F | 83.03 °F | 76.10 °F | 84.38 °F | 79.49 °F | 69.80 °F | 5.20 in | 0.24 in | — | — |
| September | 93.20 °F | 86.75 °F | 79.75 °F | 87.62 °F | 82.97 °F | 77.18 °F | 85.46 °F | 78.99 °F | 65.12 °F | 5.83 in | 0.27 in | — | — |
| October | 95.00 °F | 86.23 °F | 79.88 °F | 87.26 °F | 82.44 °F | 76.82 °F | 84.54 °F | 78.57 °F | 64.40 °F | 5.84 in | 0.37 in | — | — |
| November | 91.40 °F | 85.30 °F | 79.21 °F | 85.82 °F | 81.97 °F | 76.28 °F | 84.61 °F | 78.39 °F | 68.00 °F | 11.30 in | 0.36 in | — | — |
| December | 89.96 °F | 84.45 °F | 78.80 °F | 85.10 °F | 81.46 °F | 75.74 °F | 83.82 °F | 78.13 °F | 63.86 °F | 4.25 in | 0.18 in | — | — |
Data Visualisations
Remove WatermarksCurrent Year Climate Trends vs Historical


Max Temperature this Year | 1 of 6
Climate 12-Month Moving Averages
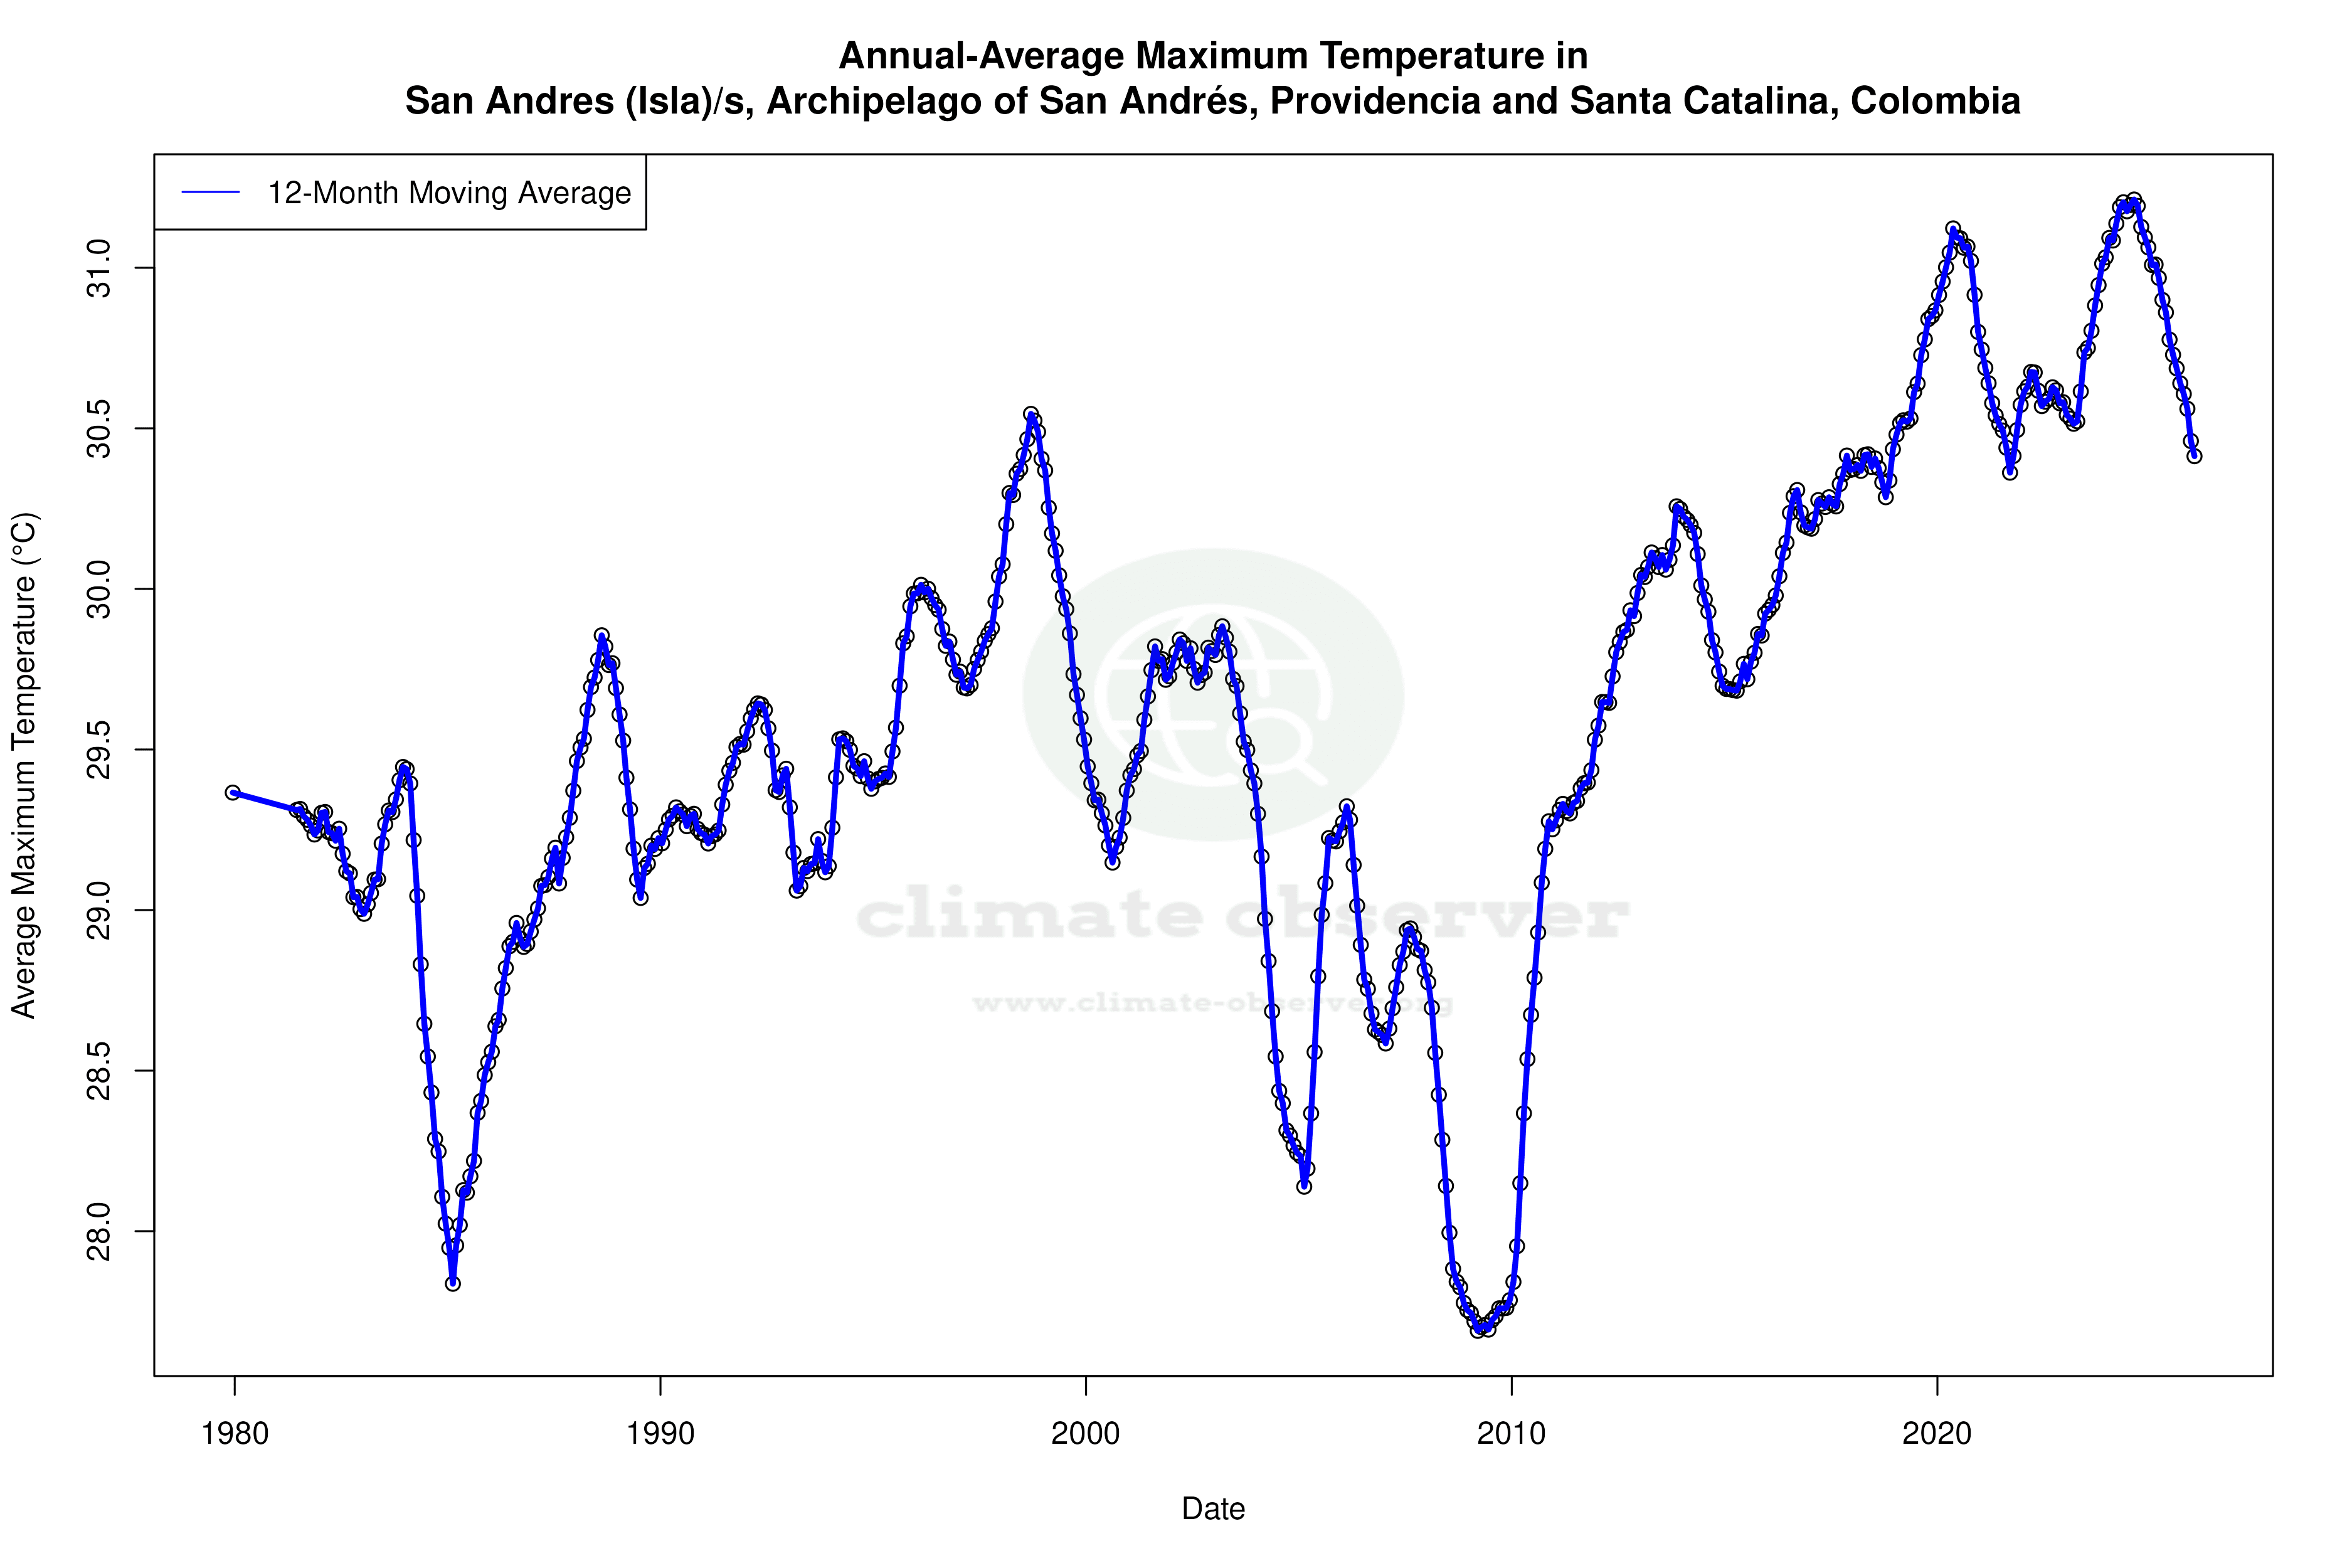


Max Temperature 12-Month MA | 1 of 6
Daily Data Points and Averages Throughout the Year


Average Max Temperature Throughout Year | 1 of 5
