Climate for Station: Praia, Cape Verde
Loading live weather...
Climate Analysis & Overview
Praia is experiencing a warming trend, with significant increases in both high and low temperatures over the past decade. The concentration of precipitation events is rising, indicating more intense but less frequent rainfall. These changes highlight the need for adaptive strategies in the face of evolving climate patterns.
Warming Trends in Praia
Praia, located at 14.917°N, -23.6°W, is characterised by a hot semi-arid climate (BSh) according to the Köppen classification. This region, influenced by its coastal proximity, has shown a warming pattern over the years. Over the past decade, the high temperatures have increased by 1.18°C (2.12°F), while lows have risen by 0.19°C (0.34°F). These recent trends suggest an acceleration compared to the all-time trends, where highs have risen by 1.04°C (1.87°F) and lows have slightly decreased by 0.16°C (0.29°F). This juxtaposition of trends indicates a more pronounced warming in recent years, which could impact local ecosystems and human activities.
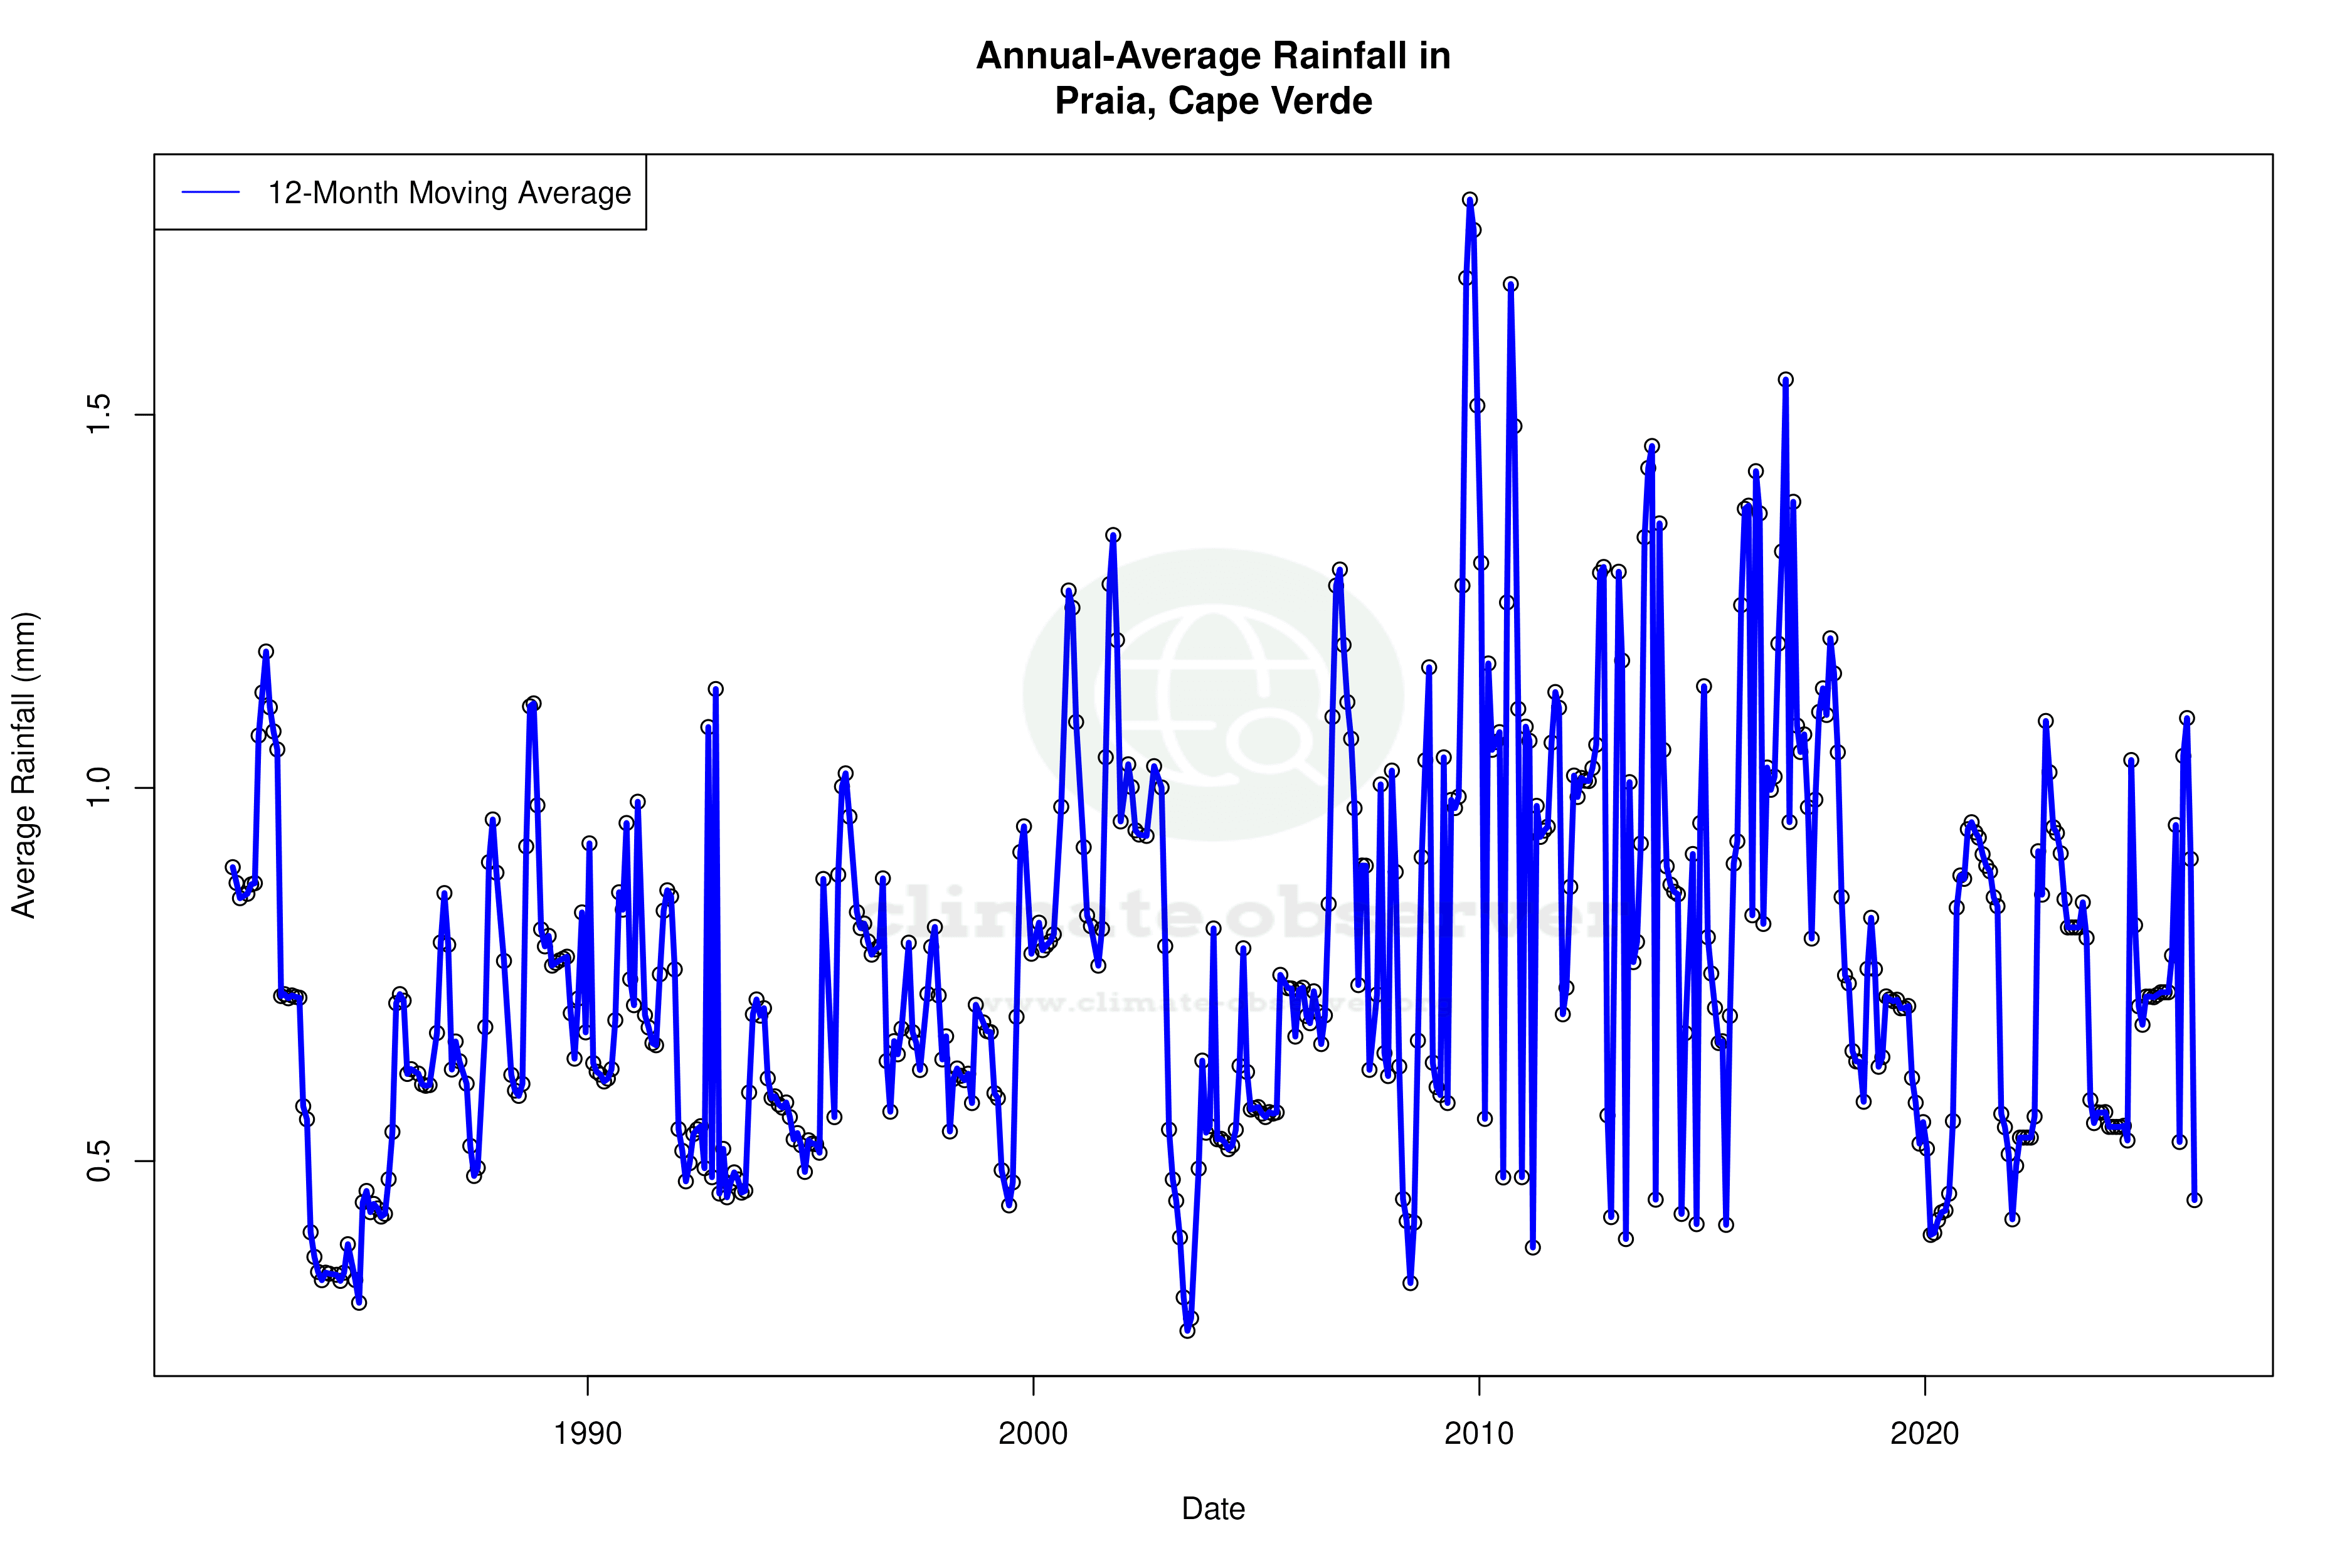
Precipitation Patterns: Concentration and Intensity
The Precipitation Concentration Index (PCI) for Praia has increased from a baseline of 19.98 to a current value of 21.26. This marks a shift towards more concentrated precipitation events, meaning that rain is occurring in fewer, but more intense, episodes. A PCI above 20 is considered highly concentrated, suggesting that the region may face challenges related to water management and flood risk. This change in precipitation patterns aligns with broader regional concerns about climate resilience and adaptation.
Temperature Extremes: Historical Records
Praia's climate is marked by significant temperature extremes, with a recorded maximum of 39.4°C (102.9°F) and a minimum of 12.4°C (54.3°F). These extremes underscore the variability and potential volatility of the local climate, which can have implications for agriculture, health, and infrastructure. Understanding these records helps in planning for future climate scenarios and mitigating potential impacts.
Regional Climate Context and Implications
The warming and precipitation trends observed in Praia are reflective of broader patterns across Cape Verde. The region is actively pursuing climate adaptation strategies, focusing on sustainable water use and enhancing resilience to extreme weather events. These efforts are crucial as the warming trend continues and precipitation becomes more irregular. The changes in Praia's climate underscore the importance of integrating scientific insights into policy and planning to safeguard the region's environmental and socio-economic well-being.
Station Statistics
10-Year Trend
High: +3.24 °F/decade
Low: +0.38 °F/decade
Rain: -0.016 in/decade
25-Year Trend
High: +1.49 °F/decade
Low: -0.28 °F/decade
Rain: -0.002 in/decade
50-Year Trend
High: +1.74 °F/decade
Low: -0.26 °F/decade
Rain: +0.001 in/decade
All-Time Trend
High: +1.74 °F/decade
Low: -0.26 °F/decade
Rain: +0.001 in/decade
Percentage Above-Average Days
Last 12 Months: 56.9%
This Year: 36.9%
Precipitation Concentration Index (PCI) ℹ️
Last 12 Months: 24.3
Historical Average: 20.7
Percentile Rank of Last 12 Months ℹ️
High: 74th percentile
Low: 22nd percentile
Rain: 30th percentile
Change in Variance ℹ️
High: +9.7%
Low: +1.9%
Intraday: -17.1%
Data Coverage
85.6%
First Year of Data
1973
Station Location
Historical Weather Records
| Max High | Avg High | Min High | Max Avg | Avg Avg | Min Avg | Max Low | Avg Low | Min Low | Max Precipitation | Avg Precipitation | Max Snow | Avg Snow | |
|---|---|---|---|---|---|---|---|---|---|---|---|---|---|
| Record | 102.92 °F | — | 68.56 °F | 87.62 °F | — | 61.70 °F | 81.55 °F | — | 54.32 °F | 2.98 in | — | — | — |
| January | 92.84 °F | 76.49 °F | 69.10 °F | 81.14 °F | 72.75 °F | 65.48 °F | 75.74 °F | 69.75 °F | 54.86 °F | 2.98 in | 0.02 in | — | — |
| February | 100.40 °F | 76.12 °F | 68.56 °F | 83.12 °F | 72.06 °F | 66.02 °F | 78.08 °F | 68.86 °F | 54.32 °F | 1.76 in | 0.02 in | — | — |
| March | 96.44 °F | 76.83 °F | 70.23 °F | 85.10 °F | 72.56 °F | 61.70 °F | 77.54 °F | 68.98 °F | 57.74 °F | 1.47 in | 0.01 in | — | — |
| April | 96.80 °F | 77.51 °F | 71.20 °F | 87.44 °F | 73.52 °F | 69.26 °F | 80.96 °F | 70.08 °F | 57.20 °F | 0.52 in | 0.01 in | — | — |
| May | 97.52 °F | 78.63 °F | 72.10 °F | 86.90 °F | 74.50 °F | 69.08 °F | 78.98 °F | 71.21 °F | 62.96 °F | 0.25 in | 0.00 in | — | — |
| June | 94.10 °F | 80.11 °F | 72.36 °F | 84.92 °F | 75.91 °F | 71.67 °F | 80.24 °F | 72.50 °F | 63.14 °F | 0.18 in | 0.00 in | — | — |
| July | 93.20 °F | 81.42 °F | 74.32 °F | 84.20 °F | 77.80 °F | 72.77 °F | 80.06 °F | 74.96 °F | 66.56 °F | 0.74 in | 0.01 in | — | — |
| August | 95.00 °F | 83.27 °F | 77.07 °F | 86.72 °F | 79.85 °F | 75.52 °F | 81.52 °F | 77.09 °F | 69.26 °F | 1.82 in | 0.08 in | — | — |
| September | 96.44 °F | 83.69 °F | 77.67 °F | 85.64 °F | 80.45 °F | 74.84 °F | 81.55 °F | 77.74 °F | 70.70 °F | 2.32 in | 0.10 in | — | — |
| October | 97.88 °F | 83.81 °F | 76.86 °F | 87.62 °F | 80.12 °F | 75.02 °F | 81.37 °F | 77.14 °F | 66.92 °F | 1.31 in | 0.05 in | — | — |
| November | 102.92 °F | 81.81 °F | 73.49 °F | 84.56 °F | 78.16 °F | 72.57 °F | 80.22 °F | 75.26 °F | 65.48 °F | 2.03 in | 0.03 in | — | — |
| December | 92.12 °F | 78.51 °F | 71.83 °F | 82.76 °F | 75.12 °F | 69.44 °F | 77.92 °F | 72.38 °F | 63.50 °F | 1.59 in | 0.03 in | — | — |
Data Visualisations
Remove WatermarksCurrent Year Climate Trends vs Historical


Max Temperature this Year | 1 of 6
Climate 12-Month Moving Averages


Max Temperature 12-Month MA | 1 of 6
Daily Data Points and Averages Throughout the Year


Average Max Temperature Throughout Year | 1 of 5
