Climate for Station: Flyvestation Aalborg, Northern Jutland, Denmark
Loading live weather...
Climate Analysis & Overview
Flyvestation Aalborg experiences a warming trend over the long term, with both highs and lows showing increases. However, the last decade has seen a cooling trend, particularly in nighttime temperatures. Precipitation has become more evenly distributed over time, indicating a shift in rainfall patterns.
Köppen Climate Context
Flyvestation Aalborg is situated in Denmark's Region Nordjylland, characterised by a temperate oceanic climate (Cfb) under the Köppen classification. This climate type is marked by mild summers and cool, wet winters, influenced by its proximity to the North Sea. The station's geographical location near the coast ensures a moderating effect, leading to relatively stable temperatures year-round.
Long-term Warming Amidst Short-term Cooling
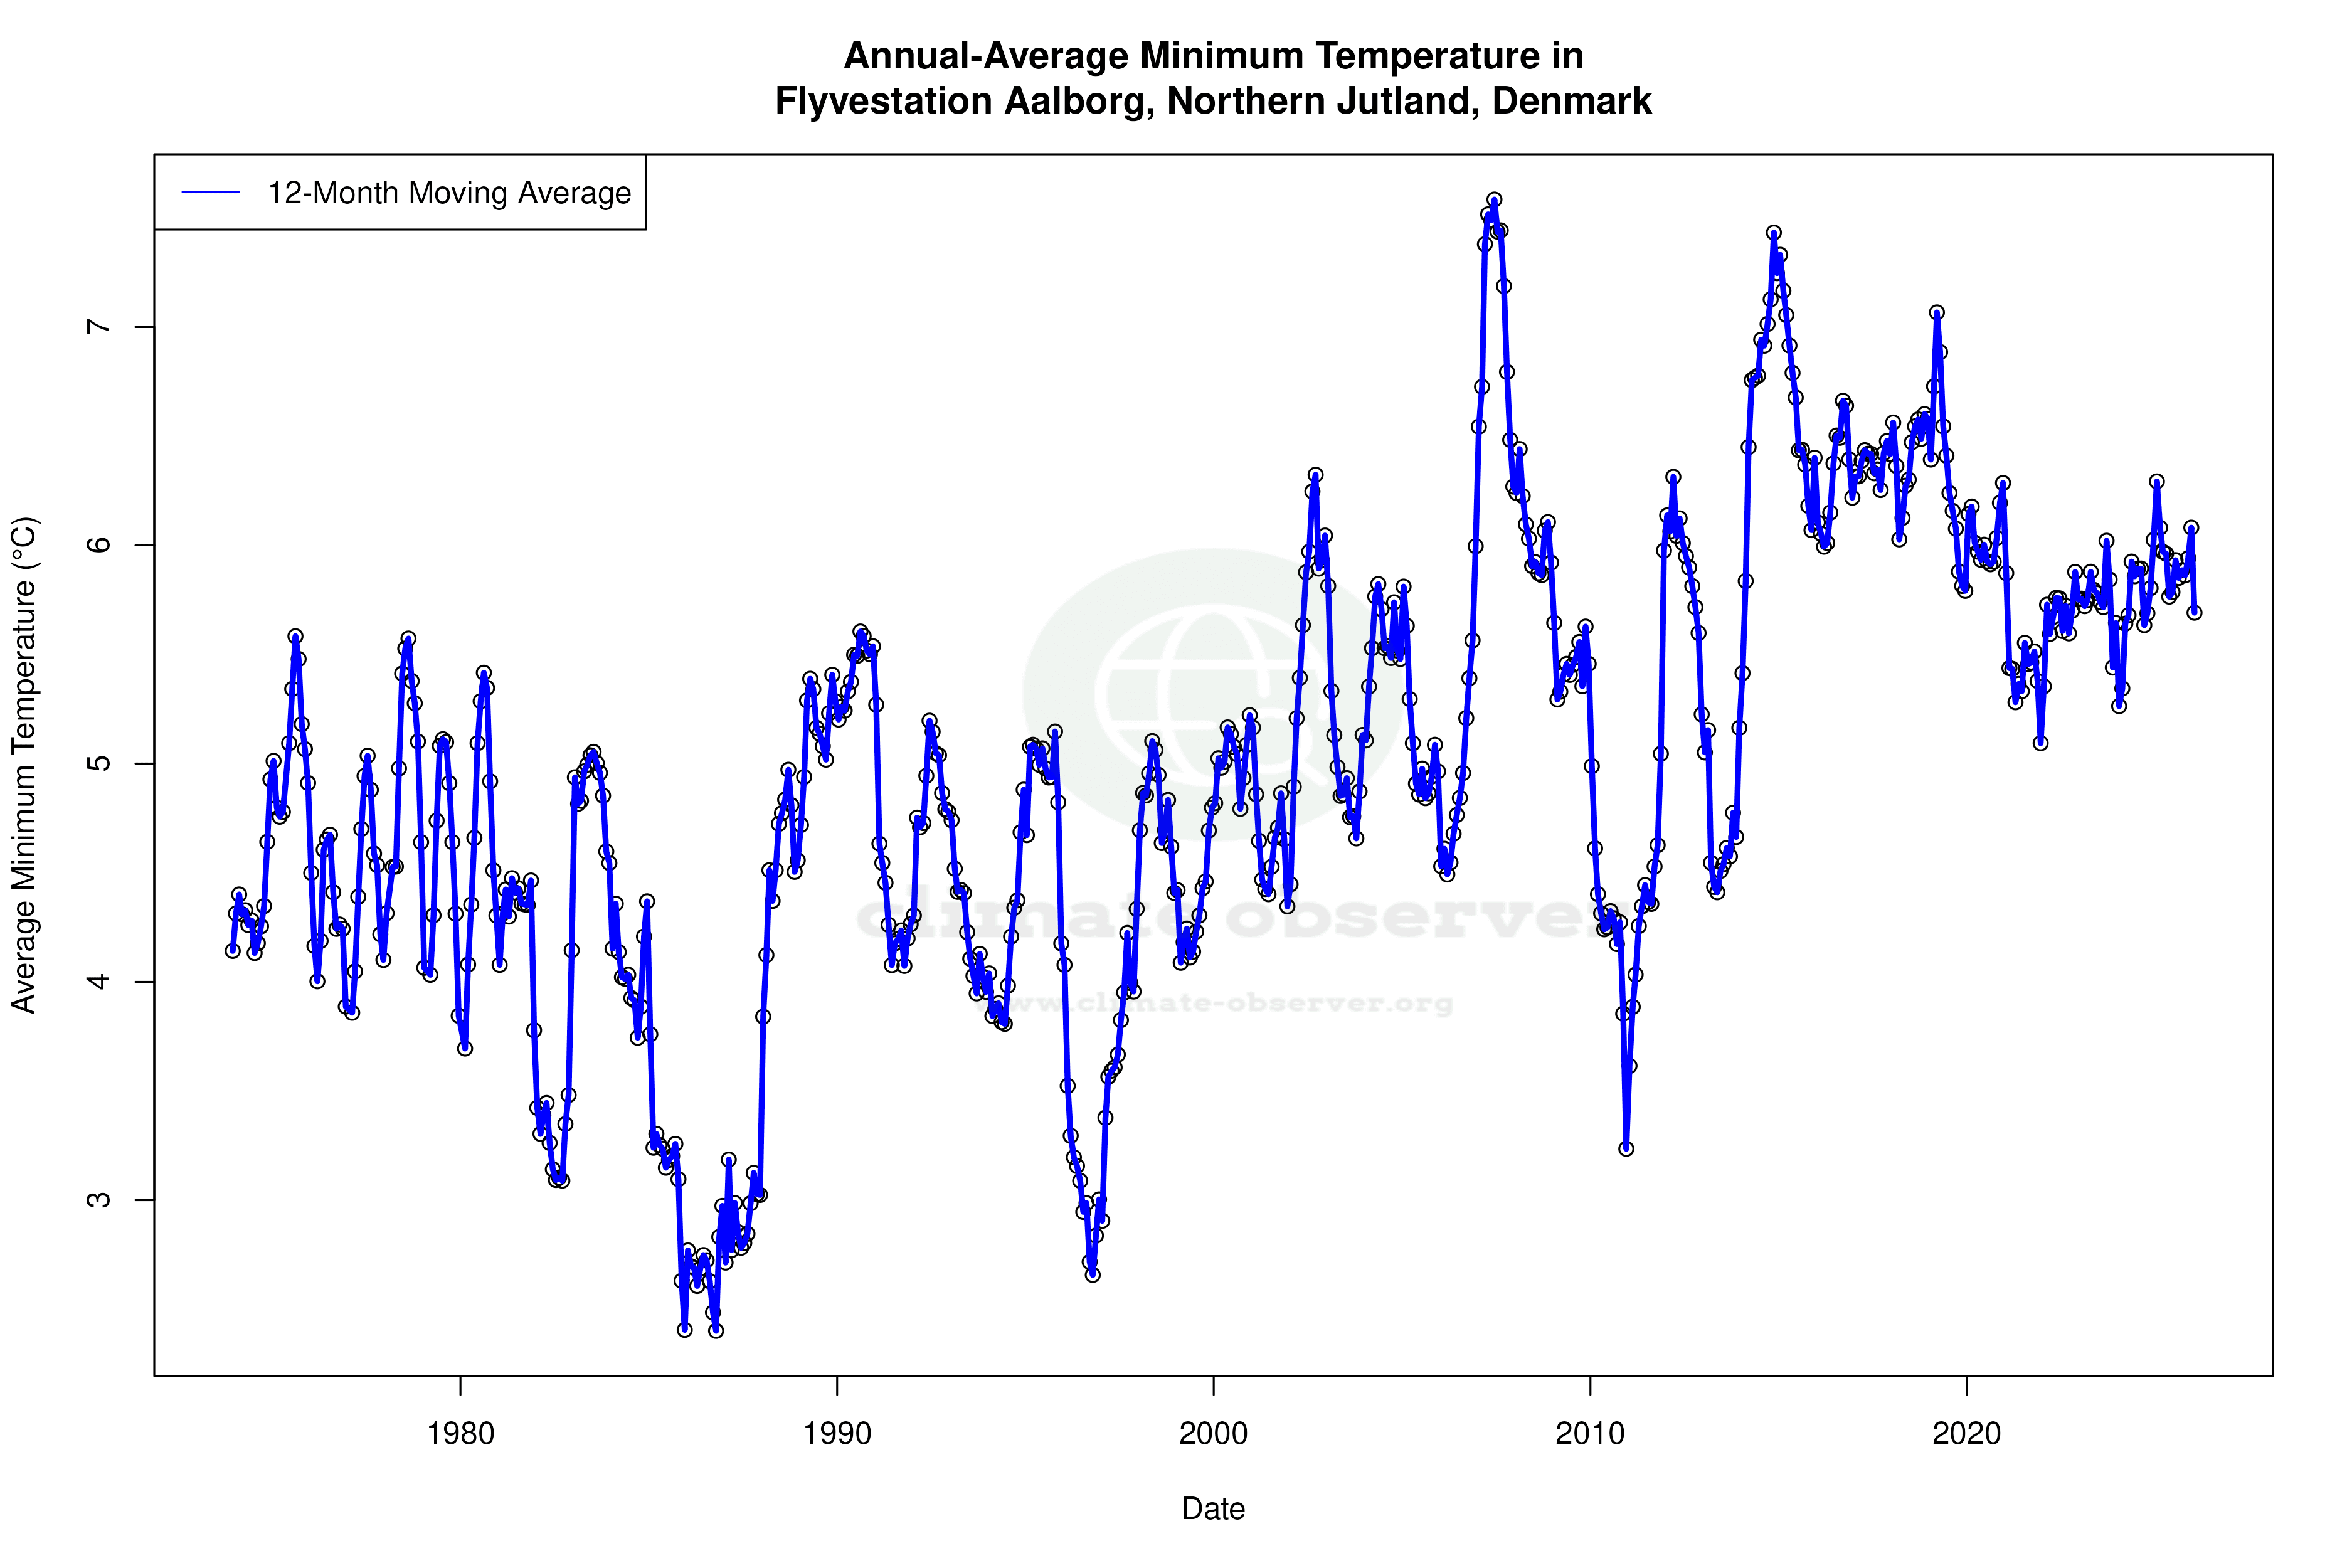
Over the all-time period, Flyvestation Aalborg has experienced a warming trend, with high temperatures rising by 0.45°C (0.81°F) and low temperatures increasing by 0.48°C (0.86°F). This suggests a general warming climate, aligning with Denmark's national climate goals to monitor and adapt to climate change impacts. Contrastingly, the past decade has seen a cooling trend, with high temperatures decreasing by 0.23°C (0.41°F) and low temperatures falling more sharply by 0.85°C (1.53°F). This short-term cooling, especially in nighttime lows, could be indicative of regional climatic variability or specific localised factors.
Temperature Extremes and Records
The station has recorded a maximum temperature of 34.4°C (93.9°F) and a minimum of -23.8°C (-10.8°F). These extremes highlight the potential for significant temperature fluctuations, a characteristic feature of the temperate oceanic climate. Such variability necessitates adaptive strategies to mitigate potential impacts on infrastructure and agriculture.
Evolving Precipitation Patterns
The Precipitation Concentration Index (PCI) at Flyvestation Aalborg has decreased from a baseline of 11.2 to a current value of 9.5. This decline indicates that precipitation is now more evenly distributed throughout the year. While the change is not drastic, it suggests a shift towards more consistent rainfall events, which could benefit water resource management and reduce the risk of flooding associated with concentrated downpours.
Regional Implications and Future Outlook
The climate trends at Flyvestation Aalborg are reflective of broader regional patterns in Denmark, where climate adaptation strategies are increasingly prioritised. The warming all-time trends align with global climate change observations, while the recent cooling may prompt further investigation into localised climatic influences. As Denmark continues to pursue its climate goals, understanding these nuanced patterns is crucial for effective policy-making and environmental management.
Station Statistics
10-Year Trend
High: -0.68 °F/decade
Low: -1.52 °F/decade
Rain: -0.003 in/decade
25-Year Trend
High: +0.48 °F/decade
Low: +0.57 °F/decade
Rain: -0.008 in/decade
50-Year Trend
High: +0.94 °F/decade
Low: +0.98 °F/decade
Rain: -0.002 in/decade
All-Time Trend
High: +0.80 °F/decade
Low: +0.87 °F/decade
Rain: -0.001 in/decade
Percentage Above-Average Days
Last 12 Months: 51.4%
This Year: 42.3%
Precipitation Concentration Index (PCI) ℹ️
Last 12 Months: 9.6
Historical Average: 10.7
Percentile Rank of Last 12 Months ℹ️
High: 80th percentile
Low: 74th percentile
Rain: 4th percentile
Change in Variance ℹ️
High: -8.5%
Low: -8.7%
Intraday: -7.6%
Data Coverage
62.6%
First Year of Data
1940
Station Location
Historical Weather Records
| Max High | Avg High | Min High | Max Avg | Avg Avg | Min Avg | Max Low | Avg Low | Min Low | Max Precipitation | Avg Precipitation | Max Snow | Avg Snow | |
|---|---|---|---|---|---|---|---|---|---|---|---|---|---|
| Record | 93.92 °F | — | 6.08 °F | 82.58 °F | — | -3.46 °F | 69.62 °F | — | -10.84 °F | 2.67 in | — | — | — |
| January | 52.52 °F | 37.65 °F | 6.08 °F | 49.10 °F | 33.20 °F | -3.46 °F | 45.14 °F | 28.98 °F | -10.84 °F | 0.87 in | 0.07 in | — | — |
| February | 57.20 °F | 38.02 °F | 12.20 °F | 49.64 °F | 33.45 °F | 3.02 °F | 47.12 °F | 29.01 °F | -2.92 °F | 1.10 in | 0.06 in | — | — |
| March | 67.46 °F | 43.25 °F | 21.74 °F | 56.12 °F | 37.36 °F | 5.36 °F | 48.02 °F | 31.79 °F | -3.28 °F | 0.79 in | 0.05 in | — | — |
| April | 77.90 °F | 51.93 °F | 32.00 °F | 62.24 °F | 44.26 °F | 22.46 °F | 54.50 °F | 36.79 °F | 17.60 °F | 0.87 in | 0.05 in | — | — |
| May | 81.86 °F | 60.78 °F | 41.00 °F | 71.96 °F | 52.63 °F | 36.68 °F | 63.32 °F | 44.29 °F | 28.22 °F | 1.14 in | 0.06 in | — | — |
| June | 87.62 °F | 66.53 °F | 49.82 °F | 78.26 °F | 58.72 °F | 44.24 °F | 64.04 °F | 50.68 °F | 30.20 °F | 1.65 in | 0.08 in | — | — |
| July | 93.92 °F | 70.29 °F | 56.48 °F | 82.58 °F | 62.39 °F | 52.16 °F | 69.62 °F | 54.76 °F | 39.20 °F | 1.50 in | 0.08 in | — | — |
| August | 93.20 °F | 69.60 °F | 55.58 °F | 78.44 °F | 61.67 °F | 50.00 °F | 68.72 °F | 54.31 °F | 33.62 °F | 1.96 in | 0.08 in | — | — |
| September | 82.58 °F | 62.48 °F | 46.94 °F | 69.26 °F | 55.80 °F | 41.72 °F | 65.84 °F | 49.36 °F | 31.10 °F | 2.67 in | 0.09 in | — | — |
| October | 72.50 °F | 53.79 °F | 37.76 °F | 65.12 °F | 48.49 °F | 30.02 °F | 60.44 °F | 42.90 °F | 21.20 °F | 1.22 in | 0.09 in | — | — |
| November | 61.52 °F | 45.48 °F | 24.08 °F | 57.92 °F | 41.24 °F | 15.08 °F | 54.86 °F | 36.37 °F | 6.80 °F | 1.19 in | 0.08 in | — | — |
| December | 59.00 °F | 39.93 °F | 14.00 °F | 52.70 °F | 36.11 °F | 3.74 °F | 49.64 °F | 31.30 °F | -9.40 °F | 0.91 in | 0.07 in | — | — |
Data Visualisations
Remove WatermarksCurrent Year Climate Trends vs Historical


Max Temperature this Year | 1 of 6
Climate 12-Month Moving Averages


Max Temperature 12-Month MA | 1 of 6
Daily Data Points and Averages Throughout the Year


Average Max Temperature Throughout Year | 1 of 5
