Climate for Station: Alexandria Intl, Alexandria, Egypt
Loading live weather...
Climate Analysis & Overview
Alexandria International's climate profile reveals a consistent warming trend, with notable increases in both high and low temperatures over the past decade. Precipitation patterns have shifted towards more even distribution, indicative of changing climate dynamics in the region. These changes align with Egypt's broader climate goals to adapt to and mitigate climate change impacts.
Warming Trends in Alexandria
Alexandria, situated at 31.18°N, 29.95°E, experiences a hot desert climate (Köppen classification BWh), characterised by dry, hot summers and mild, wetter winters. The city's proximity to the Mediterranean Sea significantly moderates its climate, providing a buffer against extreme temperatures. Over the past decade, Alexandria has experienced a warming trend, with average high temperatures increasing by 0.11°C (0.20°F) and average lows rising by a more pronounced 1.11°C (2.00°F). These figures indicate a stronger warming effect during the night, which could be attributed to urban heat island effects or changes in atmospheric conditions.
Long-term Thermal Shifts
Examining the all-time temperature trends, Alexandria shows a persistent warming pattern. The all-time high temperatures have increased by 0.11°C (0.19°F), while the low temperatures have risen by 0.37°C (0.67°F). This consistent rise in both high and low temperatures highlights a broader climatic shift that aligns with global warming trends. The record high temperature in Alexandria stands at 45.01°C (113.02°F), while the lowest recorded temperature is 0.90°C (33.62°F), underscoring the city's capacity for extreme temperature variations despite its generally moderate climate.
Precipitation Patterns Evolving
The Precipitation Concentration Index (PCI) is a measure of how precipitation is distributed throughout the year. A decrease in PCI from a baseline of 26.2 to a current value of 13.3 indicates a significant shift towards more evenly distributed rainfall events. This change suggests a reduction in the intensity and concentration of rainfall, which could be beneficial for reducing flood risks and improving water resource management in the region. Such changes in precipitation patterns are crucial for Alexandria, as the city is vulnerable to sea-level rise and flooding.
Implications for Regional Climate Goals
The observed climatic changes in Alexandria are in line with Egypt's national climate strategy, which focuses on adaptation and resilience. The warming trends and evolving precipitation patterns necessitate adaptive measures to safeguard infrastructure and communities. Recent weather events in Egypt, such as intense heatwaves and unexpected rainfall, further highlight the need for robust climate action plans. Alexandria's climate data serves as a microcosm of the broader challenges and opportunities faced by Egypt in addressing climate change impacts.
Conclusion
The climate profile of Alexandria International provides critical insights into the ongoing climatic shifts in the region. The consistent warming trends and changes in precipitation distribution underscore the importance of continued monitoring and adaptation efforts. As Egypt strives to meet its climate goals, understanding these localised changes is vital for informed decision-making and sustainable development.
Station Statistics
10-Year Trend
High: +0.18 °C/decade
Low: +1.03 °C/decade
Rain: -0.57 mm/decade
25-Year Trend
High: +0.55 °C/decade
Low: +0.70 °C/decade
Rain: +0.08 mm/decade
50-Year Trend
High: +0.29 °C/decade
Low: +0.59 °C/decade
Rain: +0.04 mm/decade
All-Time Trend
High: +0.11 °C/decade
Low: +0.37 °C/decade
Rain: +0.02 mm/decade
Percentage Above-Average Days
Last 12 Months: 59.2%
This Year: 71.1%
Precipitation Concentration Index (PCI) ℹ️
Last 12 Months: 20.5
Historical Average: 27.0
Percentile Rank of Last 12 Months ℹ️
High: 79th percentile
Low: 96th percentile
Rain: 5th percentile
Change in Variance ℹ️
High: +3.0%
Low: +2.0%
Intraday: -22.8%
Data Coverage
84.8%
First Year of Data
1957
Station Location
Historical Weather Records
| Max High | Avg High | Min High | Max Avg | Avg Avg | Min Avg | Max Low | Avg Low | Min Low | Max Precipitation | Avg Precipitation | Max Snow | Avg Snow | |
|---|---|---|---|---|---|---|---|---|---|---|---|---|---|
| Record | 45.0 °C | — | 10.0 °C | 33.2 °C | — | 8.1 °C | 28.0 °C | — | 0.9 °C | 111.6 mm | — | — | — |
| January | 29.6 °C | 18.6 °C | 12.0 °C | 22.8 °C | 14.0 °C | 8.1 °C | 16.1 °C | 9.6 °C | 0.9 °C | 36.1 mm | 1.7 mm | — | — |
| February | 31.1 °C | 19.2 °C | 10.0 °C | 21.8 °C | 14.4 °C | 8.2 °C | 16.9 °C | 9.6 °C | 1.2 °C | 35.1 mm | 1.1 mm | — | — |
| March | 36.8 °C | 21.3 °C | 11.8 °C | 26.6 °C | 16.3 °C | 8.8 °C | 21.0 °C | 11.4 °C | 2.3 °C | 111.6 mm | 0.6 mm | — | — |
| April | 40.8 °C | 24.6 °C | 15.8 °C | 29.4 °C | 19.1 °C | 12.1 °C | 21.7 °C | 14.0 °C | 3.6 °C | 48.4 mm | 0.2 mm | — | — |
| May | 45.0 °C | 27.3 °C | 20.0 °C | 32.8 °C | 22.0 °C | 15.3 °C | 25.0 °C | 17.1 °C | 8.5 °C | 13.0 mm | 0.0 mm | — | — |
| June | 43.4 °C | 29.6 °C | 22.4 °C | 32.6 °C | 25.0 °C | 18.9 °C | 26.2 °C | 20.8 °C | 11.6 °C | 7.7 mm | 0.0 mm | — | — |
| July | 45.0 °C | 30.8 °C | 26.0 °C | 32.4 °C | 26.8 °C | 22.6 °C | 27.6 °C | 23.2 °C | 17.0 °C | 6.1 mm | 0.0 mm | — | — |
| August | 41.7 °C | 31.3 °C | 27.8 °C | 33.2 °C | 27.4 °C | 22.4 °C | 28.0 °C | 23.7 °C | 17.8 °C | 0.1 mm | 0.0 mm | — | — |
| September | 42.9 °C | 30.3 °C | 25.3 °C | 32.2 °C | 26.1 °C | 20.4 °C | 27.7 °C | 22.0 °C | 14.0 °C | 23.1 mm | 0.0 mm | — | — |
| October | 38.3 °C | 28.0 °C | 20.2 °C | 30.2 °C | 23.4 °C | 16.9 °C | 27.2 °C | 18.8 °C | 10.7 °C | 39.2 mm | 0.3 mm | — | — |
| November | 35.7 °C | 24.3 °C | 14.0 °C | 25.3 °C | 19.6 °C | 12.7 °C | 23.4 °C | 14.9 °C | 4.6 °C | 59.9 mm | 0.9 mm | — | — |
| December | 31.0 °C | 20.4 °C | 11.4 °C | 23.2 °C | 15.6 °C | 8.5 °C | 19.0 °C | 11.2 °C | 1.2 °C | 39.9 mm | 1.5 mm | — | — |
Data Visualisations
Remove WatermarksCurrent Year Climate Trends vs Historical


Max Temperature this Year | 1 of 6
Climate 12-Month Moving Averages


Max Temperature 12-Month MA | 1 of 6
Daily Data Points and Averages Throughout the Year


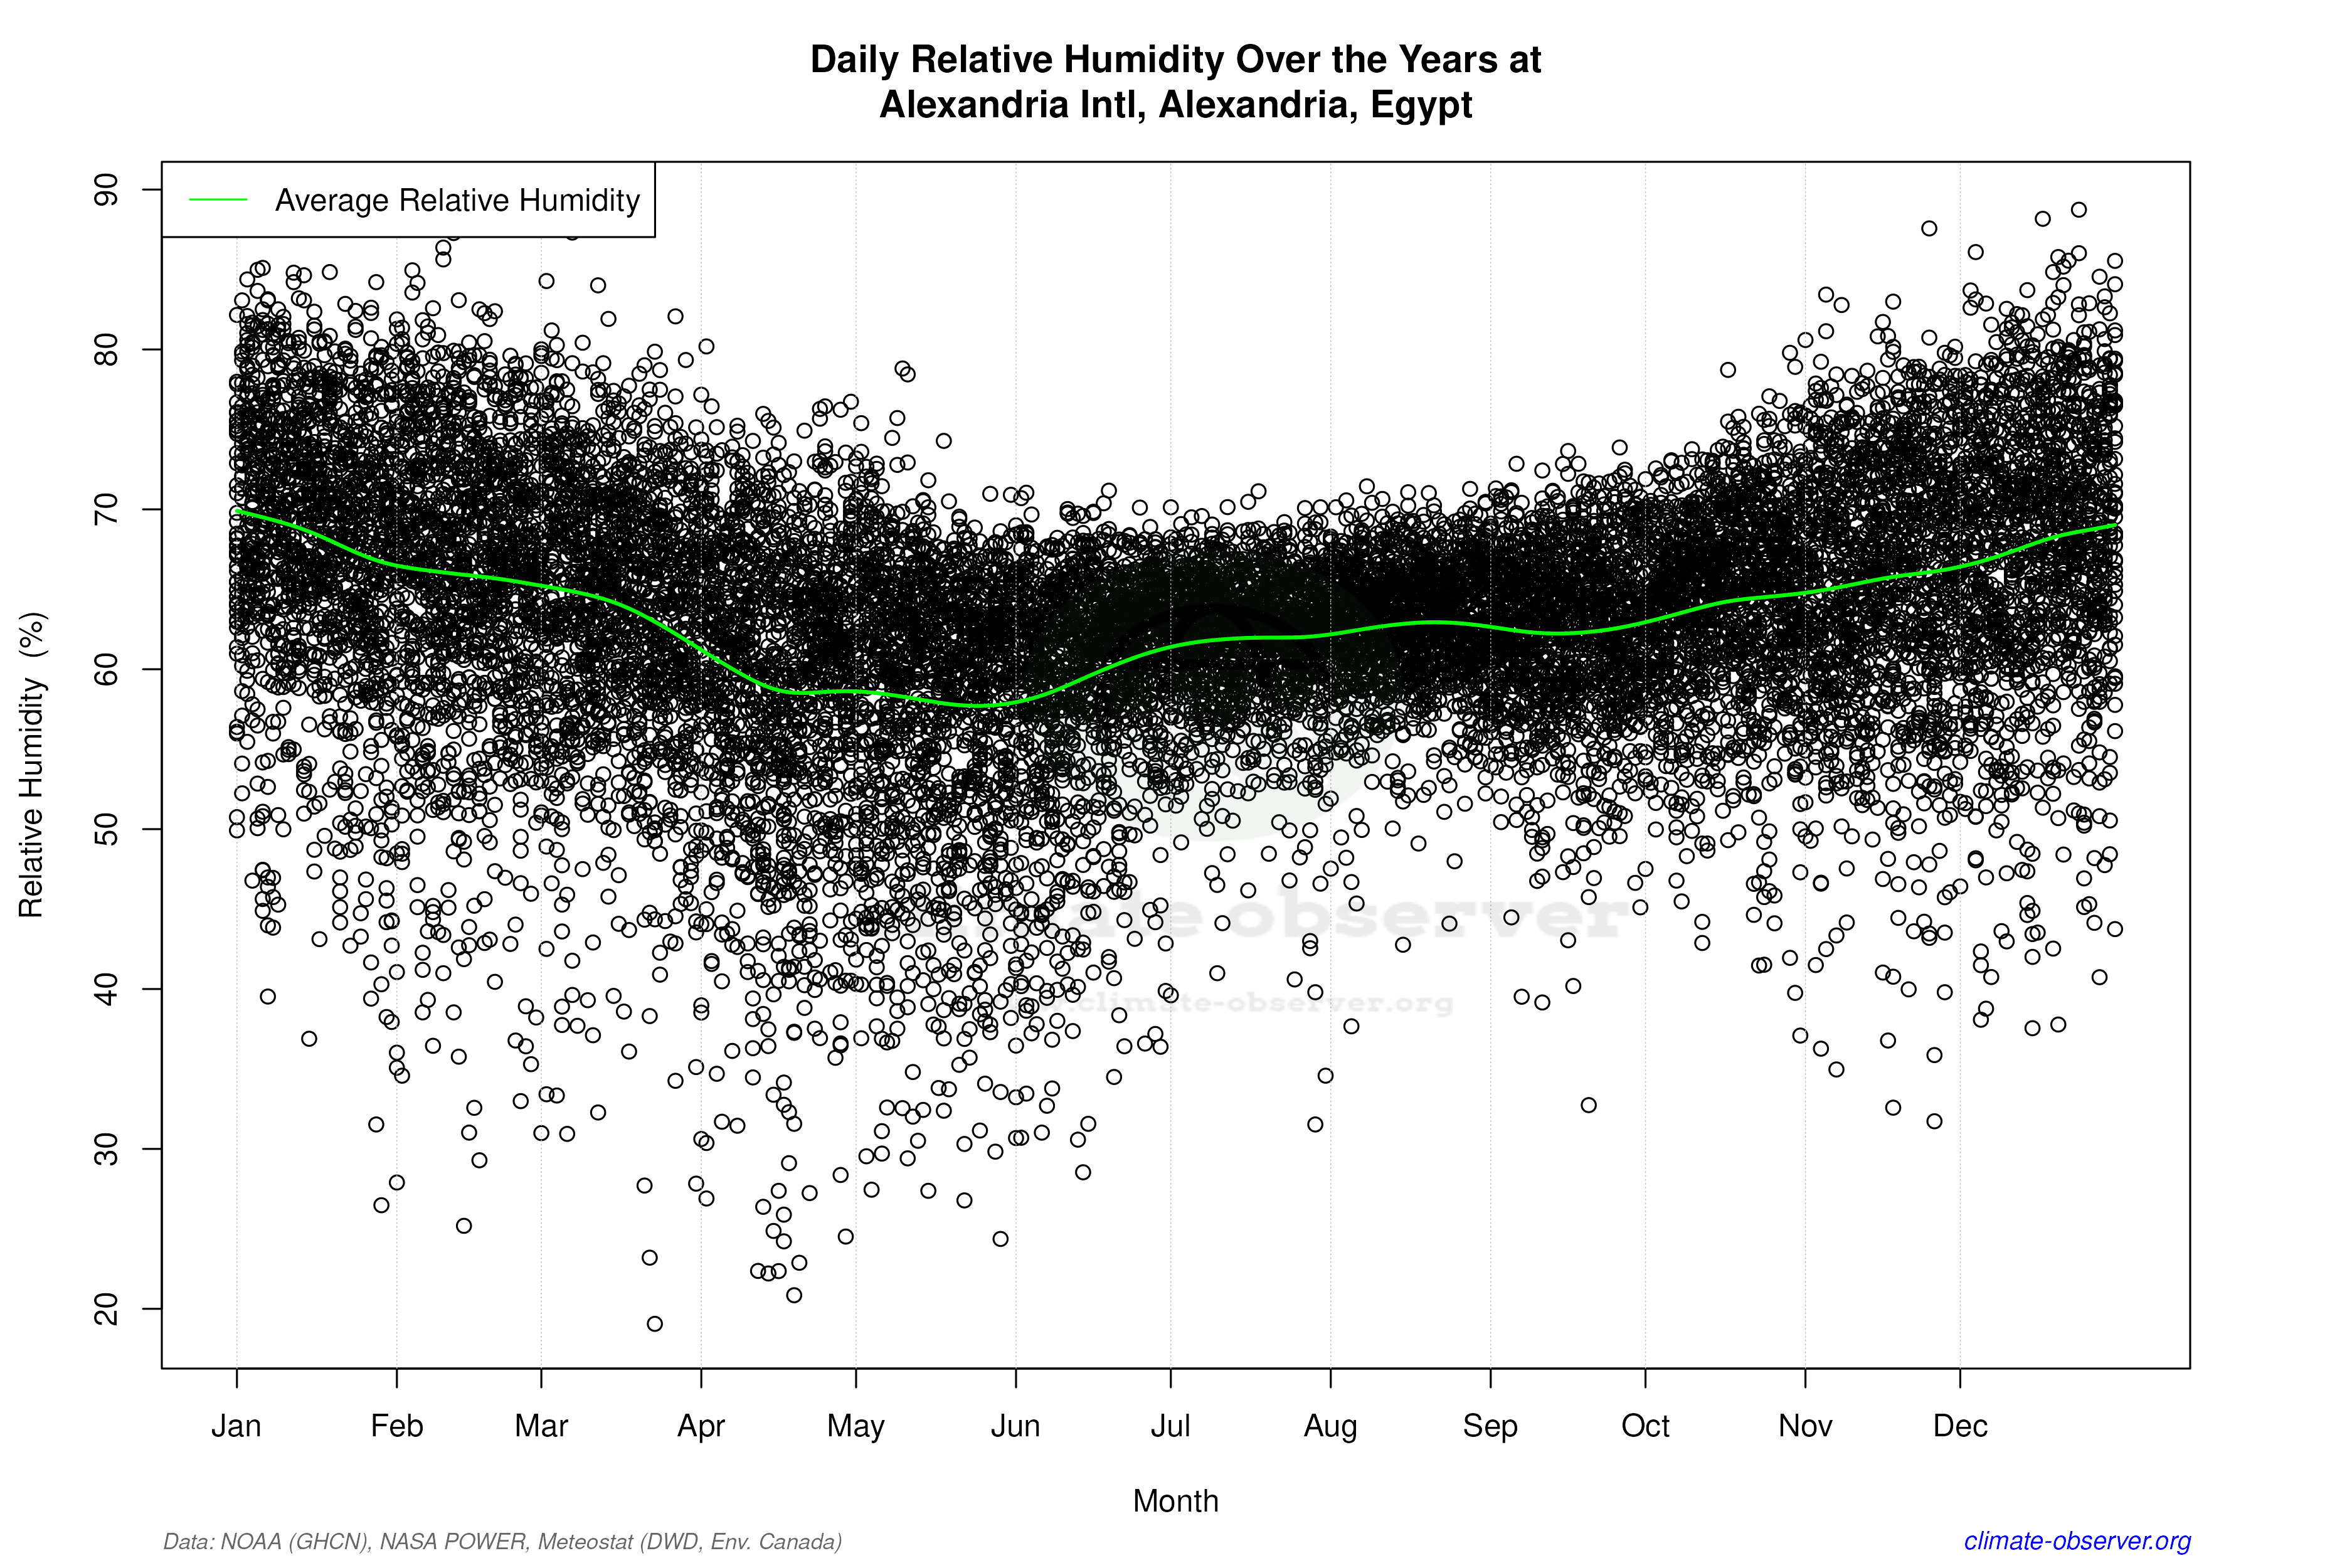

Average Max Temperature Throughout Year | 1 of 5
