Climate for Station: Kharga, New Valley, Egypt
Loading live weather...
Climate Analysis & Overview
Kharga, located in Egypt's New Valley Governorate, shows a complex climate profile with a notable divergence between short-term cooling and long-term warming trends. The region's precipitation has become more evenly distributed, reflecting a significant shift in rainfall patterns.
Desert Climate Dynamics
Kharga, situated in the heart of Egypt's Western Desert, falls under the BWh category of the Köppen climate classification, indicating a hot desert climate. This classification is characterised by extremely high temperatures during the day and cooler nights, with minimal annual precipitation. The surrounding desert landscape, devoid of significant geographical features like mountains or rivers, allows for extreme temperature fluctuations.
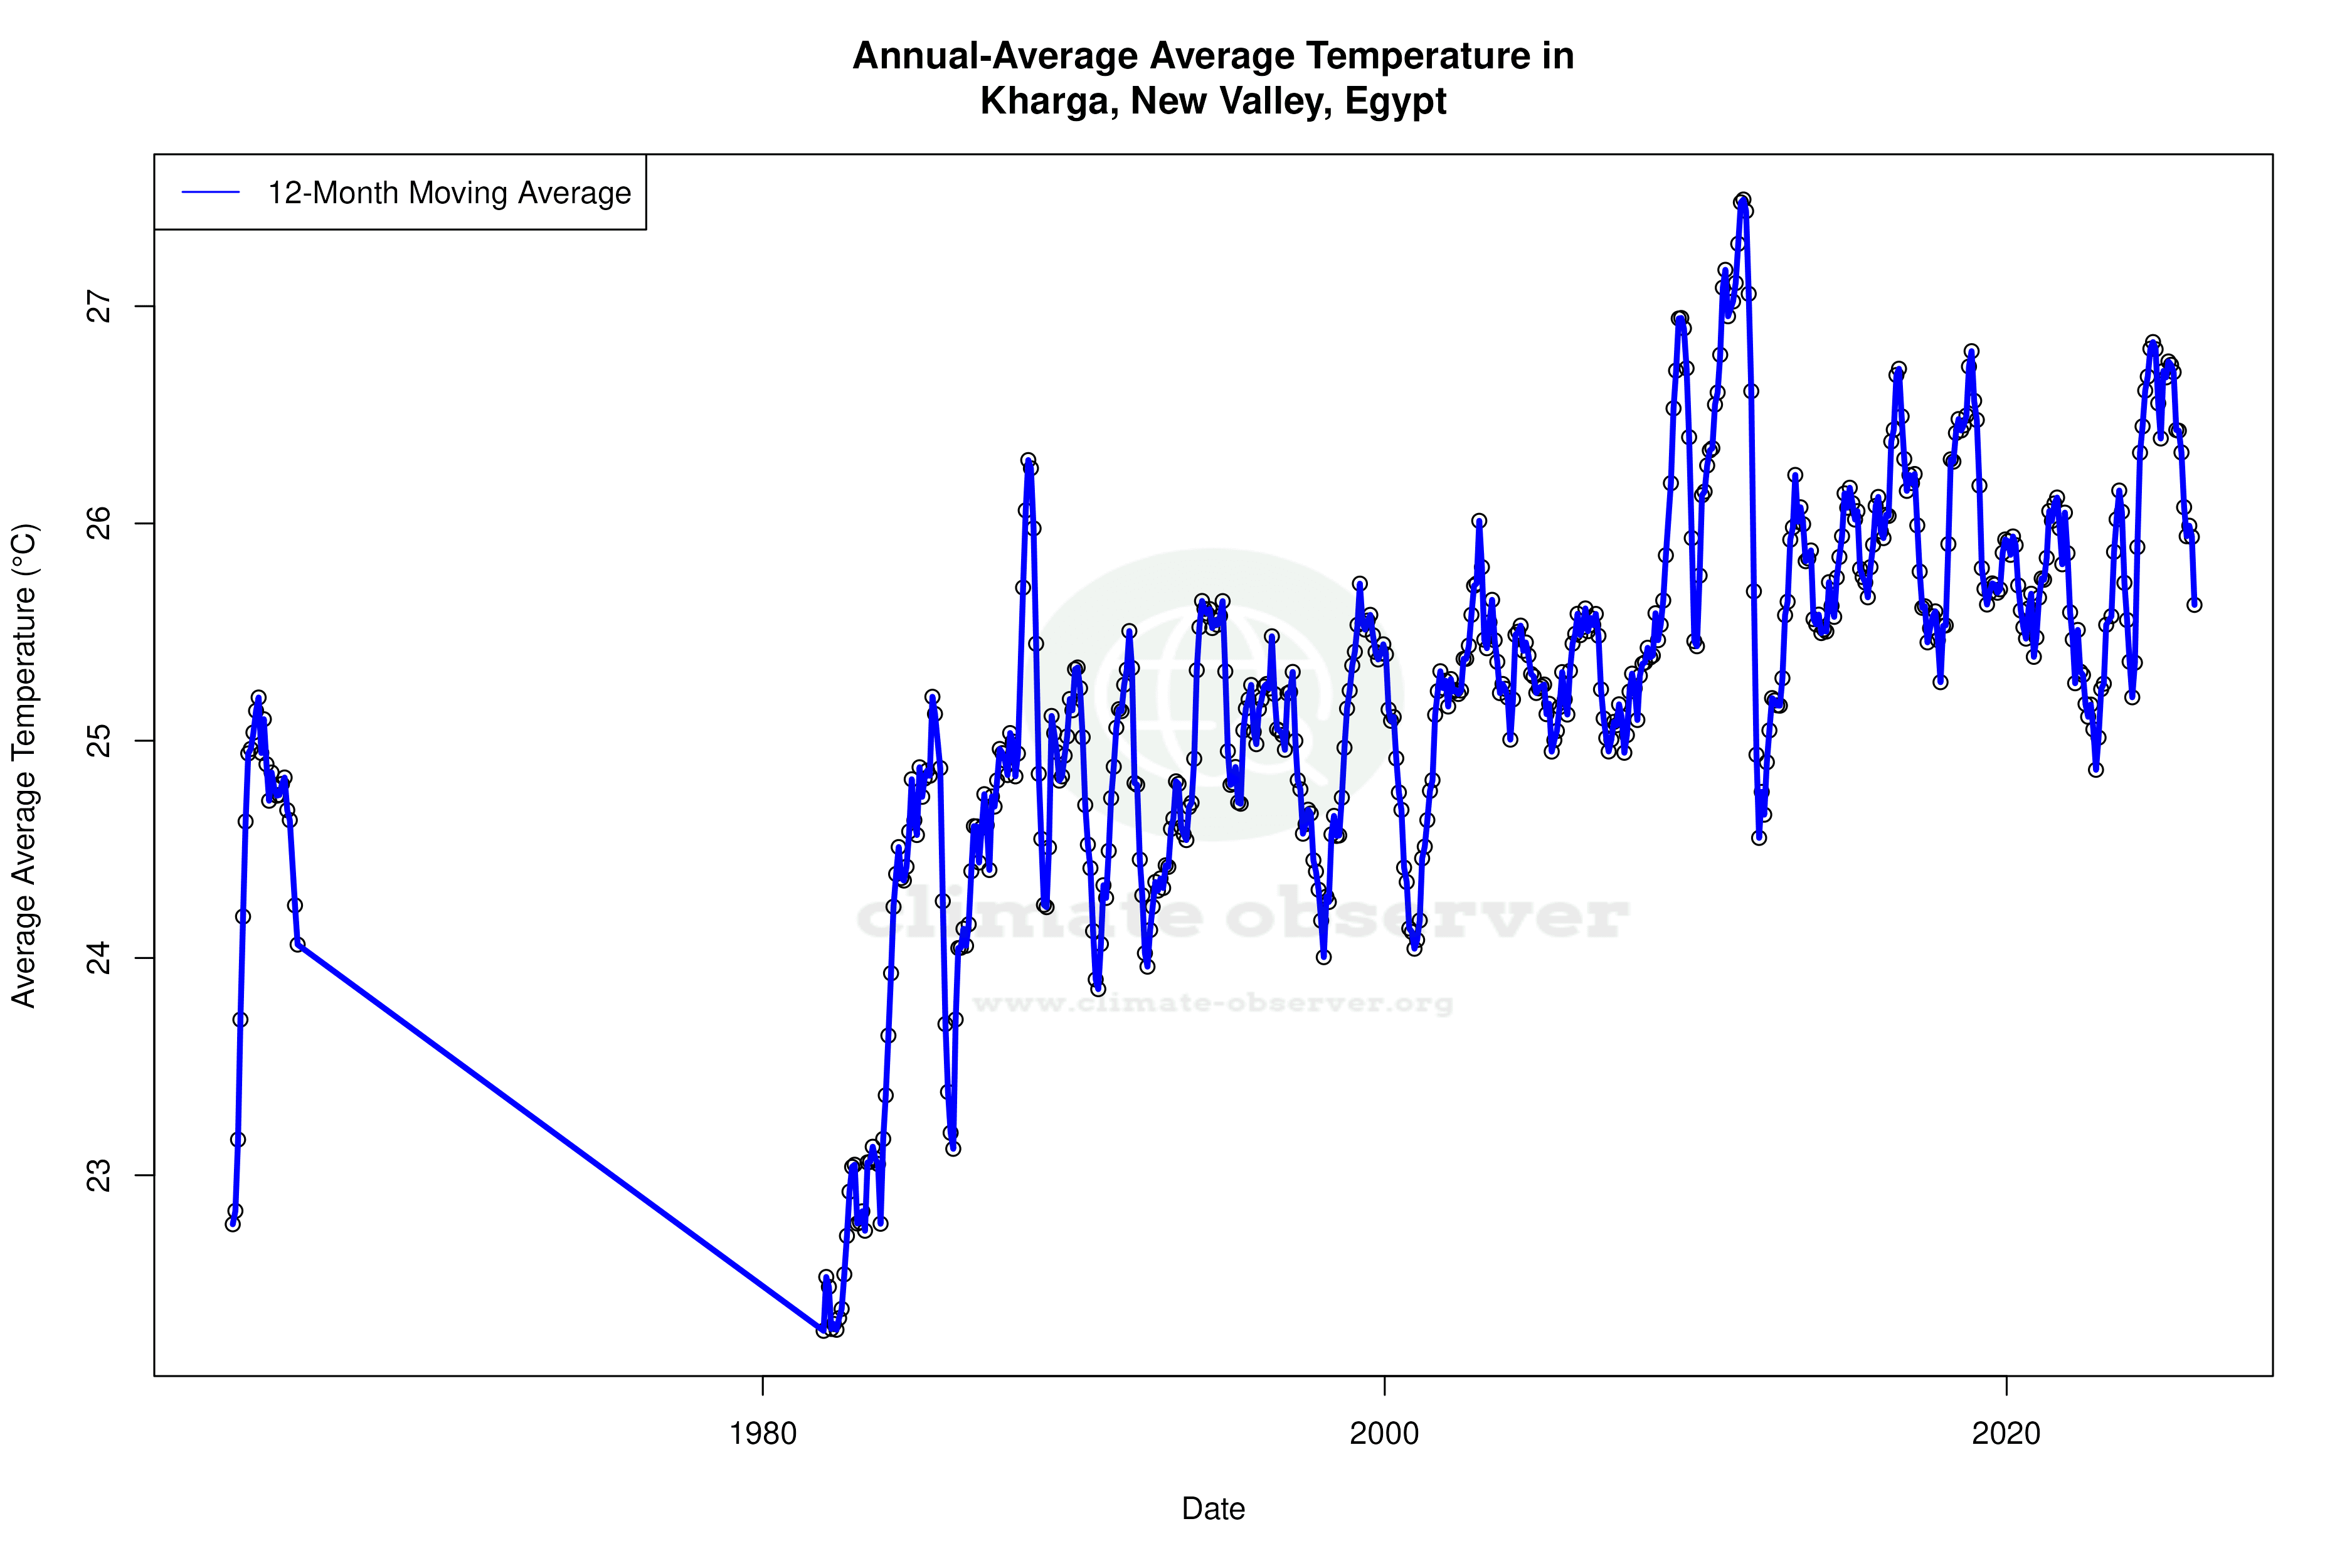
Temperature Trends: A Tale of Two Timelines
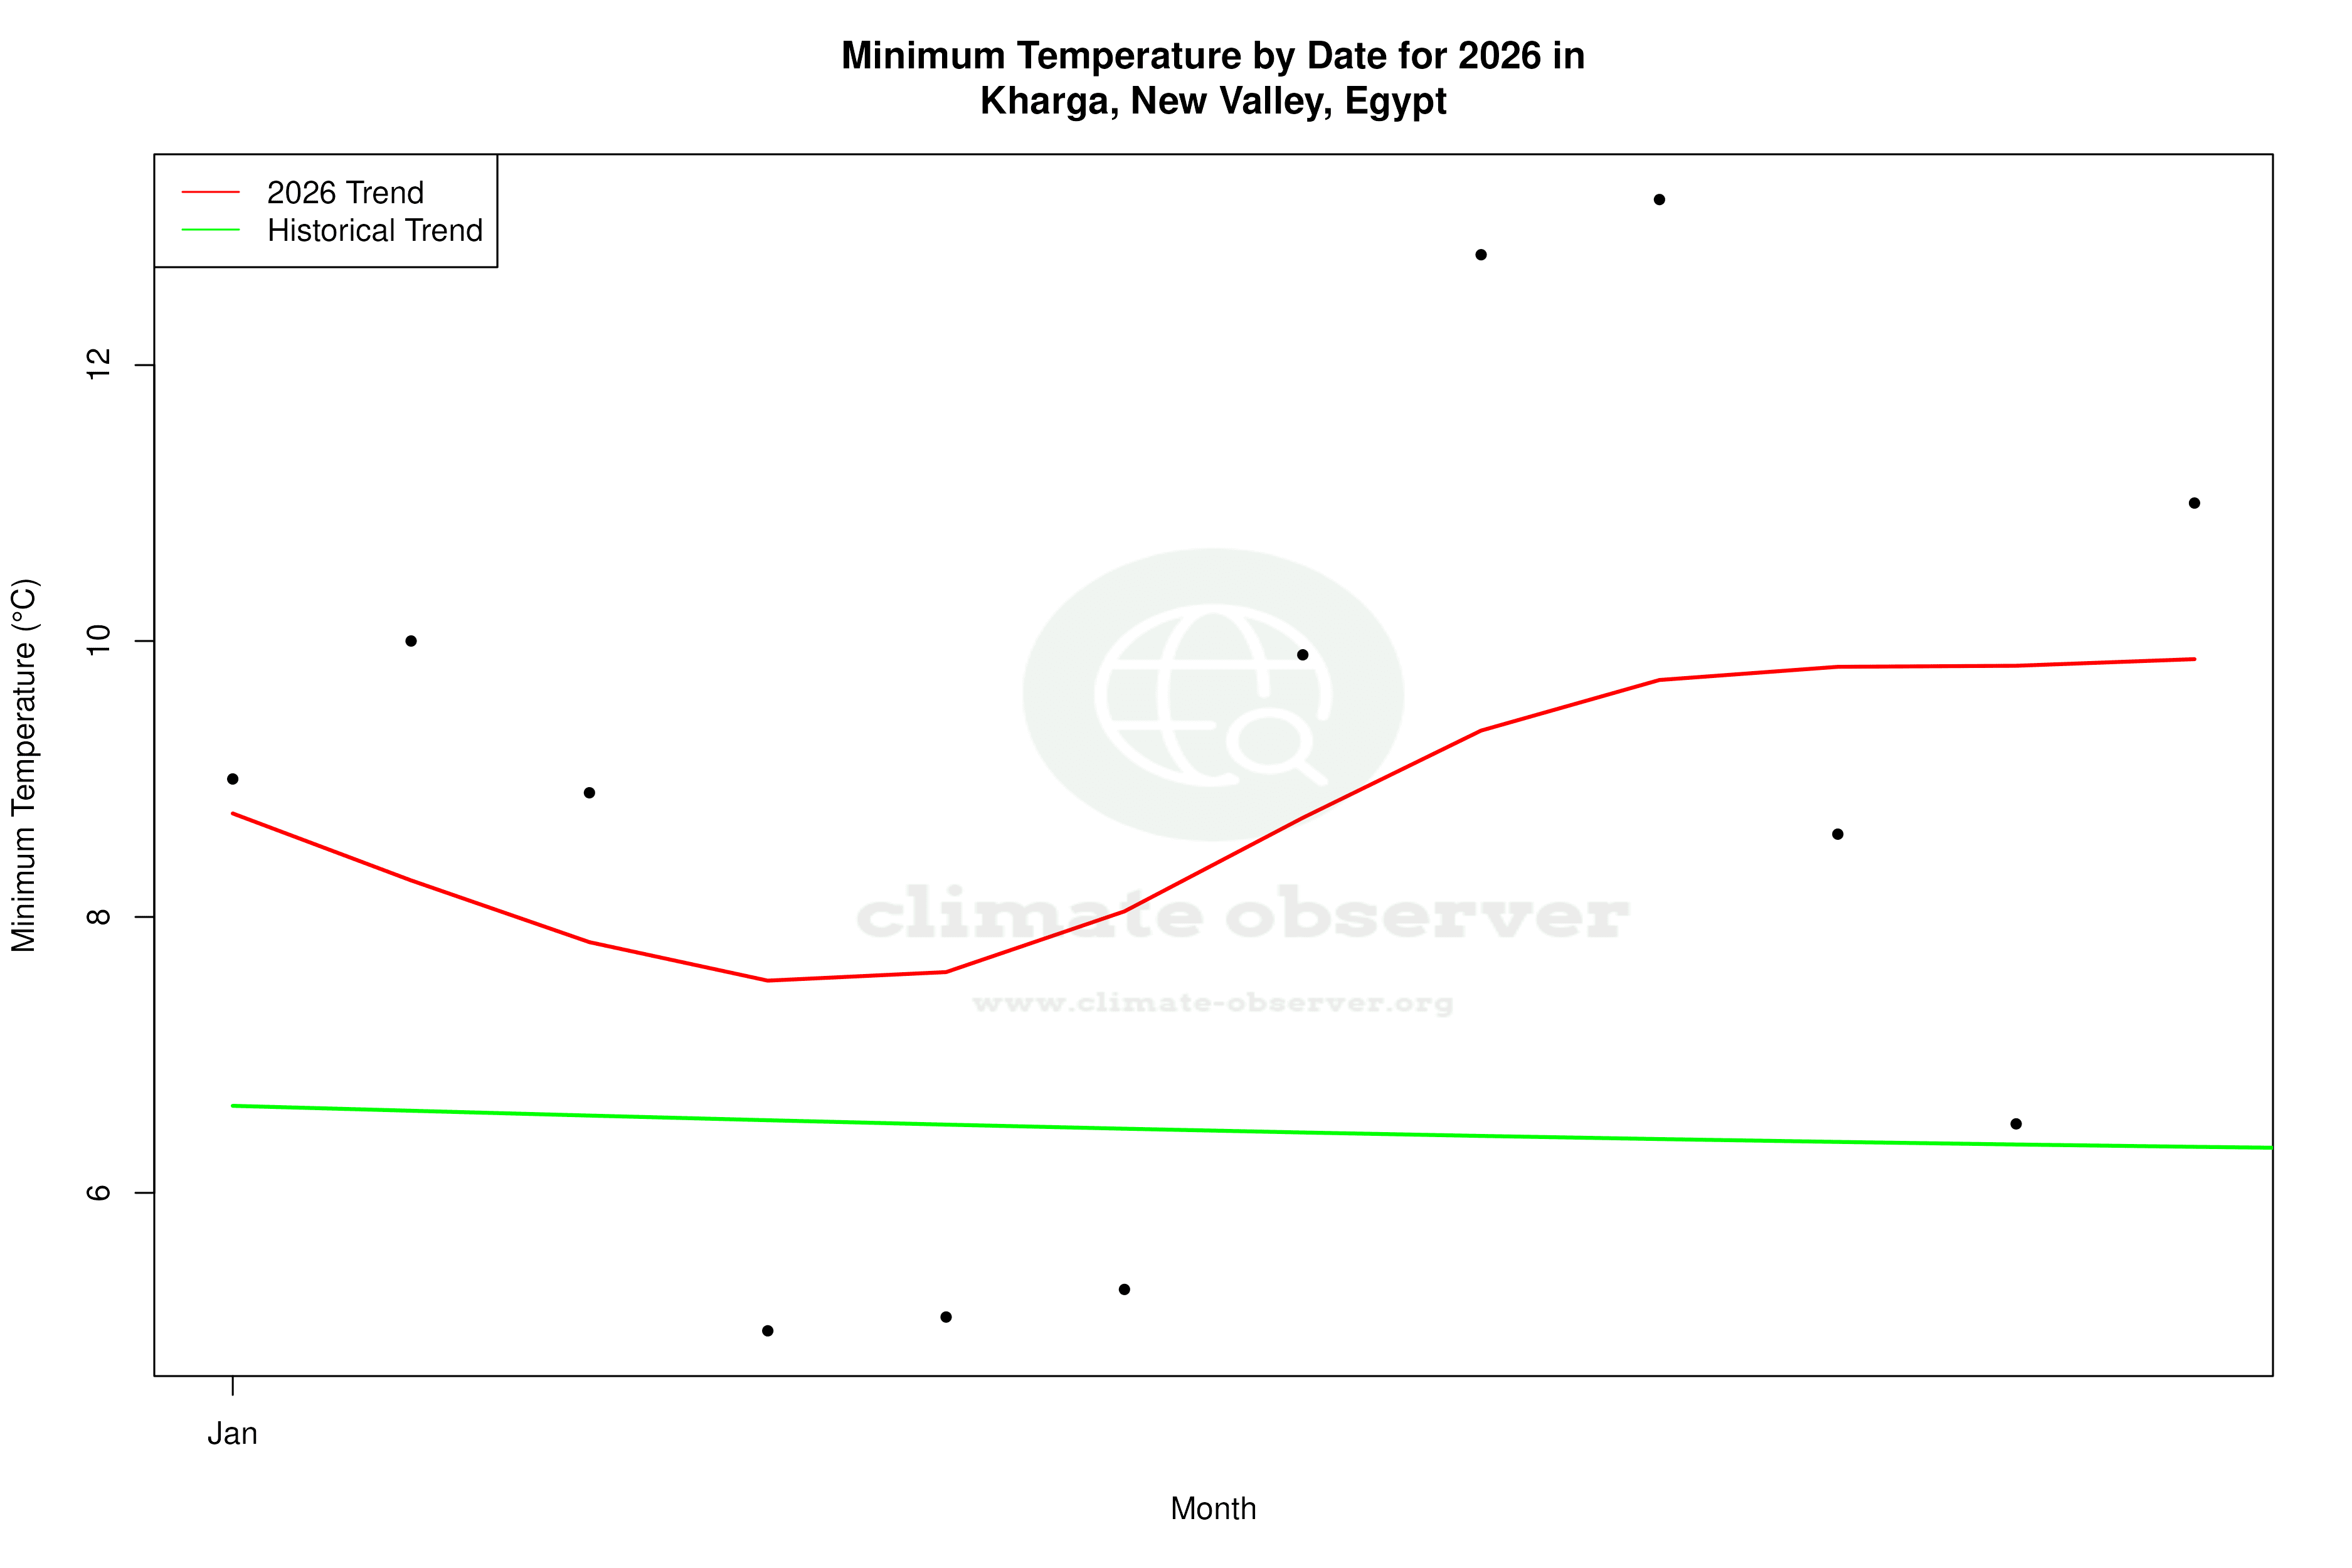
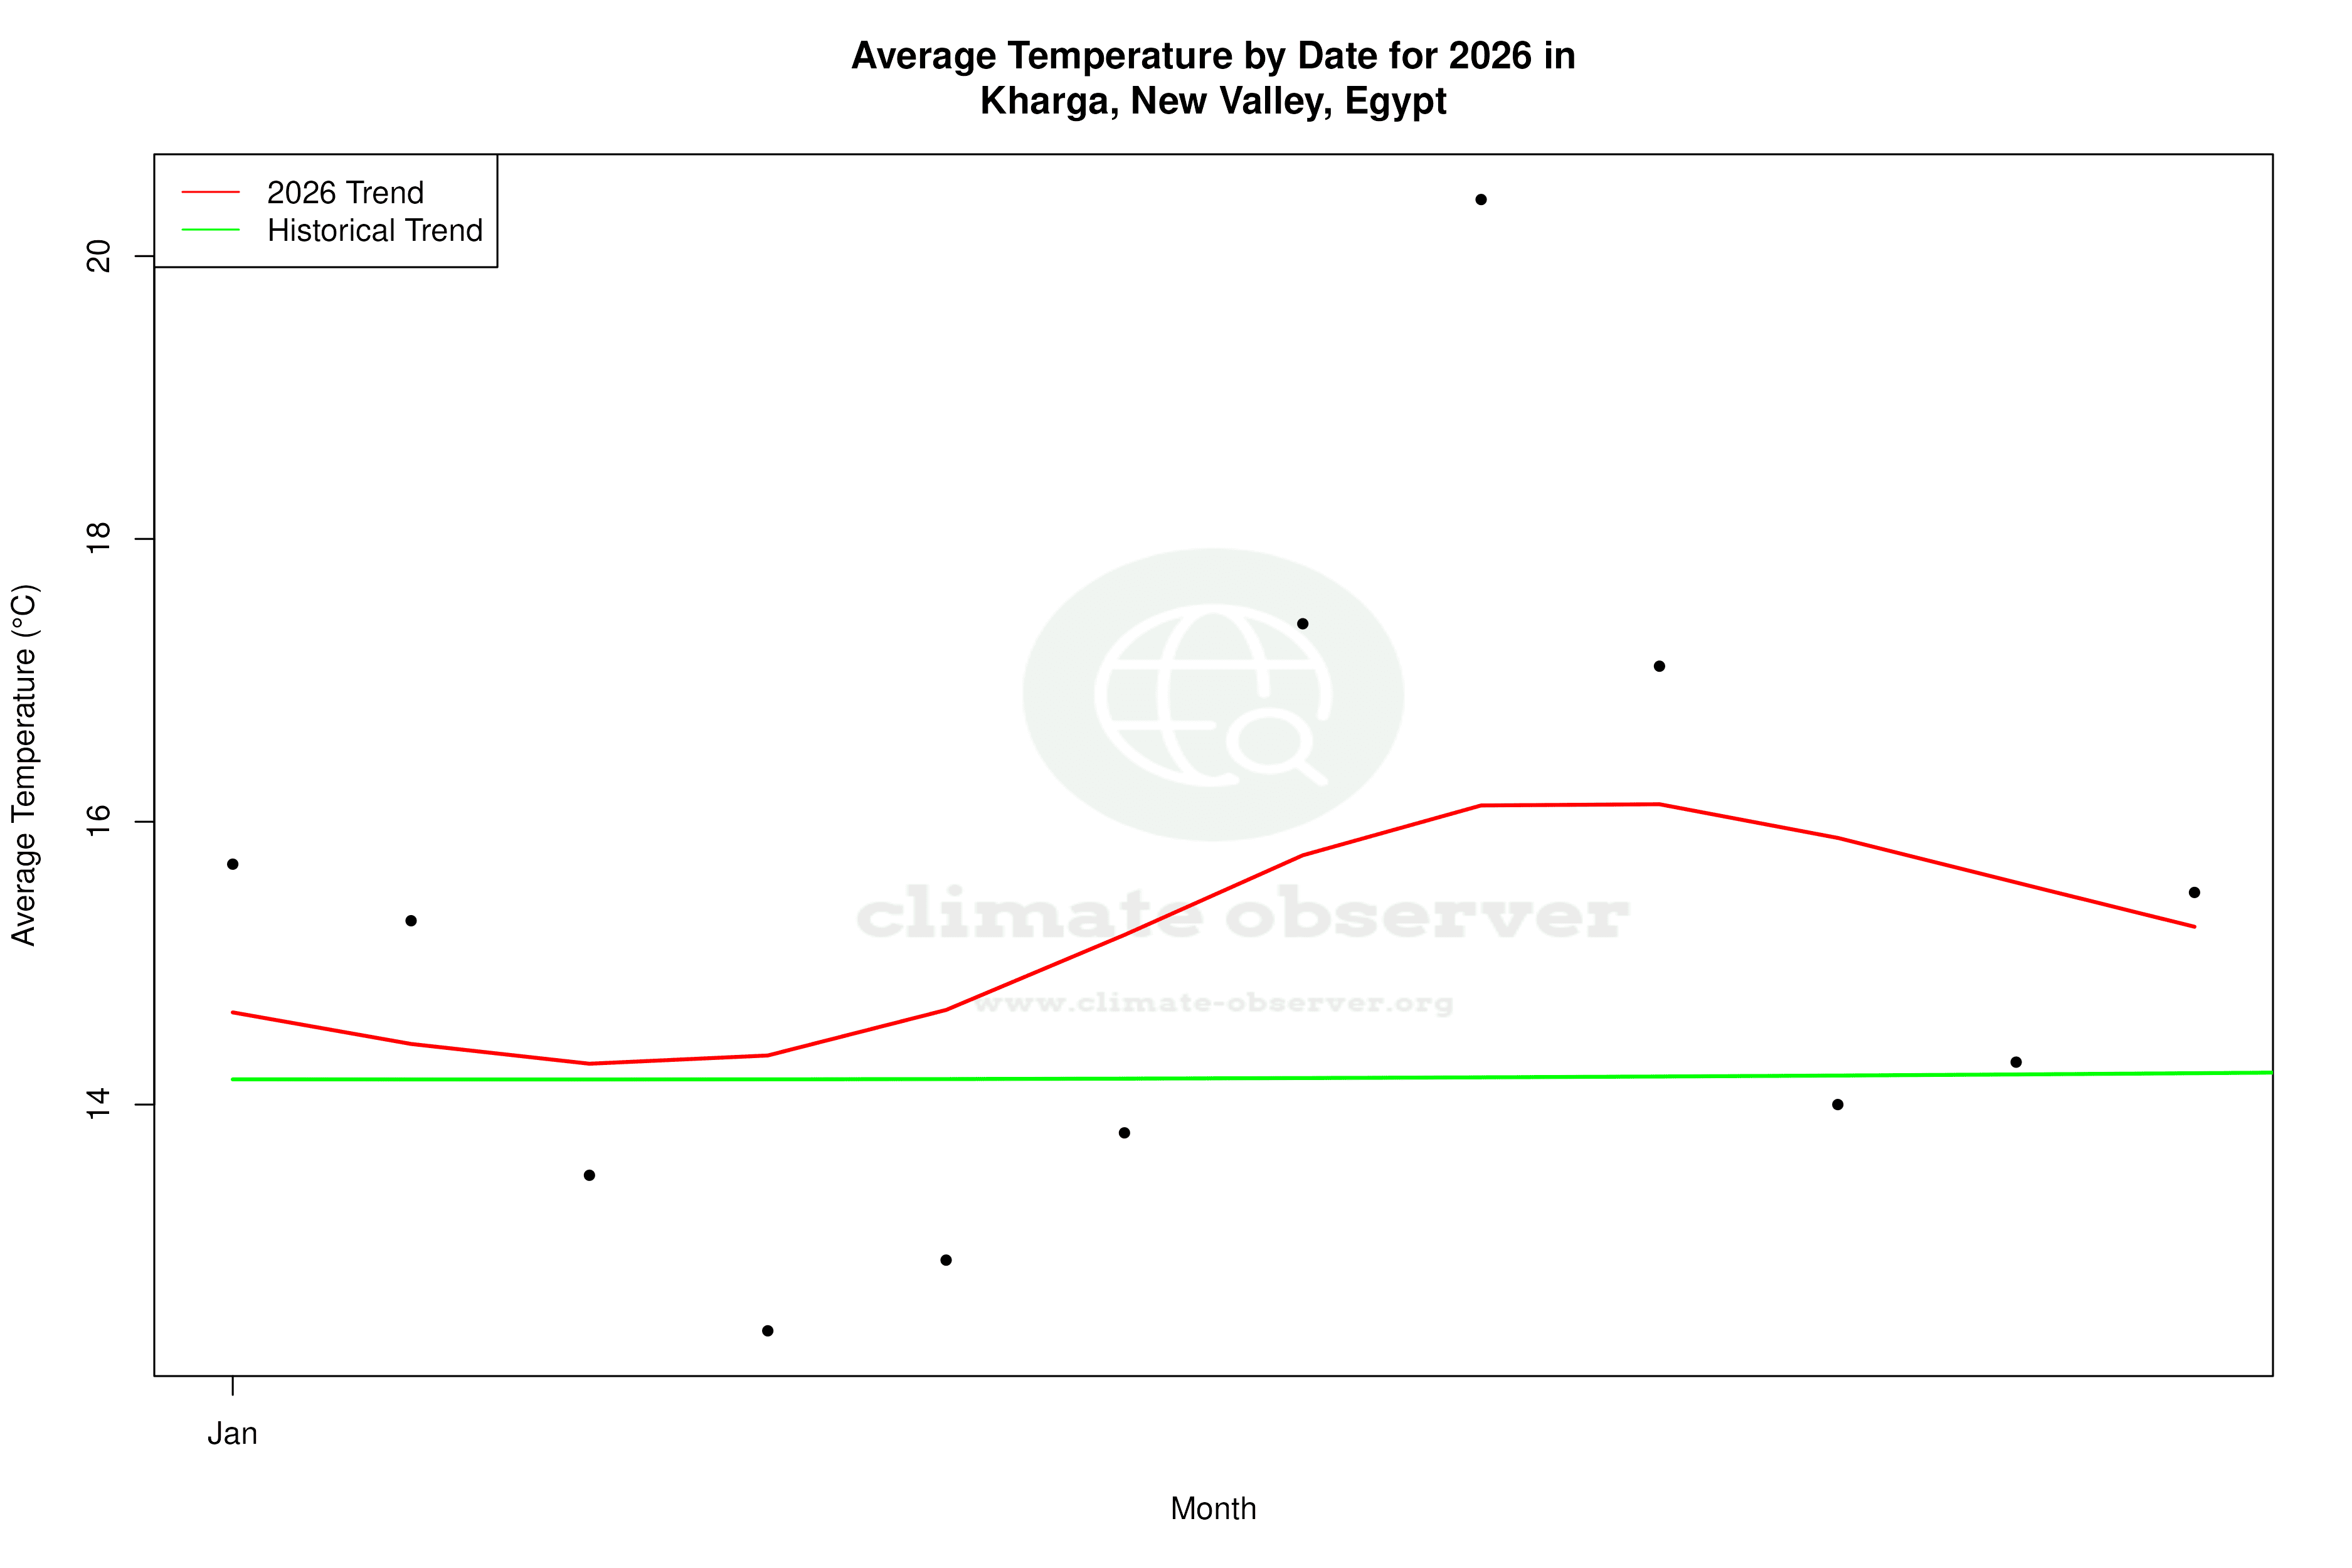
The temperature trends in Kharga present a fascinating dichotomy. Over the past decade, there has been a slight cooling in high temperatures, with a -0.17°C (-0.31°F) change. In contrast, the low temperatures have risen by 0.46°C (0.83°F). However, when considering the all-time trends, both highs and lows show a warming pattern. Highs have increased by 0.30°C (0.54°F), while lows have risen by 0.54°C (0.96°F). This suggests that while recent years have seen some cooling in daytime highs, the overall trend is towards a warmer climate.
Precipitation Patterns: From Concentration to Distribution
The Precipitation Concentration Index (PCI) for Kharga has undergone a significant transformation. The baseline PCI was 64.3, indicating highly concentrated rainfall events. Currently, the PCI stands at 38.8, reflecting a more even distribution of rainfall throughout the year. This change implies that while the region still experiences limited rainfall, it is now spread more evenly across different periods, reducing the risk of intense, isolated downpours.
Record Extremes: The Bounds of Desert Weather
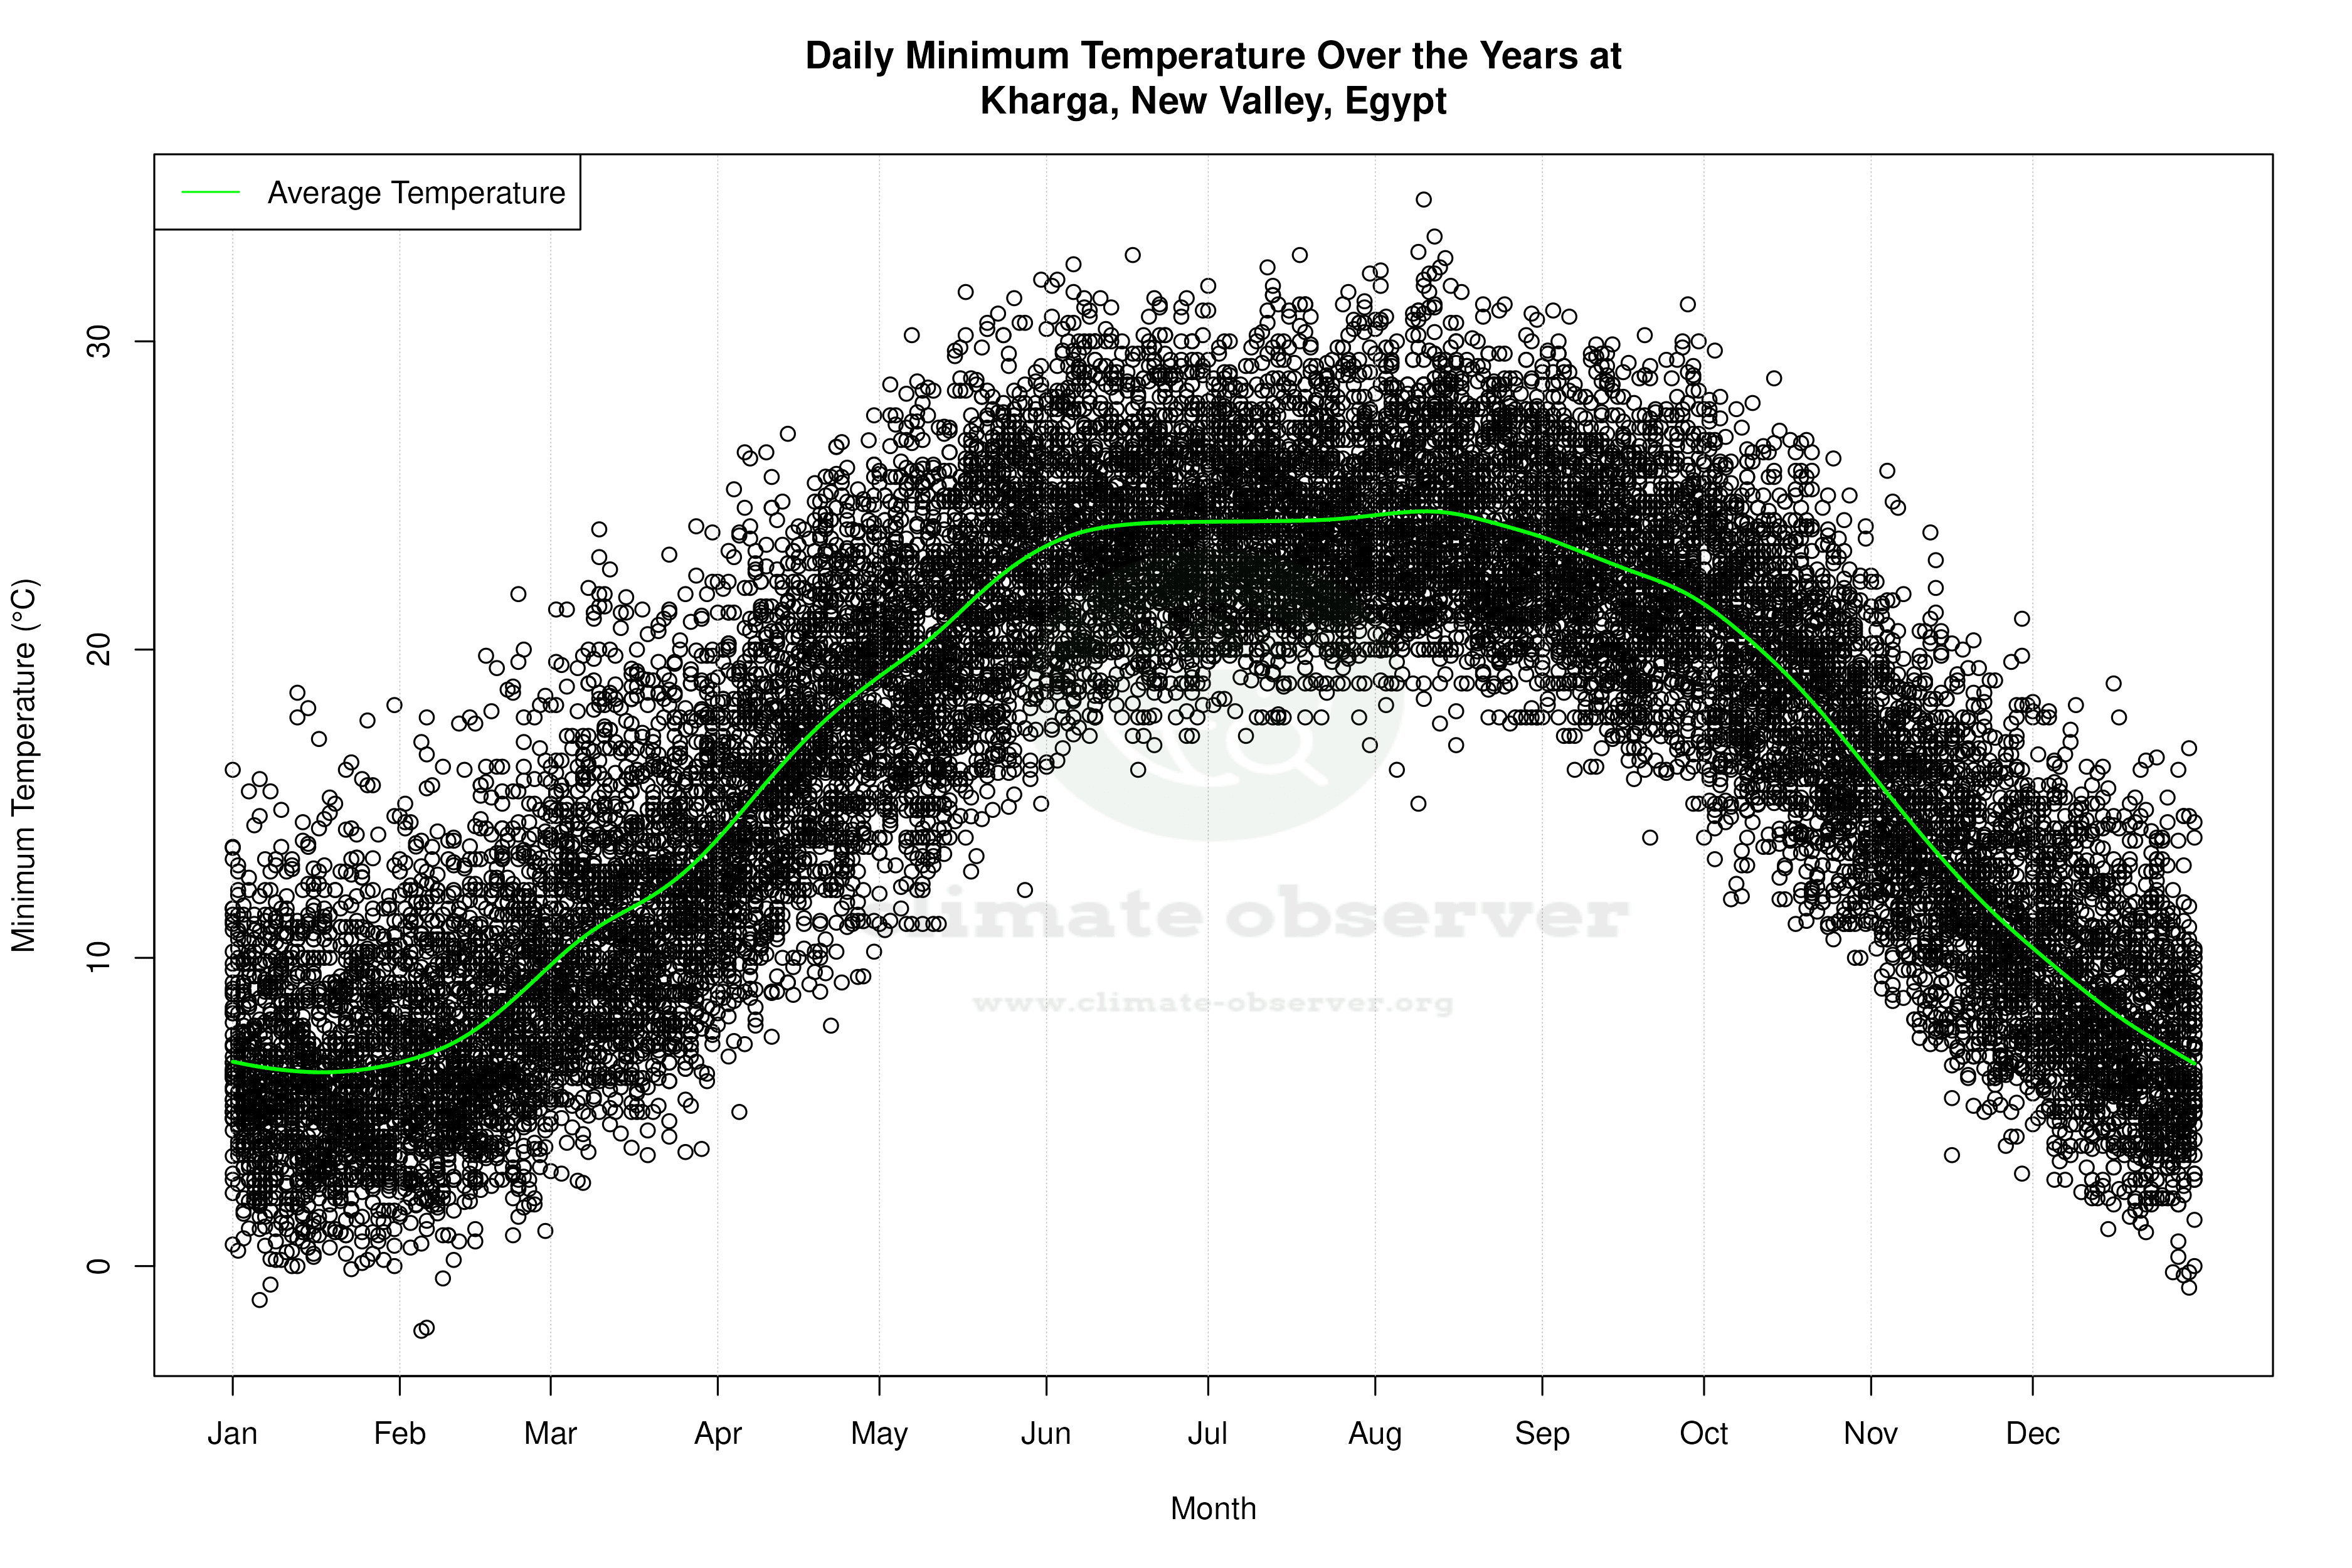
Kharga's climate is marked by its record high of 50.0°C (122.0°F) and a record low of -2.1°C (28.2°F). These extremes highlight the vast temperature range that can be experienced in desert climates. Such variability is typical in regions with minimal atmospheric moisture, which acts as a buffer against temperature swings.
Regional Climate Considerations
Egypt's broader climate goals aim to address the challenges posed by desertification and water scarcity. The shift towards more evenly distributed rainfall in Kharga aligns with these objectives, potentially offering some relief in terms of water availability. However, the ongoing warming trend, particularly in nighttime lows, underscores the need for adaptive strategies to mitigate the impacts of rising temperatures on agriculture and water resources.
Station Statistics
10-Year Trend
High: -0.44 °C/decade
Low: +0.70 °C/decade
Rain: -0.01 mm/decade
25-Year Trend
High: +0.17 °C/decade
Low: +0.75 °C/decade
Rain: +0.00 mm/decade
50-Year Trend
High: +0.37 °C/decade
Low: +0.59 °C/decade
Rain: -0.00 mm/decade
All-Time Trend
High: +0.28 °C/decade
Low: +0.50 °C/decade
Rain: -0.00 mm/decade
Percentage Above-Average Days
Last 12 Months: 47.4%
This Year: 31.3%
Precipitation Concentration Index (PCI) ℹ️
Last 12 Months: 63.1
Historical Average: 73.2
Percentile Rank of Last 12 Months ℹ️
High: 42nd percentile
Low: 93rd percentile
Rain: 64th percentile
Change in Variance ℹ️
High: +2.0%
Low: +6.8%
Intraday: -5.5%
Data Coverage
73.7%
First Year of Data
1966
Station Location
Historical Weather Records
| Max High | Avg High | Min High | Max Avg | Avg Avg | Min Avg | Max Low | Avg Low | Min Low | Max Precipitation | Avg Precipitation | Max Snow | Avg Snow | |
|---|---|---|---|---|---|---|---|---|---|---|---|---|---|
| Record | 50.0 °C | — | 12.7 °C | 40.9 °C | — | 6.2 °C | 35.4 °C | — | -2.1 °C | 19.9 mm | — | — | — |
| January | 34.0 °C | 22.1 °C | 12.7 °C | 25.3 °C | 14.4 °C | 6.2 °C | 20.1 °C | 6.5 °C | -1.1 °C | 5.5 mm | 0.0 mm | — | — |
| February | 38.6 °C | 24.2 °C | 13.6 °C | 27.9 °C | 16.3 °C | 6.6 °C | 21.8 °C | 7.9 °C | -2.1 °C | 3.6 mm | 0.0 mm | — | — |
| March | 43.9 °C | 28.6 °C | 14.6 °C | 32.4 °C | 20.7 °C | 8.6 °C | 25.2 °C | 11.8 °C | 2.7 °C | 4.9 mm | 0.0 mm | — | — |
| April | 46.4 °C | 34.1 °C | 21.1 °C | 36.2 °C | 25.9 °C | 15.7 °C | 27.6 °C | 16.8 °C | 5.0 °C | 1.5 mm | 0.0 mm | — | — |
| May | 50.0 °C | 37.9 °C | 26.7 °C | 40.6 °C | 30.2 °C | 20.8 °C | 34.0 °C | 21.3 °C | 10.9 °C | 3.2 mm | 0.0 mm | — | — |
| June | 49.4 °C | 40.1 °C | 31.0 °C | 40.9 °C | 32.7 °C | 24.7 °C | 32.8 °C | 24.0 °C | 16.1 °C | 0.3 mm | 0.0 mm | — | — |
| July | 50.0 °C | 40.5 °C | 32.6 °C | 40.9 °C | 33.3 °C | 26.6 °C | 33.3 °C | 24.3 °C | 16.9 °C | 0.0 mm | 0.0 mm | — | — |
| August | 49.8 °C | 40.5 °C | 32.3 °C | 40.9 °C | 33.2 °C | 25.7 °C | 35.4 °C | 24.3 °C | 15.0 °C | 0.0 mm | 0.0 mm | — | — |
| September | 47.6 °C | 38.1 °C | 30.0 °C | 38.0 °C | 30.8 °C | 24.0 °C | 31.2 °C | 22.8 °C | 13.9 °C | 0.2 mm | 0.0 mm | — | — |
| October | 45.1 °C | 34.2 °C | 23.7 °C | 34.9 °C | 27.0 °C | 17.1 °C | 29.7 °C | 19.1 °C | 10.0 °C | 19.9 mm | 0.0 mm | — | — |
| November | 40.6 °C | 28.3 °C | 18.0 °C | 31.0 °C | 20.9 °C | 11.8 °C | 26.8 °C | 13.1 °C | 3.0 °C | 6.2 mm | 0.0 mm | — | — |
| December | 37.4 °C | 23.6 °C | 14.7 °C | 27.4 °C | 16.0 °C | 6.9 °C | 18.9 °C | 8.3 °C | -0.7 °C | 0.4 mm | 0.0 mm | — | — |
Data Visualisations
Remove WatermarksCurrent Year Climate Trends vs Historical
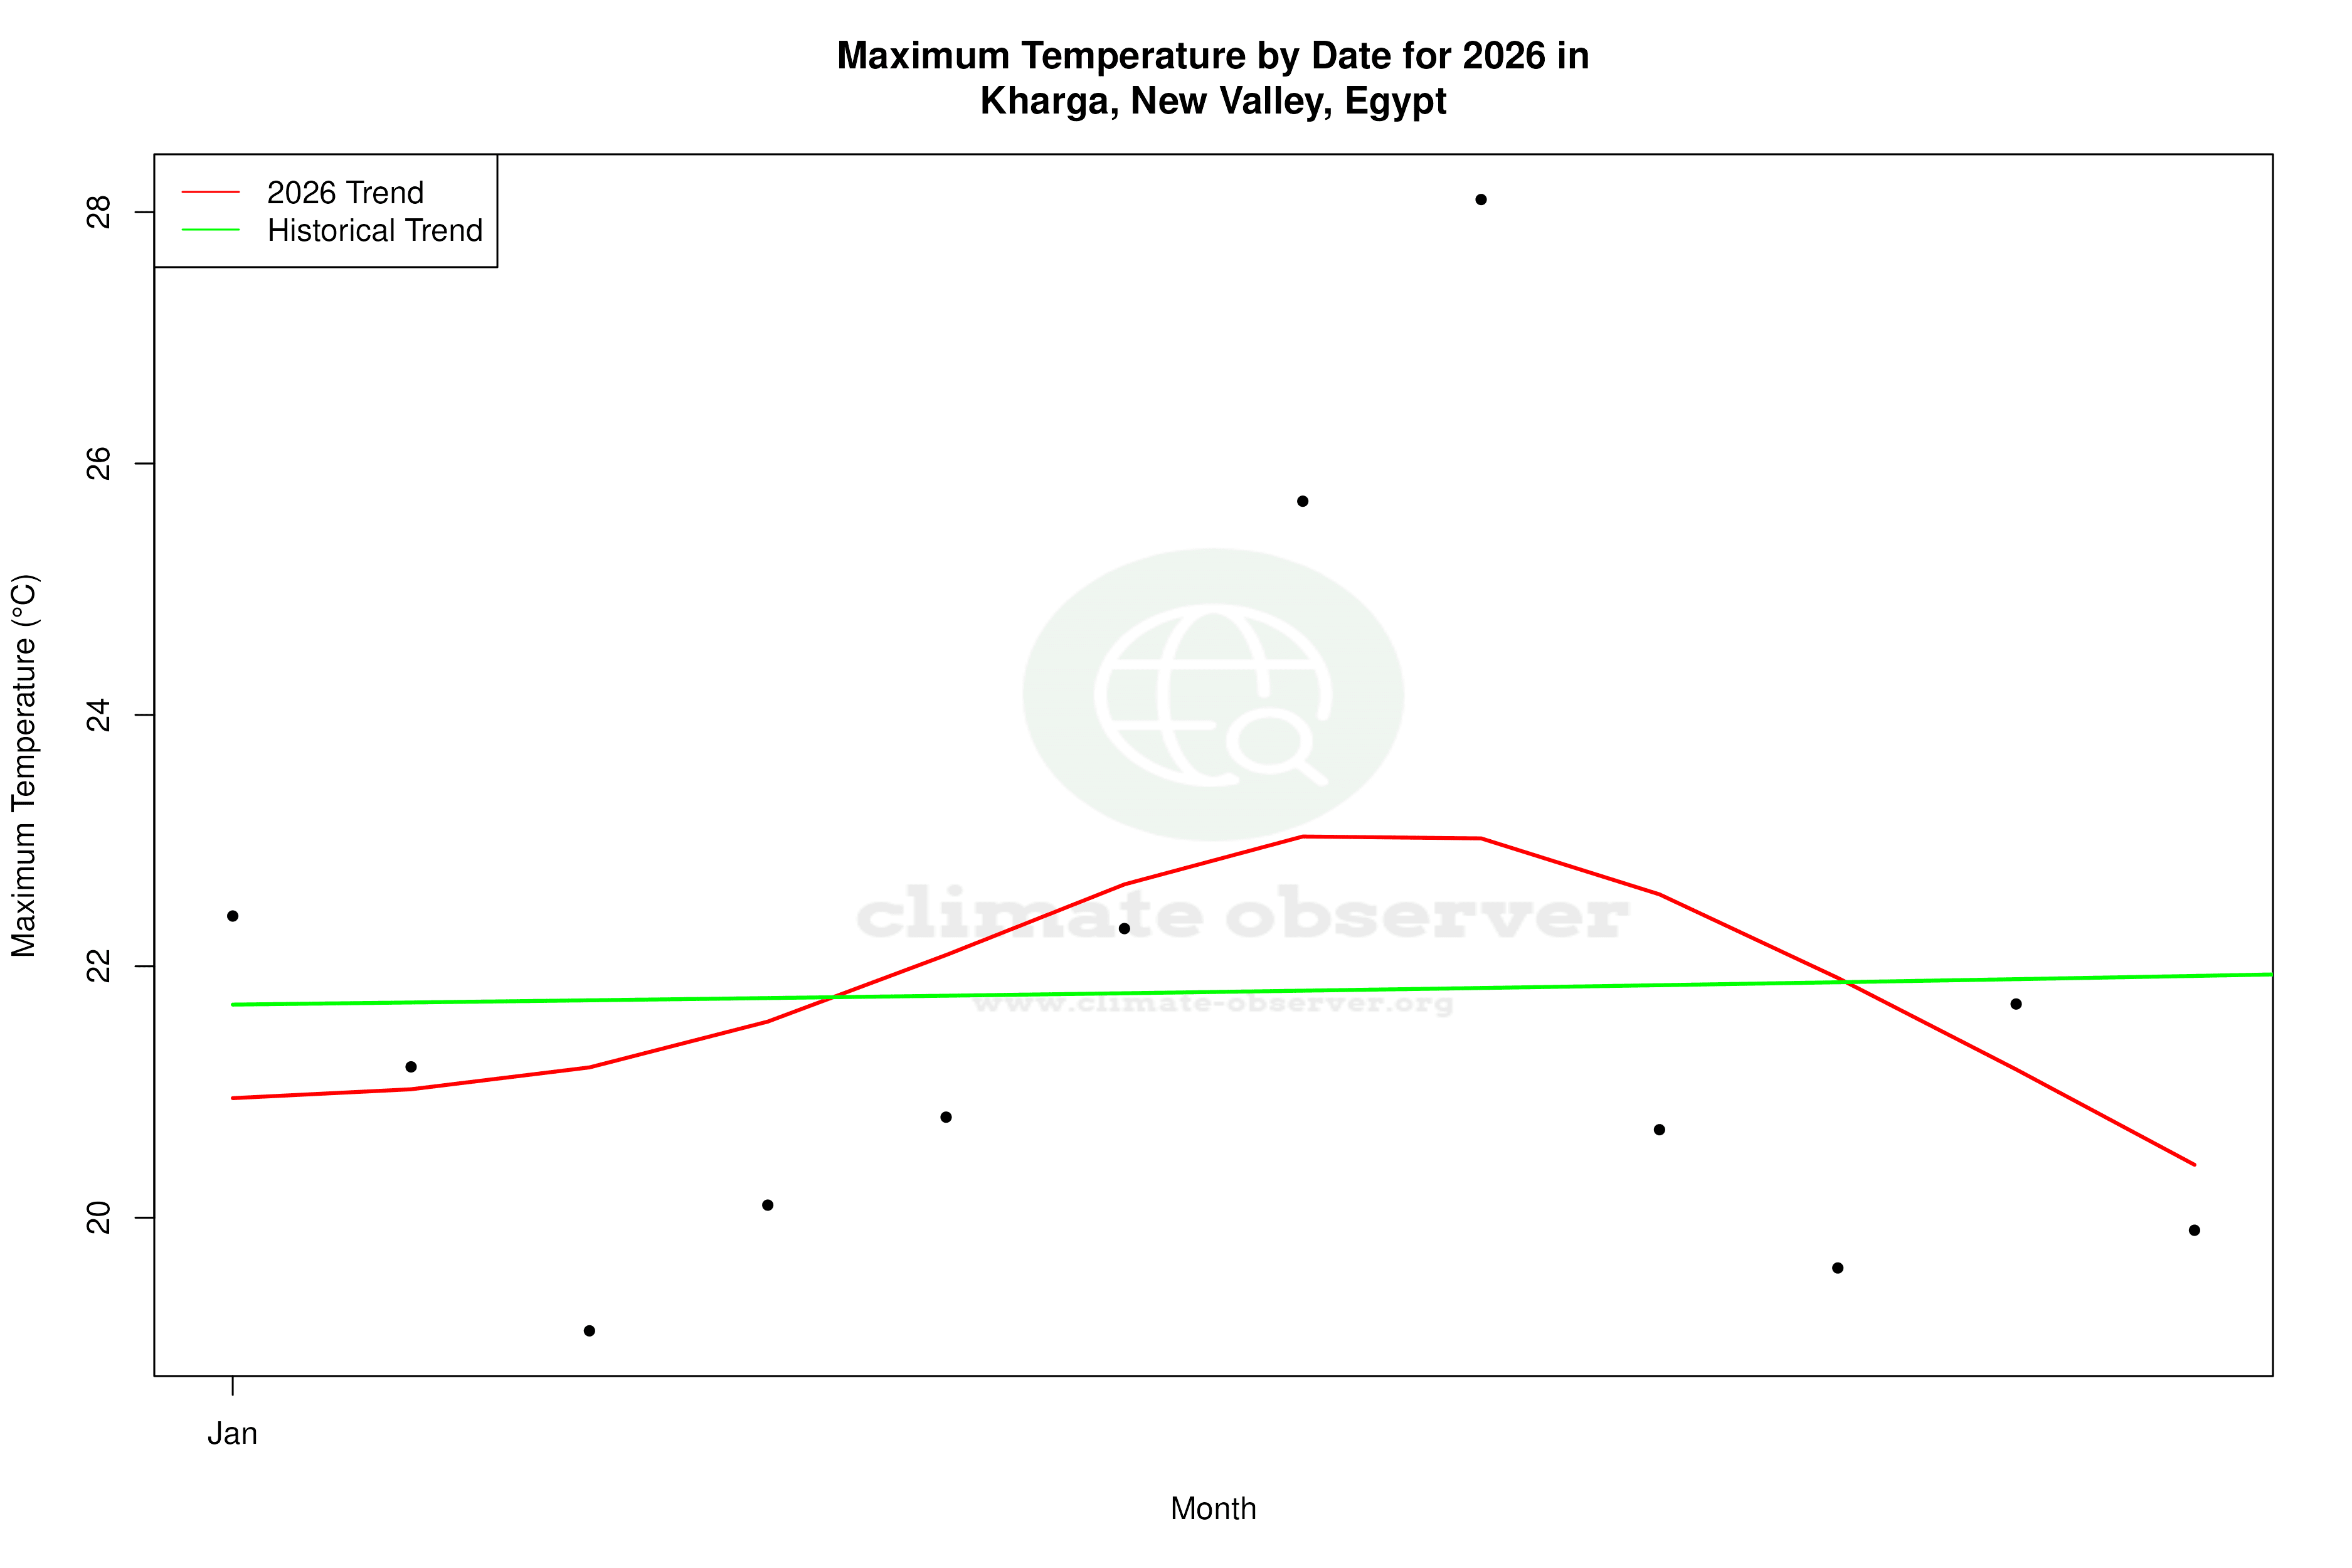


Max Temperature this Year | 1 of 6
Climate 12-Month Moving Averages

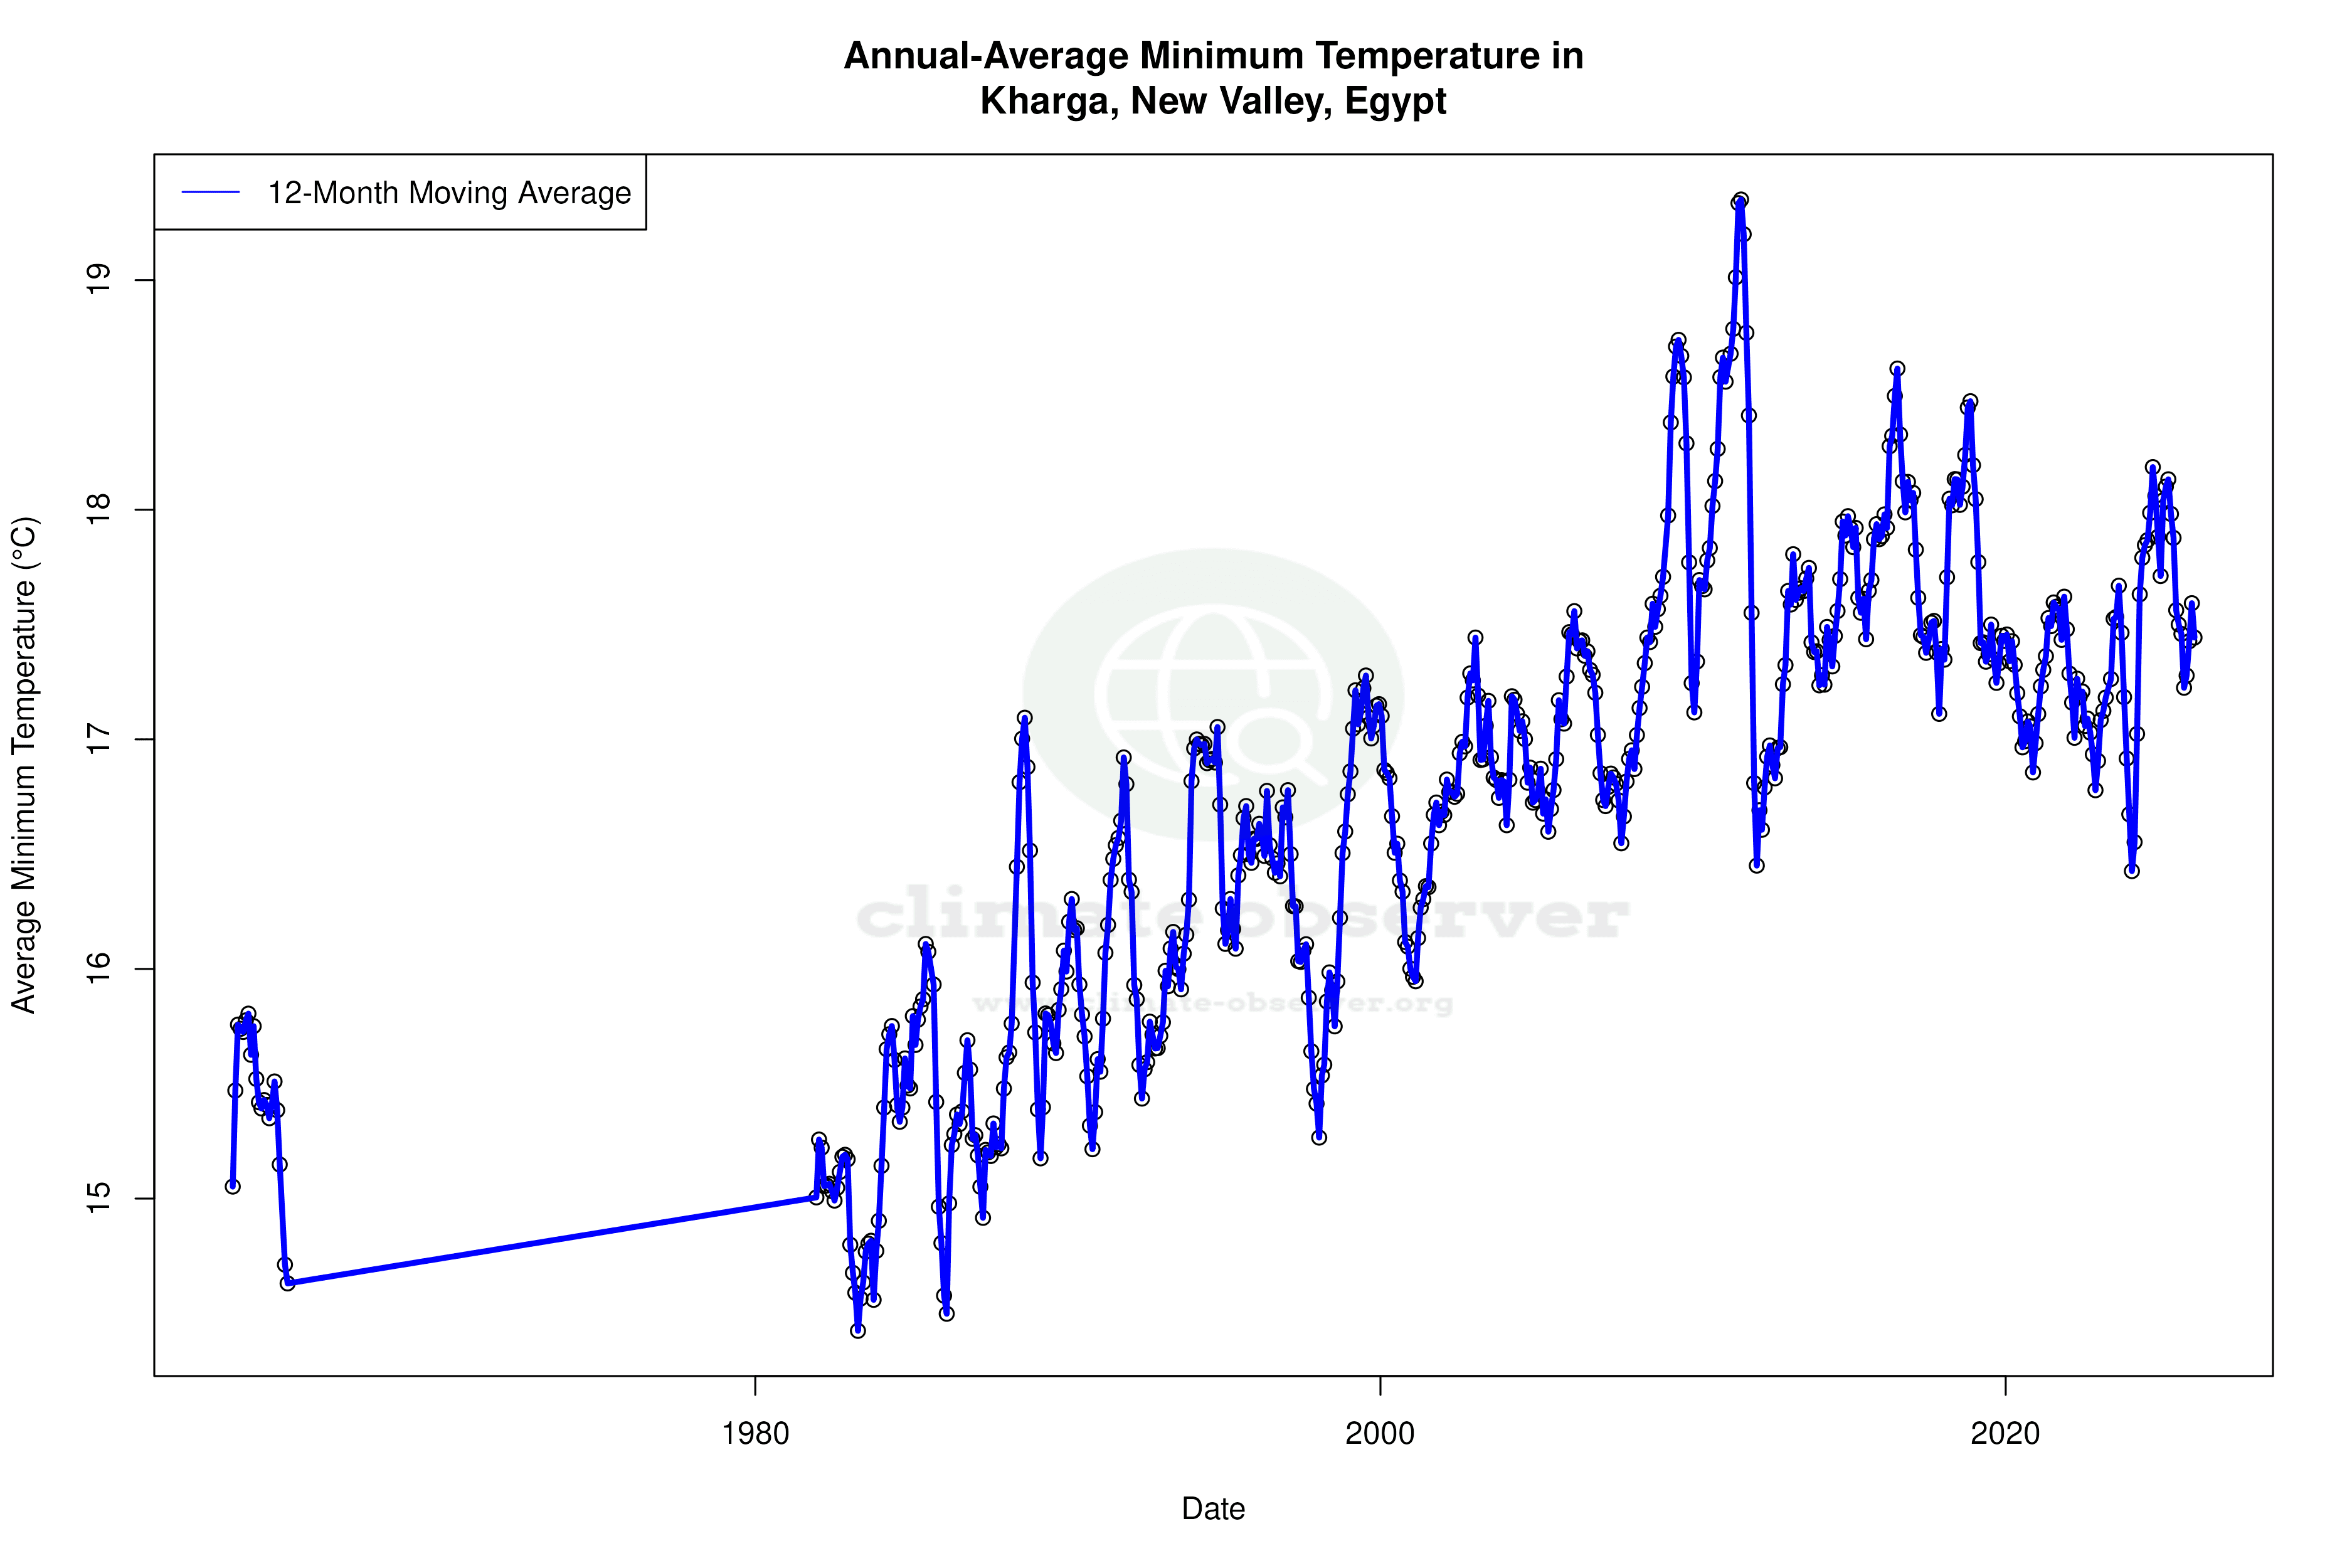


Max Temperature 12-Month MA | 1 of 6
Daily Data Points and Averages Throughout the Year
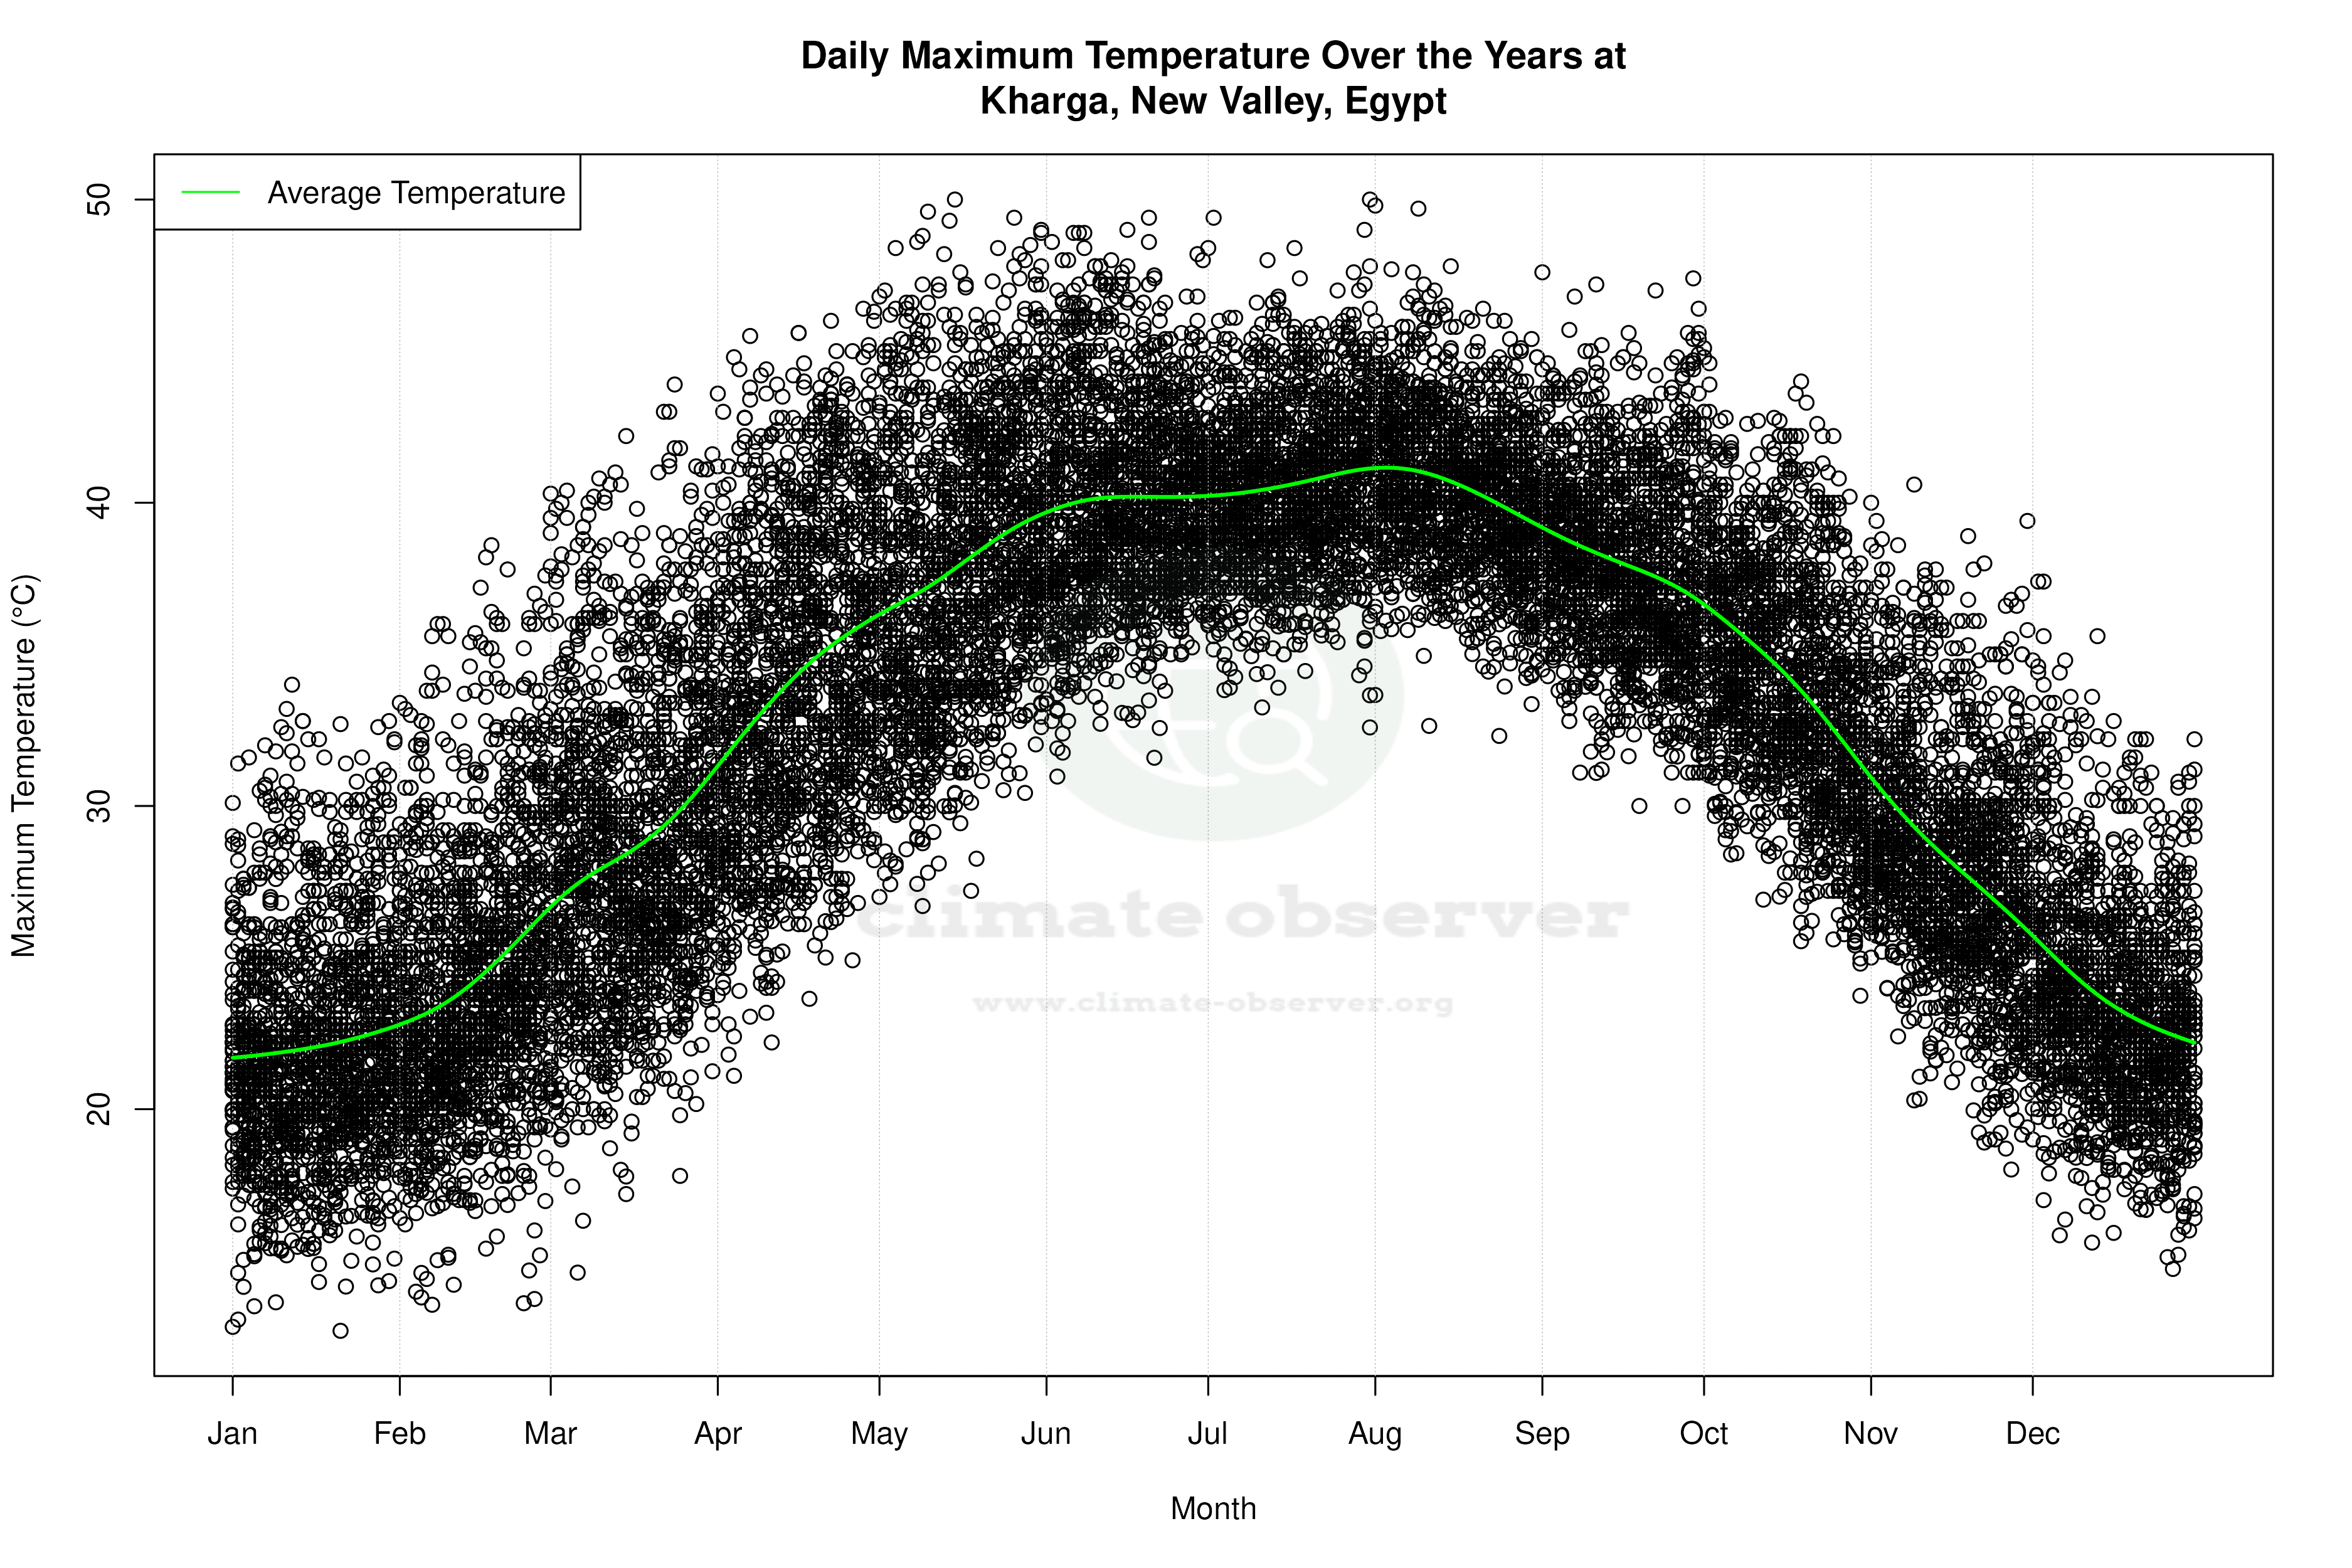
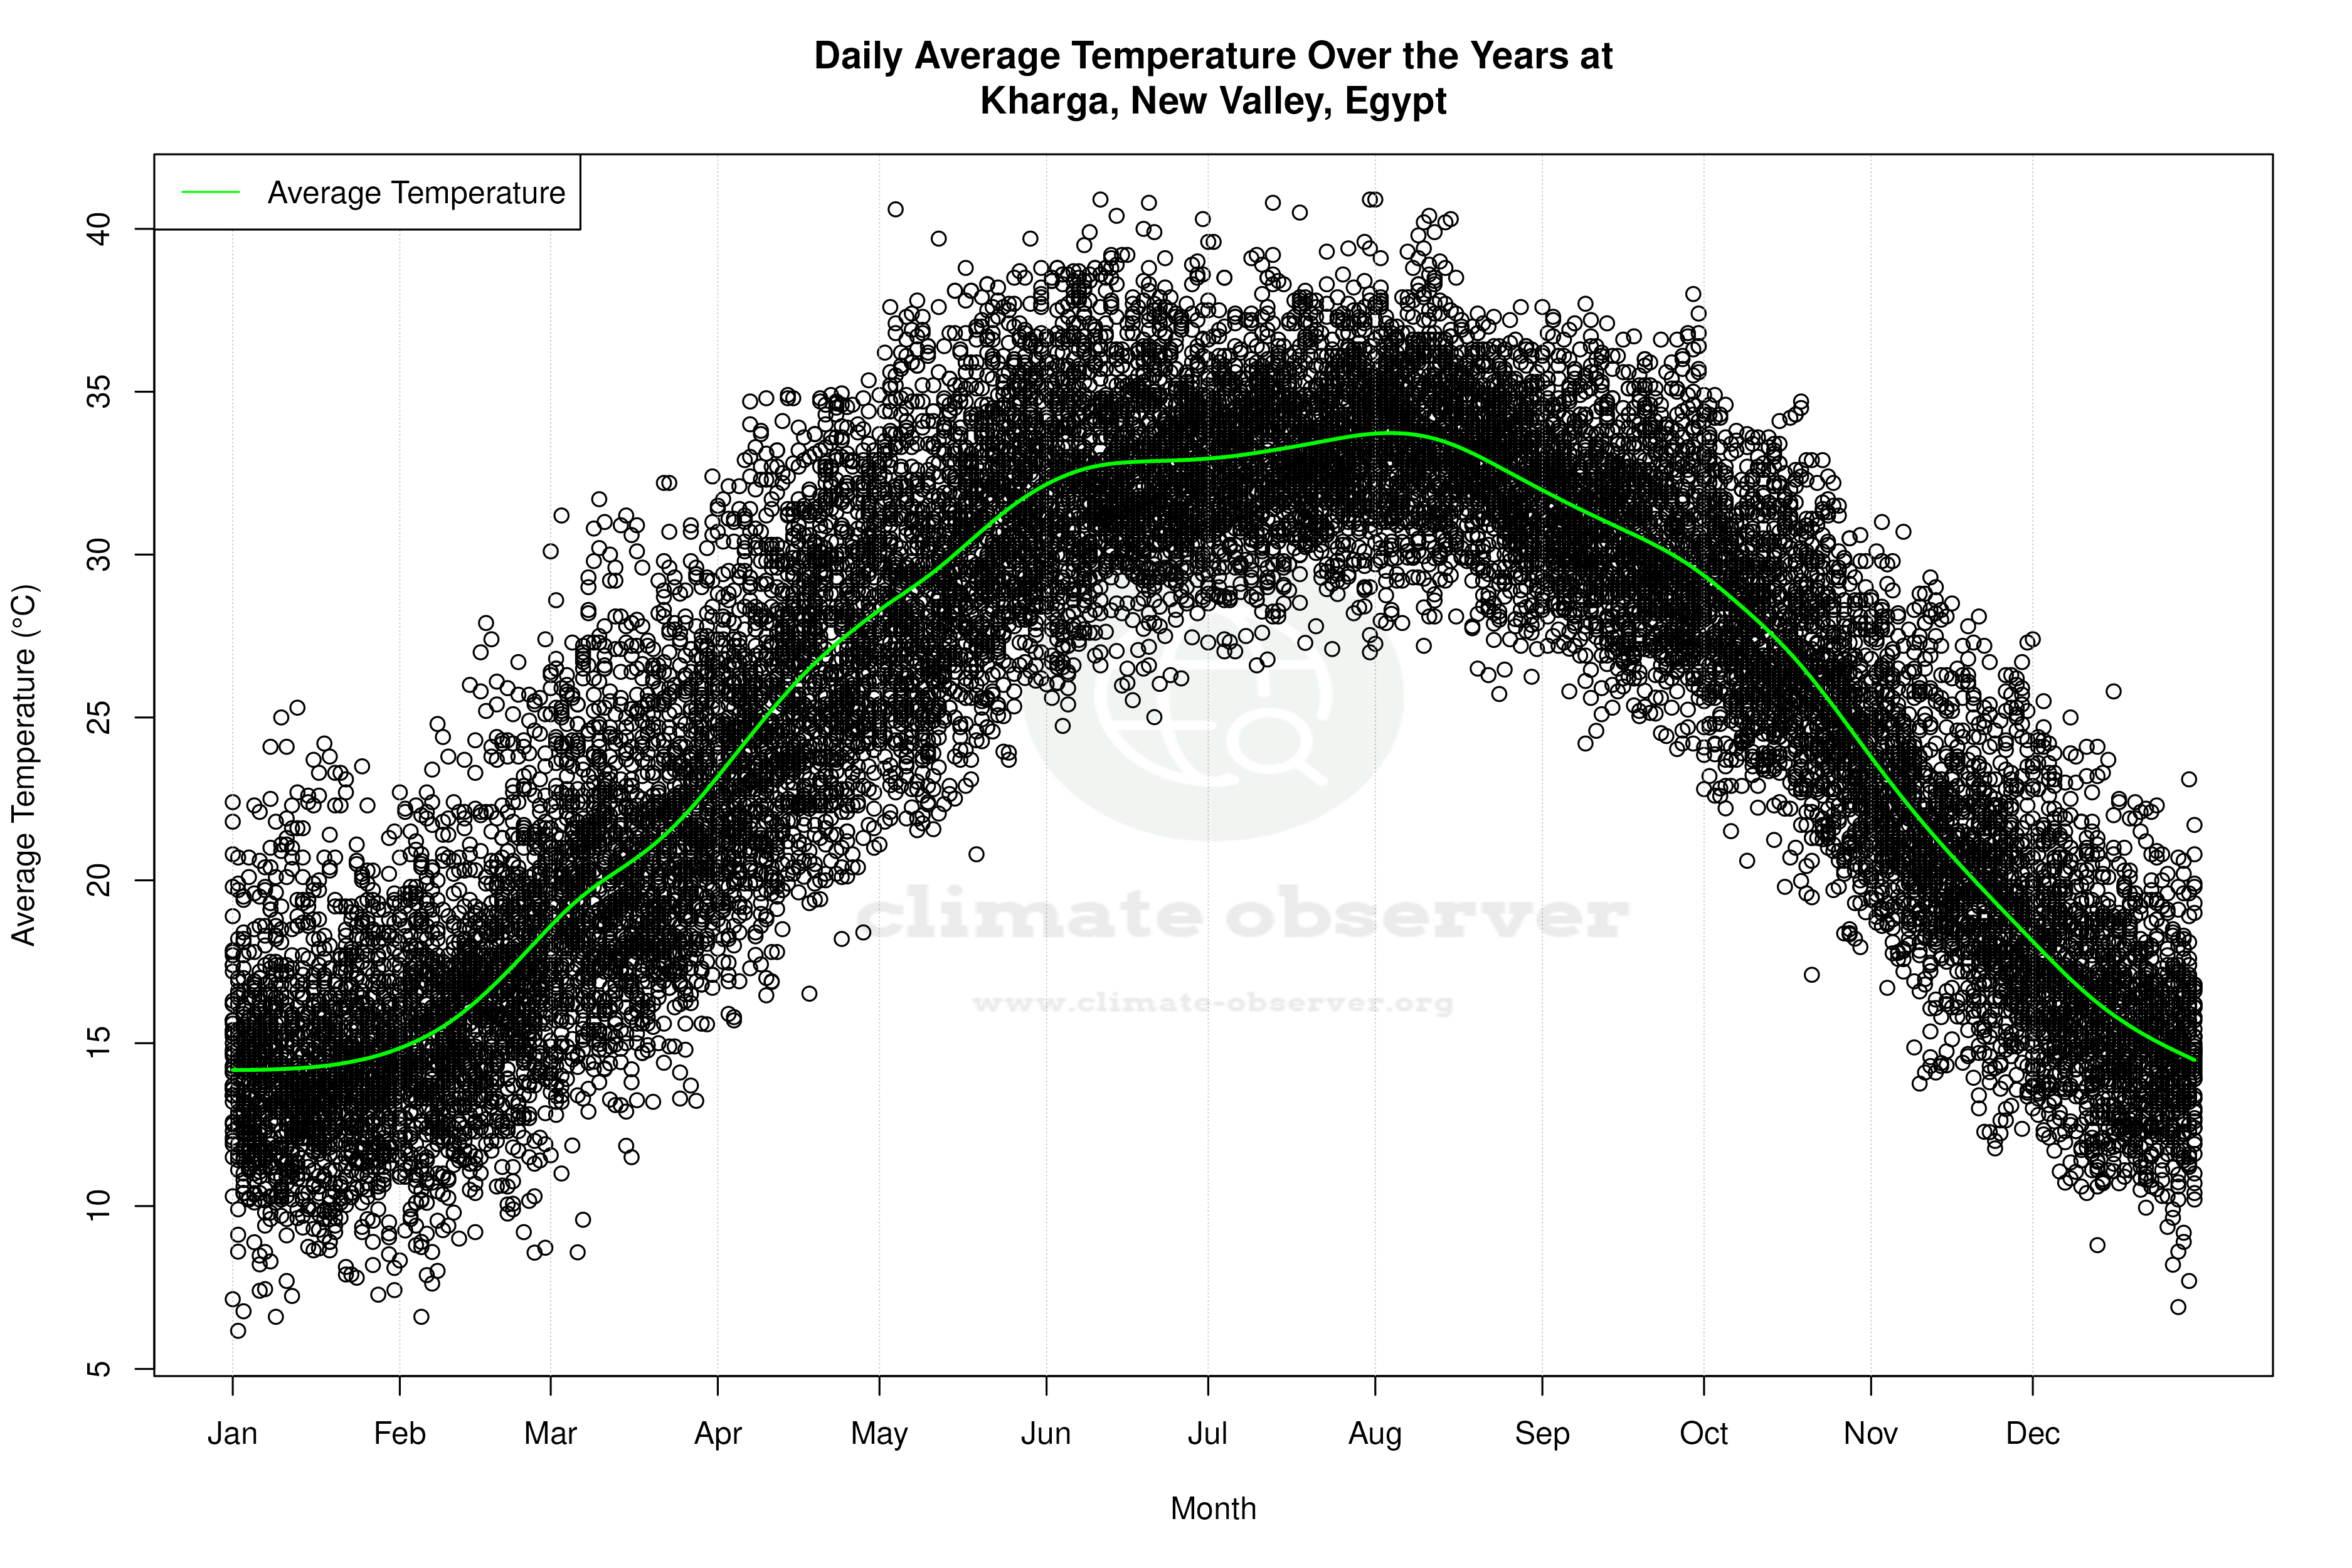


Average Max Temperature Throughout Year | 1 of 5
