Climate for Station: Valentia Observatory, Valentia, Ireland
Loading live weather...
Climate Analysis & Overview
Valentia Observatory, located in the temperate maritime climate of County Kerry, Ireland, shows a warming trend over recent decades. The past ten years have seen a pronounced increase in both high and low temperatures, with a slight redistribution of precipitation events. This aligns with Ireland's broader climate goals of understanding regional climate dynamics to better mitigate future impacts.
Maritime Climate Dynamics
Valentia Observatory is situated in a region characterised by a temperate maritime climate, classified under the Köppen system as Cfb. This classification indicates mild temperatures and abundant rainfall throughout the year, influenced by the North Atlantic Ocean. The observatory's coastal position at 51.9394°N, -10.2219°W allows for a unique climatic profile, where oceanic influences moderate temperature extremes.
Warming Trends Over Decades
The all-time temperature trends at Valentia Observatory reveal a subtle warming pattern. Highs have increased by 0.03°C (0.05°F), while lows have risen by 0.10°C (0.18°F). However, the past decade shows a more pronounced warming, with highs increasing by 1.59°C (2.86°F) and lows by 1.04°C (1.88°F). This recent acceleration in temperature rise is indicative of broader global warming trends, possibly exacerbated by local climatic influences.
Temperature Extremes and Records
Temperature records at Valentia Observatory highlight the range of conditions experienced in this coastal locale. The highest recorded temperature is 27.9°C (82.2°F), while the lowest is -7.7°C (18.1°F). These extremes underscore the variability inherent in Ireland's maritime climate, where oceanic currents and atmospheric conditions can lead to significant temperature fluctuations.
Precipitation Patterns and Distribution
The Precipitation Concentration Index (PCI) at Valentia has shifted from a baseline of 10.84 to a current value of 8.92. This decrease suggests a more even distribution of rainfall events, meaning precipitation is less concentrated in intense storms and more spread out over time. Such a change can influence local ecosystems and water management strategies, aligning with Ireland's efforts to adapt to changing precipitation patterns.
Regional Climate Context
Valentia's climate profile is a microcosm of broader regional trends. Ireland has been actively engaged in understanding and addressing climate change impacts, with goals to reduce greenhouse gas emissions and enhance climate resilience. The warming trends and evolving precipitation patterns observed at Valentia are critical data points for shaping future climate policies and adaptation strategies. As the country navigates these changes, Valentia Observatory remains a vital source of climatic insights.
Station Statistics
10-Year Trend
High: +2.73 °F/decade
Low: +1.83 °F/decade
Rain: +0.025 in/decade
25-Year Trend
High: -0.09 °F/decade
Low: +0.44 °F/decade
Rain: +0.006 in/decade
50-Year Trend
High: +0.03 °F/decade
Low: +0.41 °F/decade
Rain: +0.007 in/decade
All-Time Trend
High: -0.01 °F/decade
Low: +0.14 °F/decade
Rain: +0.006 in/decade
Percentage Above-Average Days
Last 12 Months: 47.9%
This Year: 43.1%
Precipitation Concentration Index (PCI) ℹ️
Last 12 Months: 9.3
Historical Average: 10.5
Percentile Rank of Last 12 Months ℹ️
High: 54th percentile
Low: 89th percentile
Rain: 90th percentile
Change in Variance ℹ️
High: -7.6%
Low: -7.5%
Intraday: -16.6%
Data Coverage
87.3%
First Year of Data
1929
Station Location
Historical Weather Records
| Max High | Avg High | Min High | Max Avg | Avg Avg | Min Avg | Max Low | Avg Low | Min Low | Max Precipitation | Avg Precipitation | Max Snow | Avg Snow | |
|---|---|---|---|---|---|---|---|---|---|---|---|---|---|
| Record | 82.22 °F | — | 29.30 °F | 73.04 °F | — | 25.34 °F | 68.90 °F | — | 18.14 °F | 4.43 in | — | — | — |
| January | 69.62 °F | 49.02 °F | 29.30 °F | 55.58 °F | 45.49 °F | 25.34 °F | 53.96 °F | 40.07 °F | 19.04 °F | 2.01 in | 0.22 in | — | — |
| February | 62.96 °F | 49.18 °F | 33.26 °F | 56.12 °F | 45.49 °F | 28.22 °F | 53.06 °F | 39.93 °F | 18.86 °F | 3.11 in | 0.18 in | — | — |
| March | 69.26 °F | 51.52 °F | 32.81 °F | 62.42 °F | 46.62 °F | 28.04 °F | 55.58 °F | 41.24 °F | 22.82 °F | 1.91 in | 0.15 in | — | — |
| April | 72.14 °F | 54.33 °F | 42.24 °F | 65.12 °F | 48.87 °F | 39.02 °F | 58.10 °F | 43.16 °F | 27.86 °F | 2.17 in | 0.12 in | — | — |
| May | 78.08 °F | 58.30 °F | 44.24 °F | 69.44 °F | 52.81 °F | 40.46 °F | 60.44 °F | 46.80 °F | 32.36 °F | 1.86 in | 0.12 in | — | — |
| June | 82.22 °F | 61.86 °F | 51.26 °F | 71.42 °F | 56.70 °F | 47.84 °F | 66.38 °F | 51.24 °F | 35.06 °F | 2.04 in | 0.12 in | — | — |
| July | 80.06 °F | 63.93 °F | 54.14 °F | 70.70 °F | 59.26 °F | 48.92 °F | 68.90 °F | 54.32 °F | 41.54 °F | 2.64 in | 0.13 in | — | — |
| August | 80.60 °F | 64.45 °F | 56.48 °F | 72.68 °F | 59.64 °F | 50.18 °F | 67.10 °F | 54.38 °F | 37.94 °F | 2.01 in | 0.14 in | — | — |
| September | 78.62 °F | 62.24 °F | 51.98 °F | 73.04 °F | 57.29 °F | 45.32 °F | 67.64 °F | 52.04 °F | 32.00 °F | 3.71 in | 0.17 in | — | — |
| October | 74.30 °F | 57.76 °F | 44.96 °F | 65.48 °F | 53.25 °F | 39.02 °F | 63.68 °F | 48.27 °F | 28.04 °F | 3.70 in | 0.21 in | — | — |
| November | 67.64 °F | 52.85 °F | 36.32 °F | 60.98 °F | 49.11 °F | 31.64 °F | 57.92 °F | 43.87 °F | 24.80 °F | 4.43 in | 0.22 in | — | — |
| December | 60.26 °F | 50.29 °F | 32.00 °F | 56.48 °F | 46.79 °F | 26.24 °F | 55.40 °F | 41.69 °F | 18.14 °F | 2.75 in | 0.22 in | — | — |
Data Visualisations
Remove WatermarksCurrent Year Climate Trends vs Historical


Max Temperature this Year | 1 of 6
Climate 12-Month Moving Averages
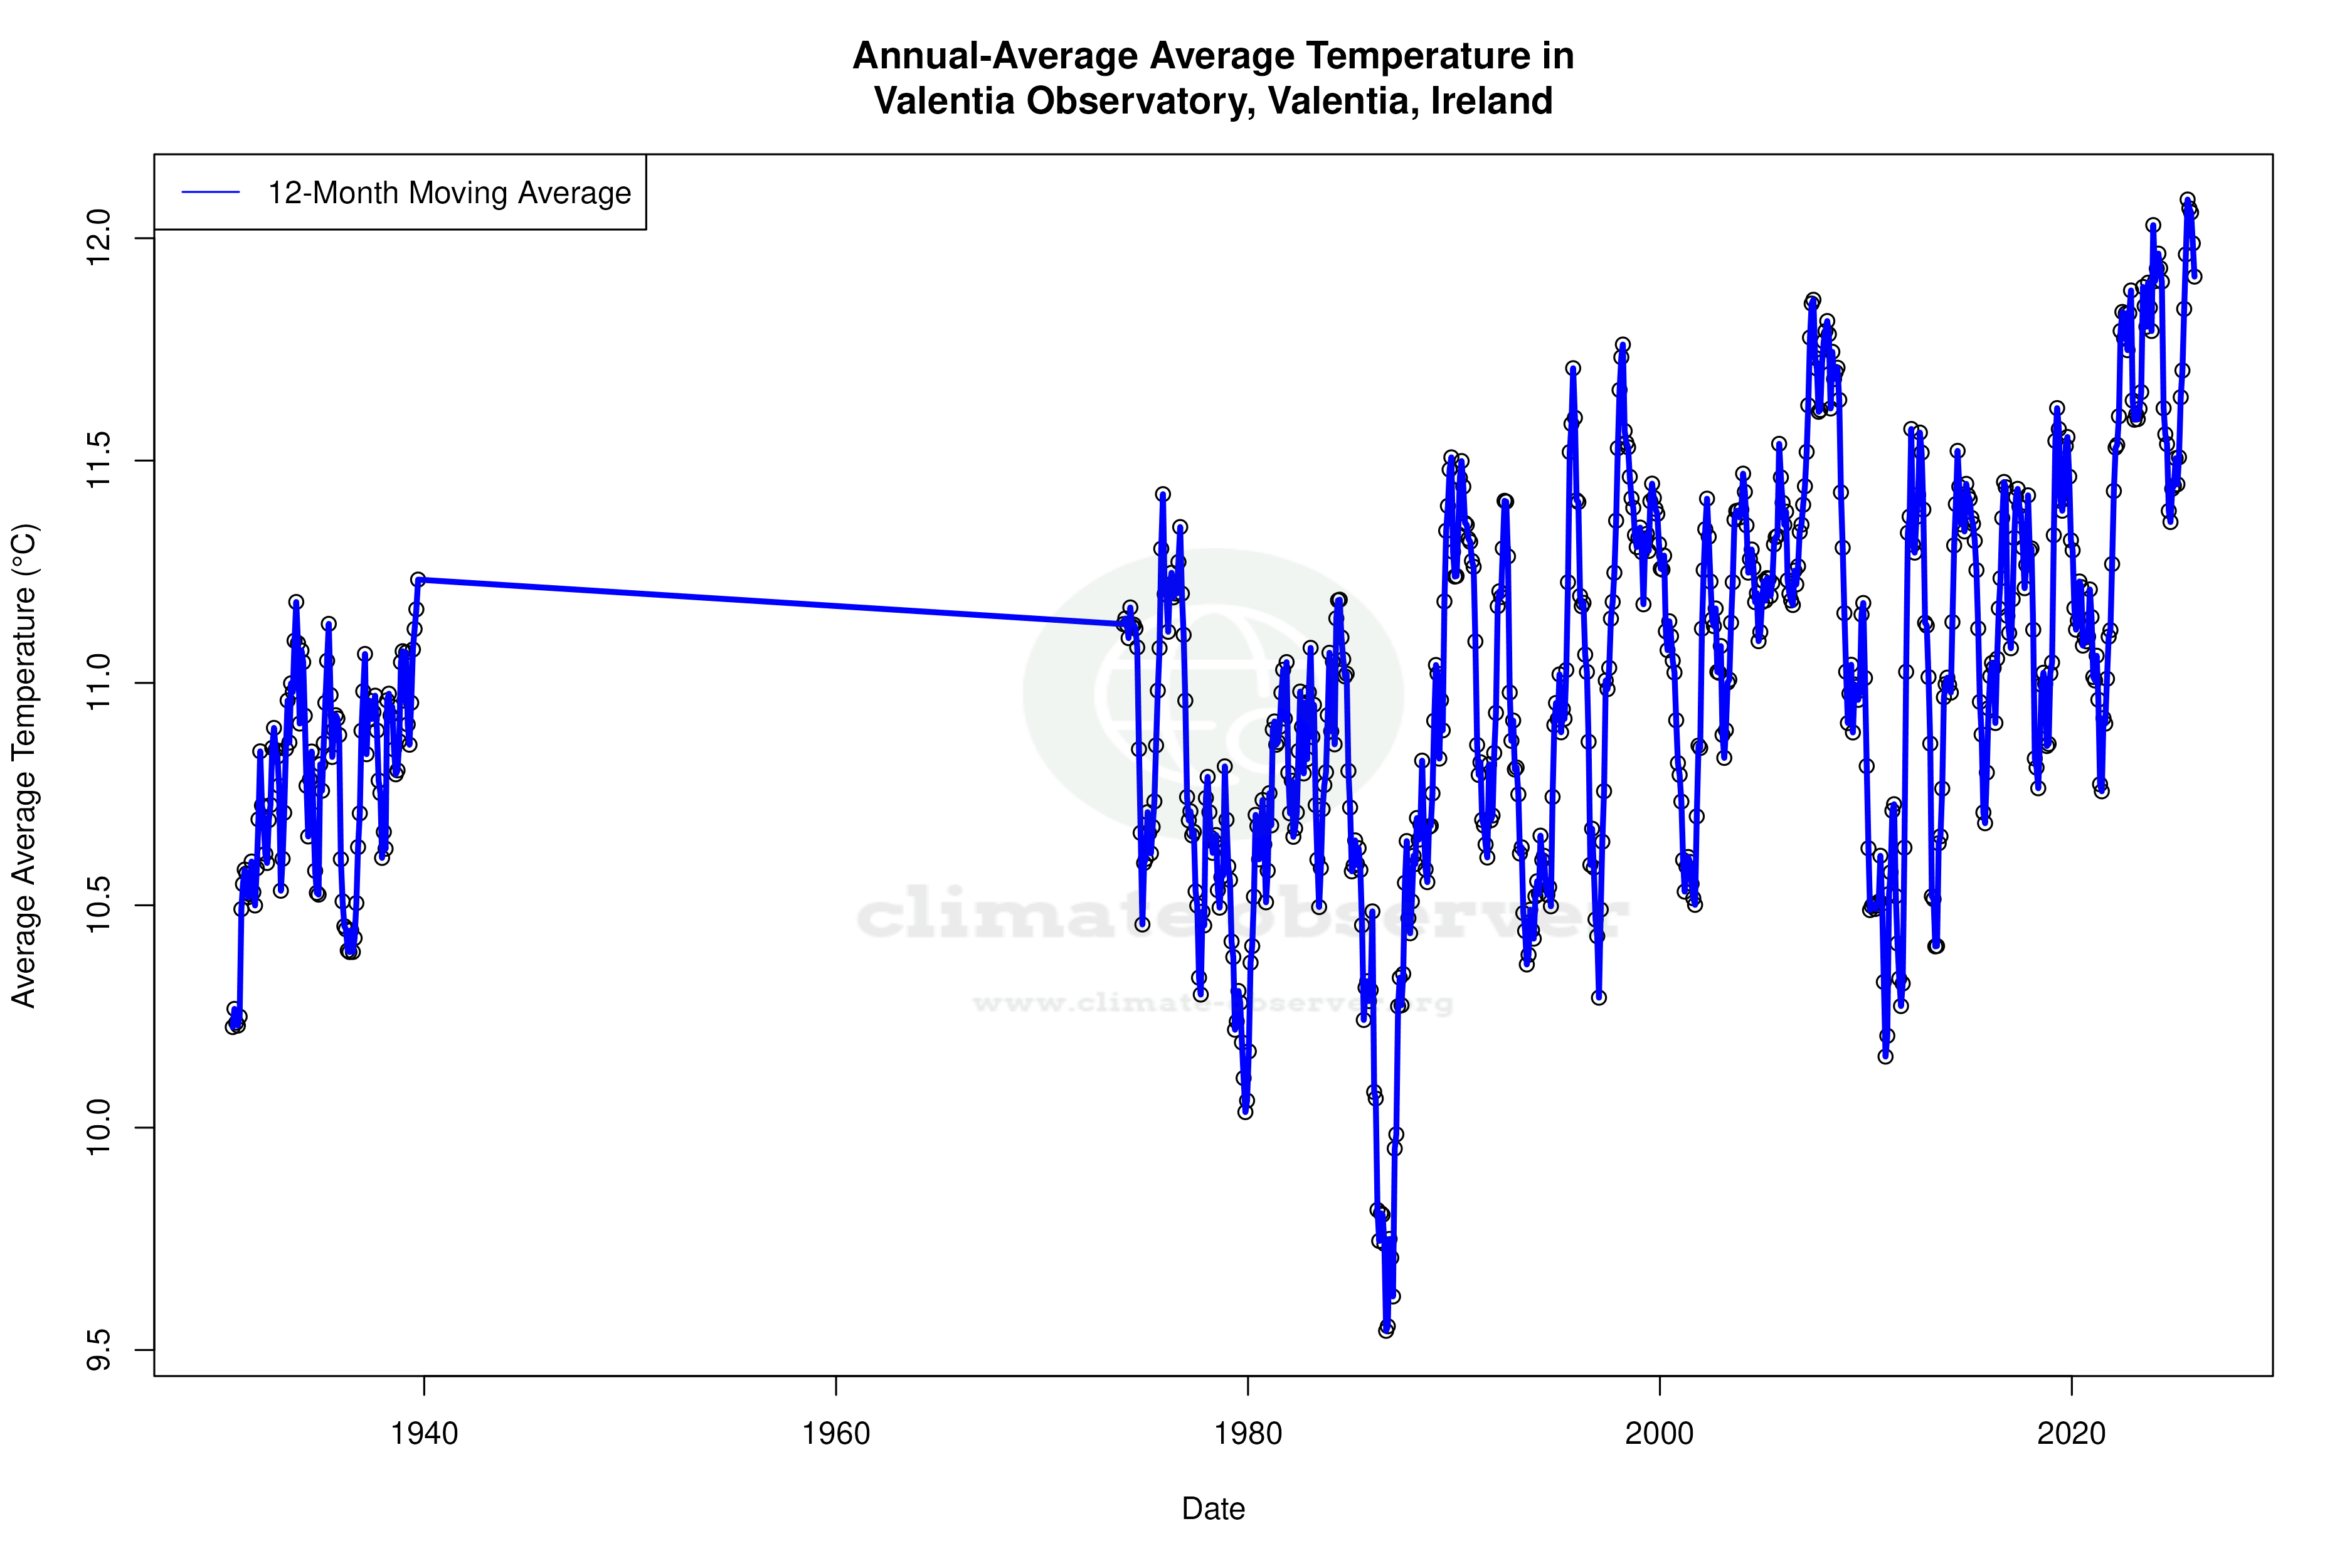


Max Temperature 12-Month MA | 1 of 6
Daily Data Points and Averages Throughout the Year

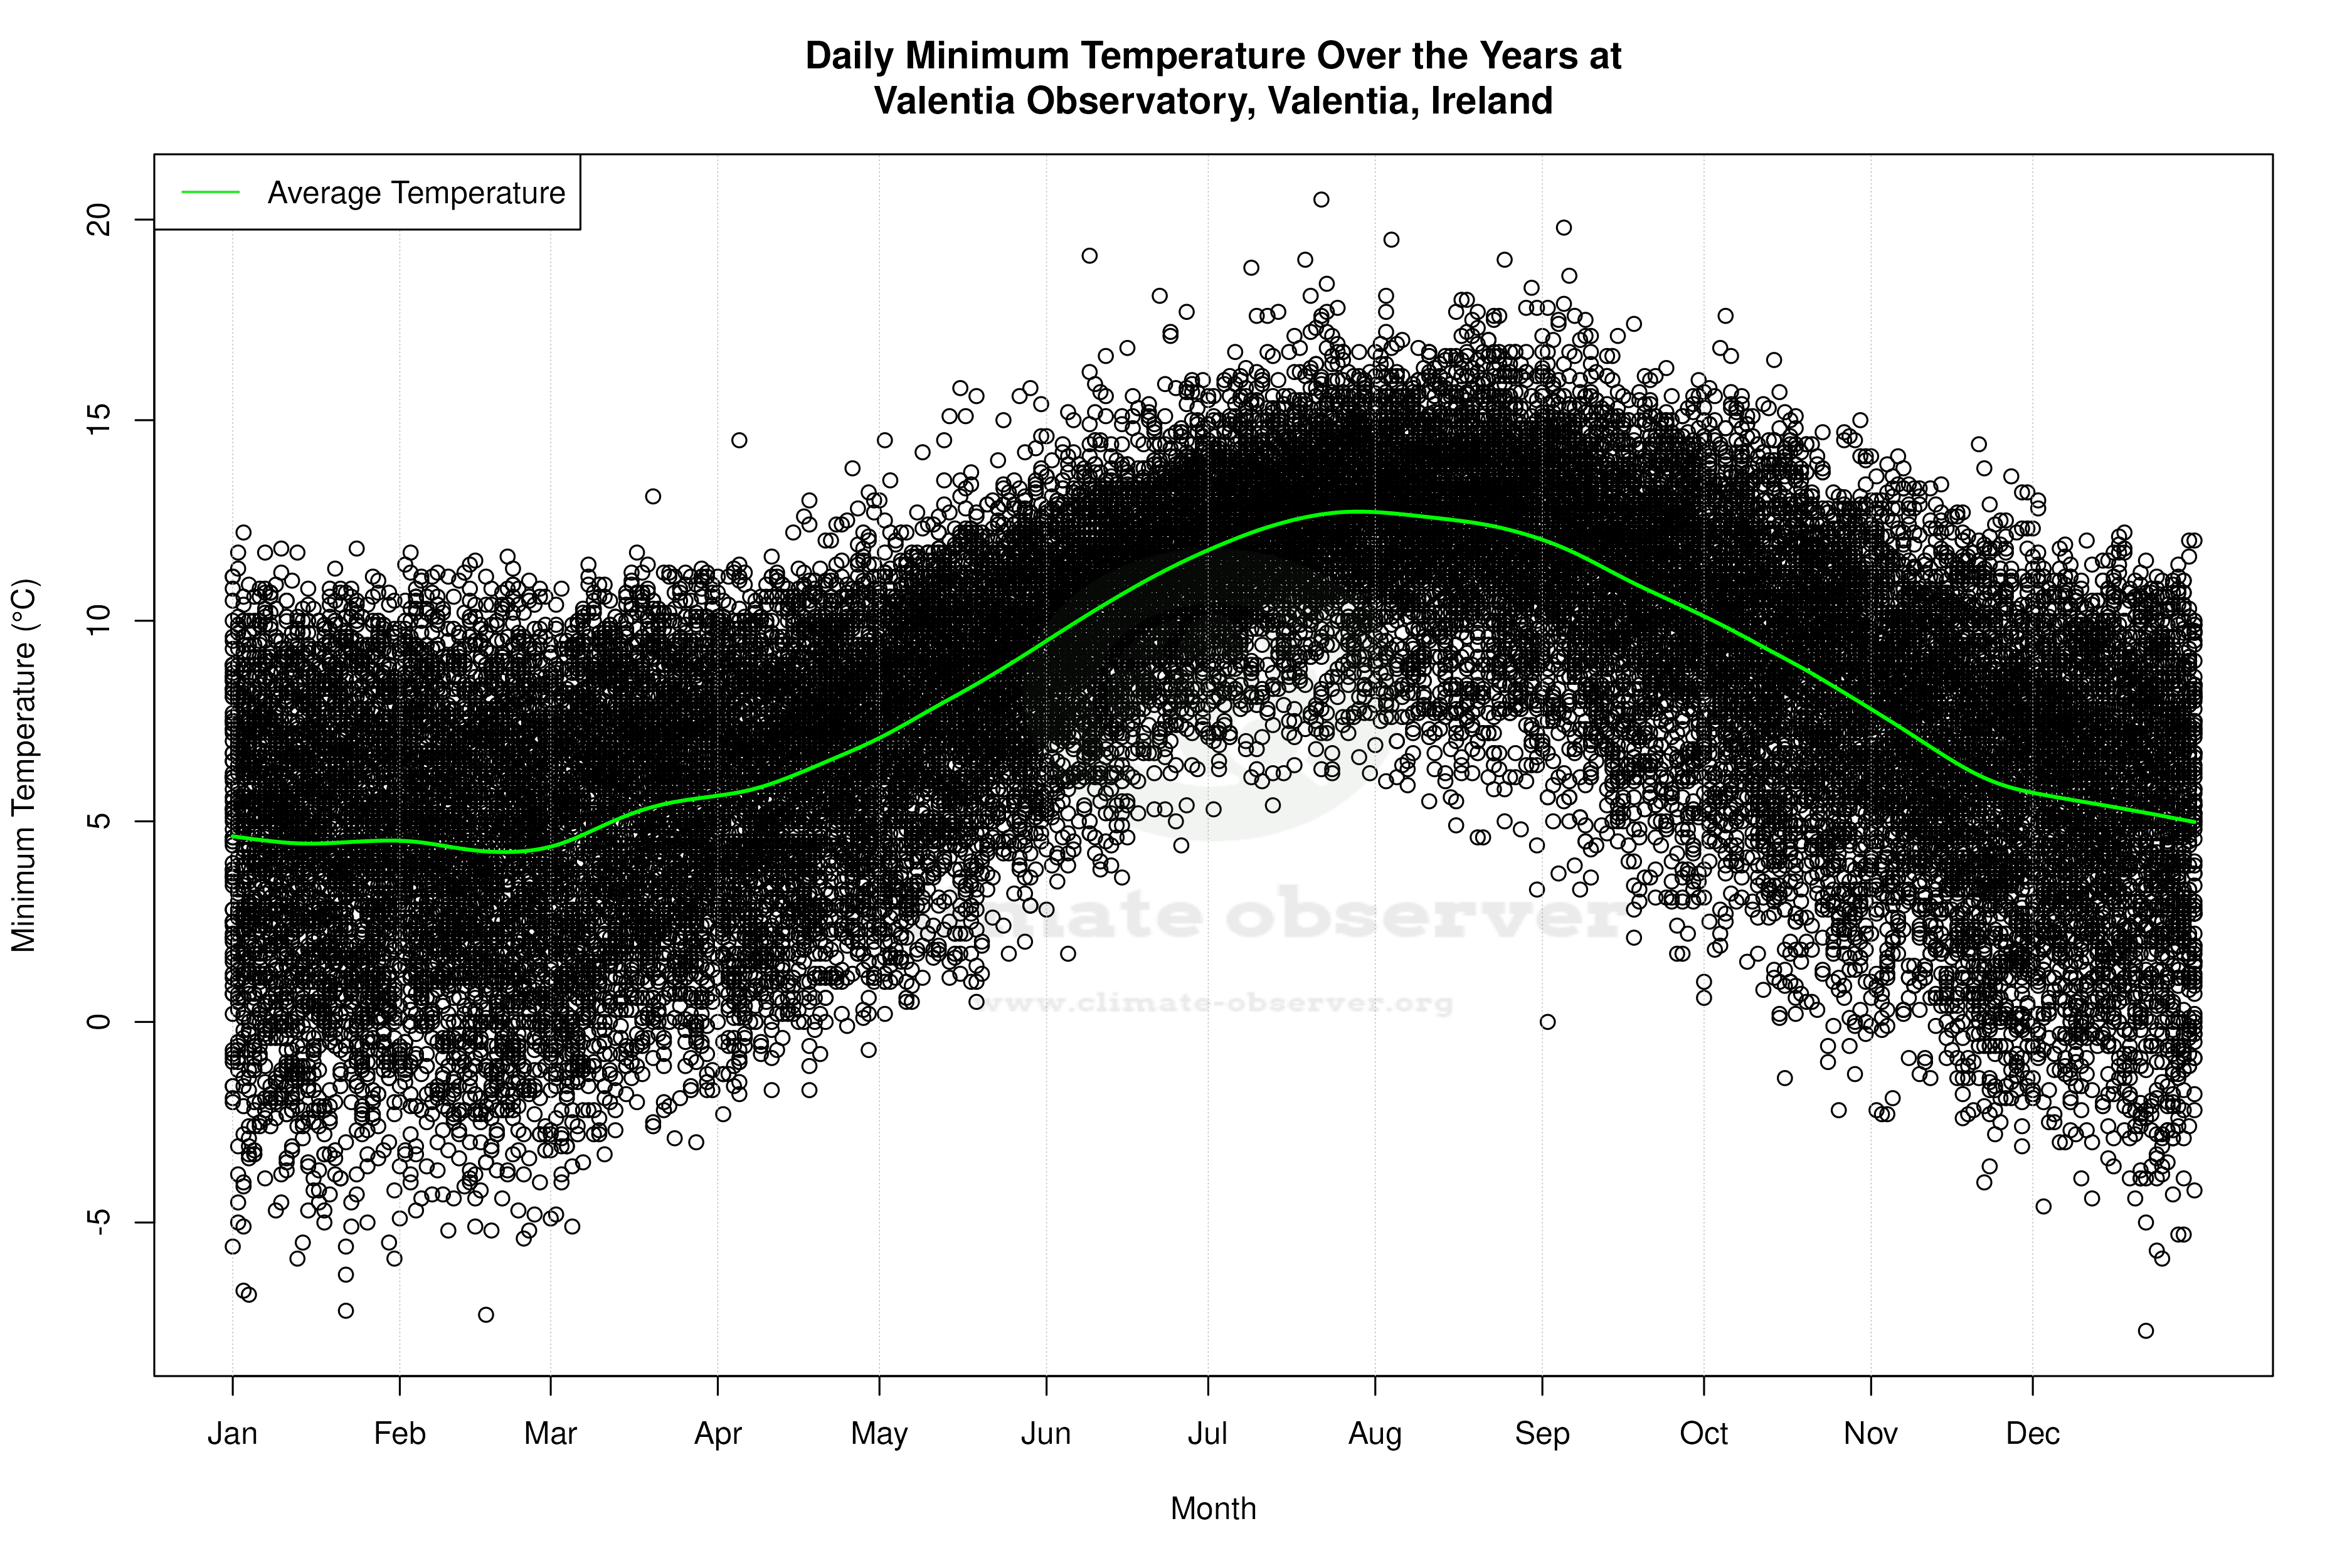
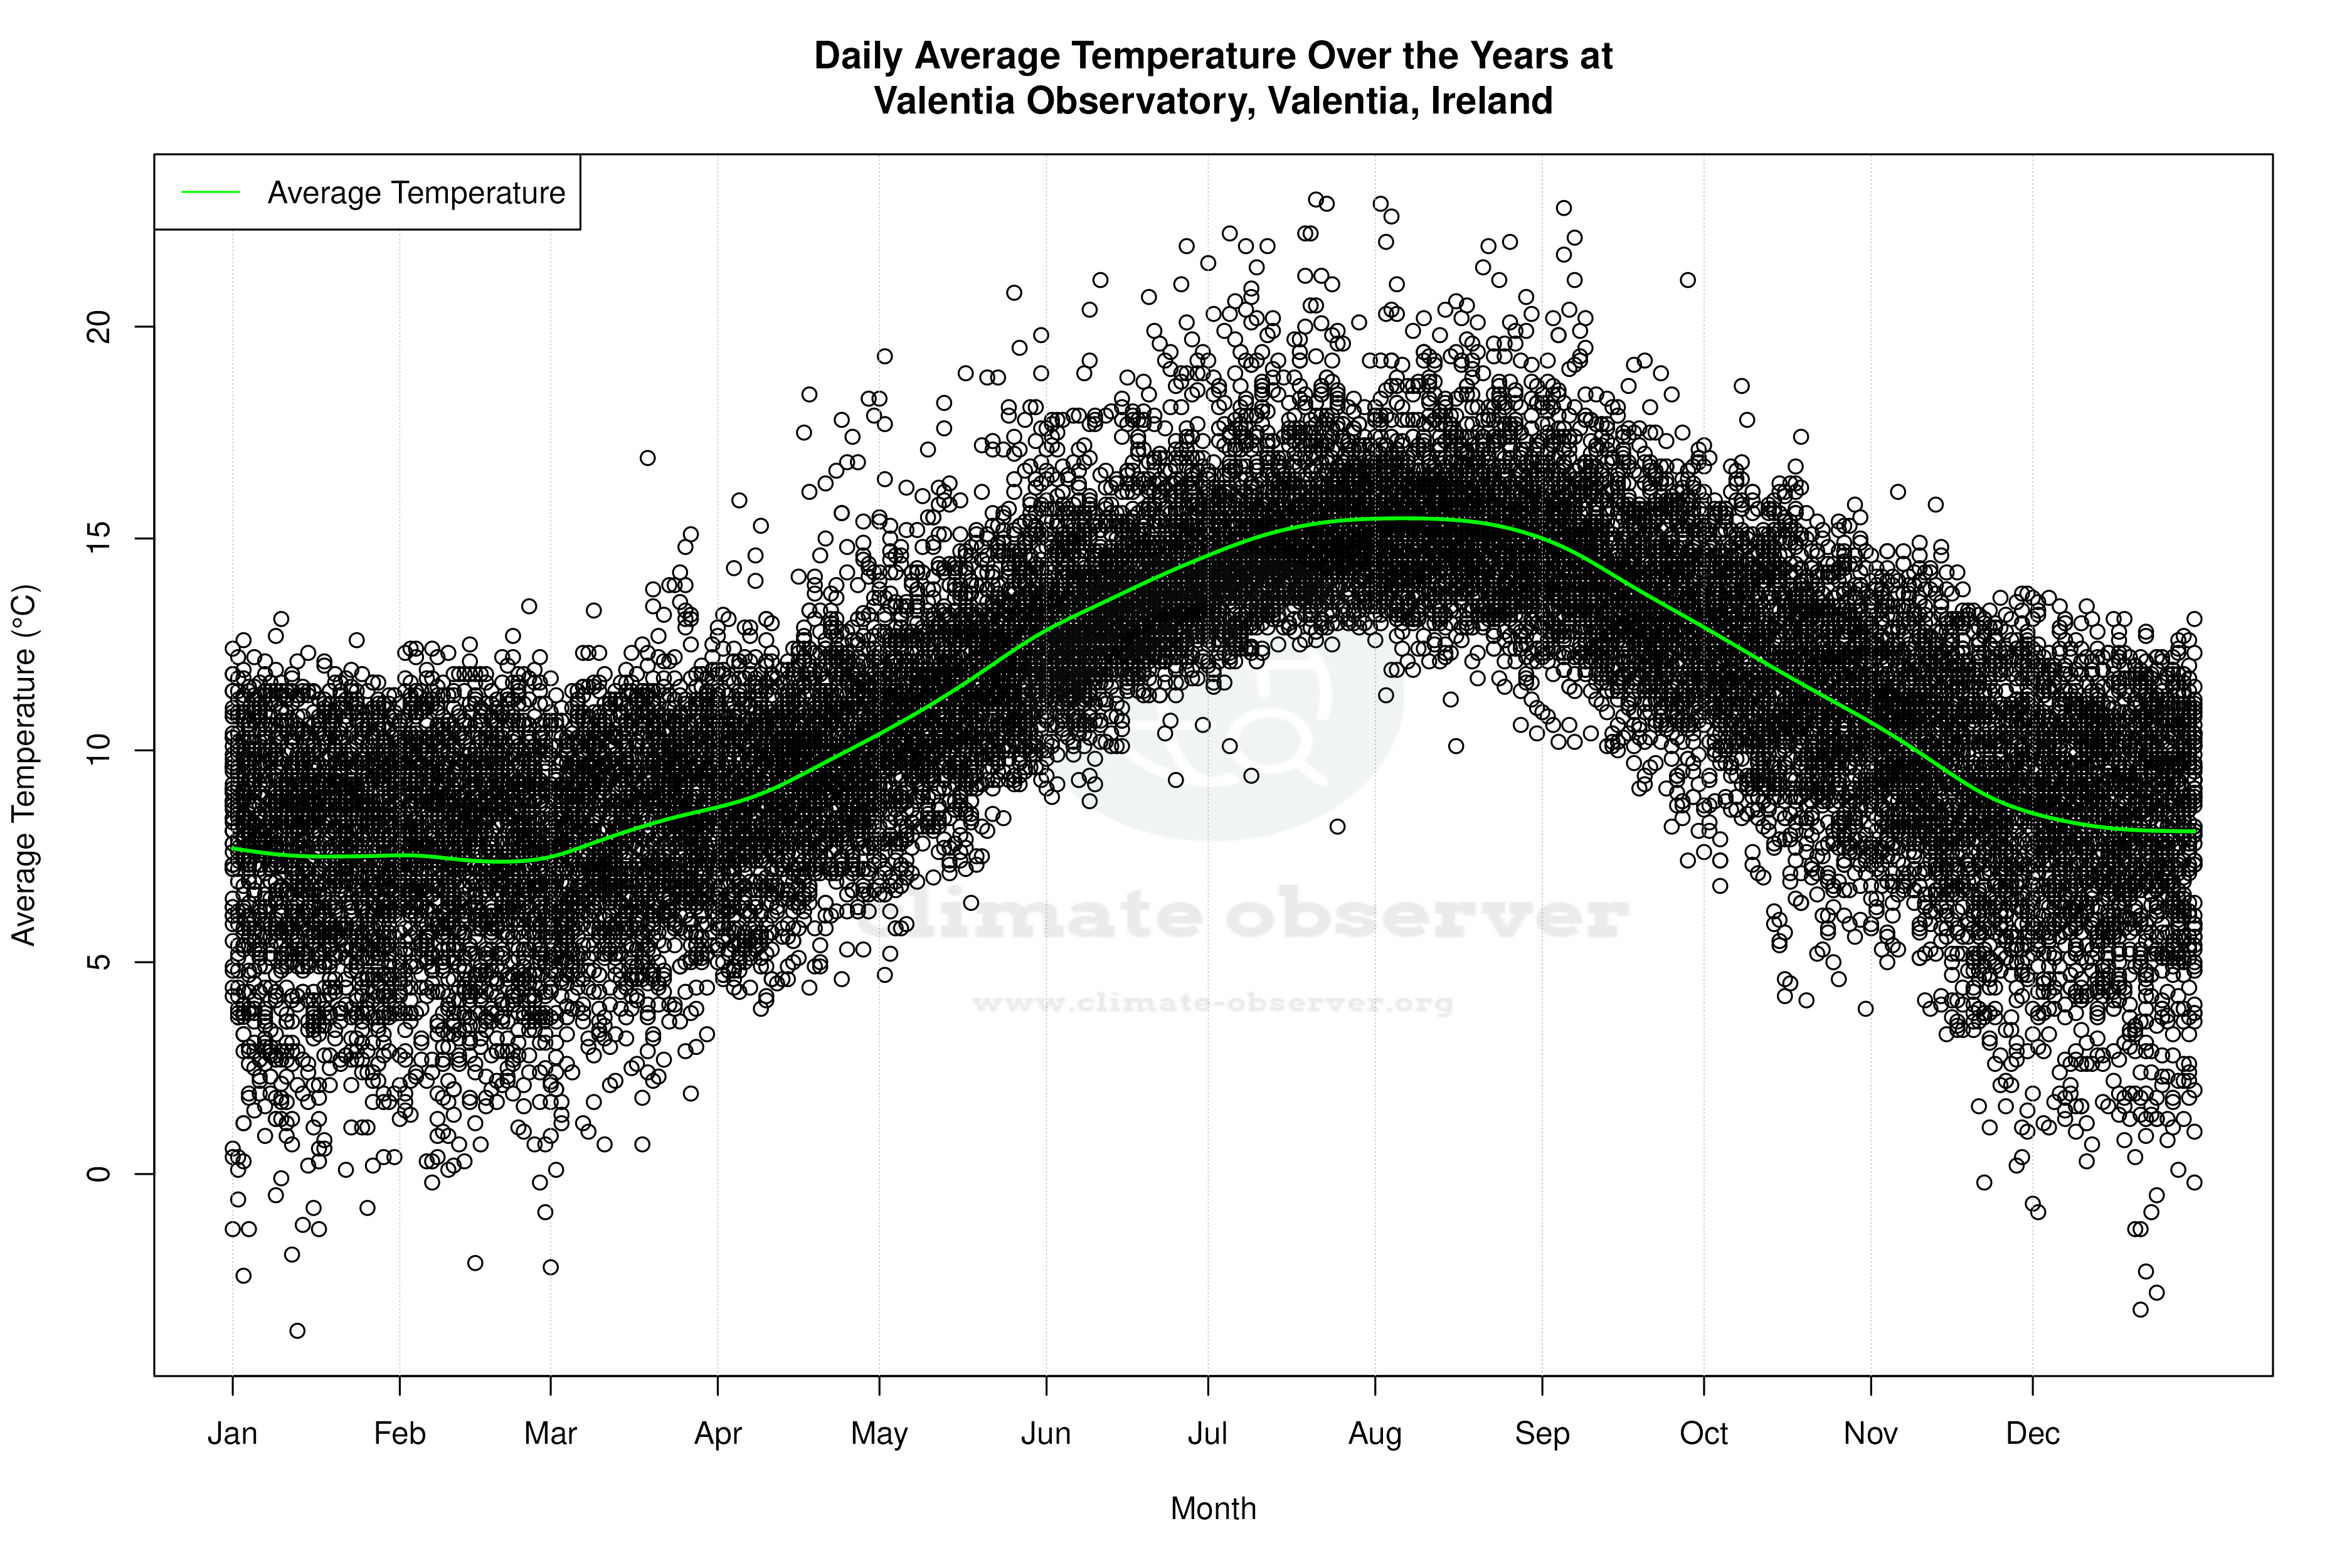


Average Max Temperature Throughout Year | 1 of 5
