Climate for Station: Jimma, Oromia, Ethiopia
Loading live weather...
Climate Analysis & Overview
Jimma's climate profile reveals a complex interplay of warming and cooling trends. While the last decade has seen a rise in low temperatures, the all-time data shows a cooling trend in highs. The precipitation pattern has become slightly more concentrated, indicating changes in rainfall distribution.
A Tale of Two Temperature Trends
Jimma, located in the Oromia region of Ethiopia, is classified under the Köppen climate system as having a tropical savanna climate (Aw). This classification is characterised by distinct wet and dry seasons, influenced by the region's elevation and proximity to the Great Rift Valley. Over the past decade, Jimma has experienced a warming trend in low temperatures, with an increase of 1.45°C (2.61°F). However, this short-term warming contrasts with the all-time trend, where high temperatures have shown a cooling of 0.47°C (0.85°F). This dichotomy suggests a complex climate dynamic, possibly influenced by regional atmospheric patterns and local geographical features.
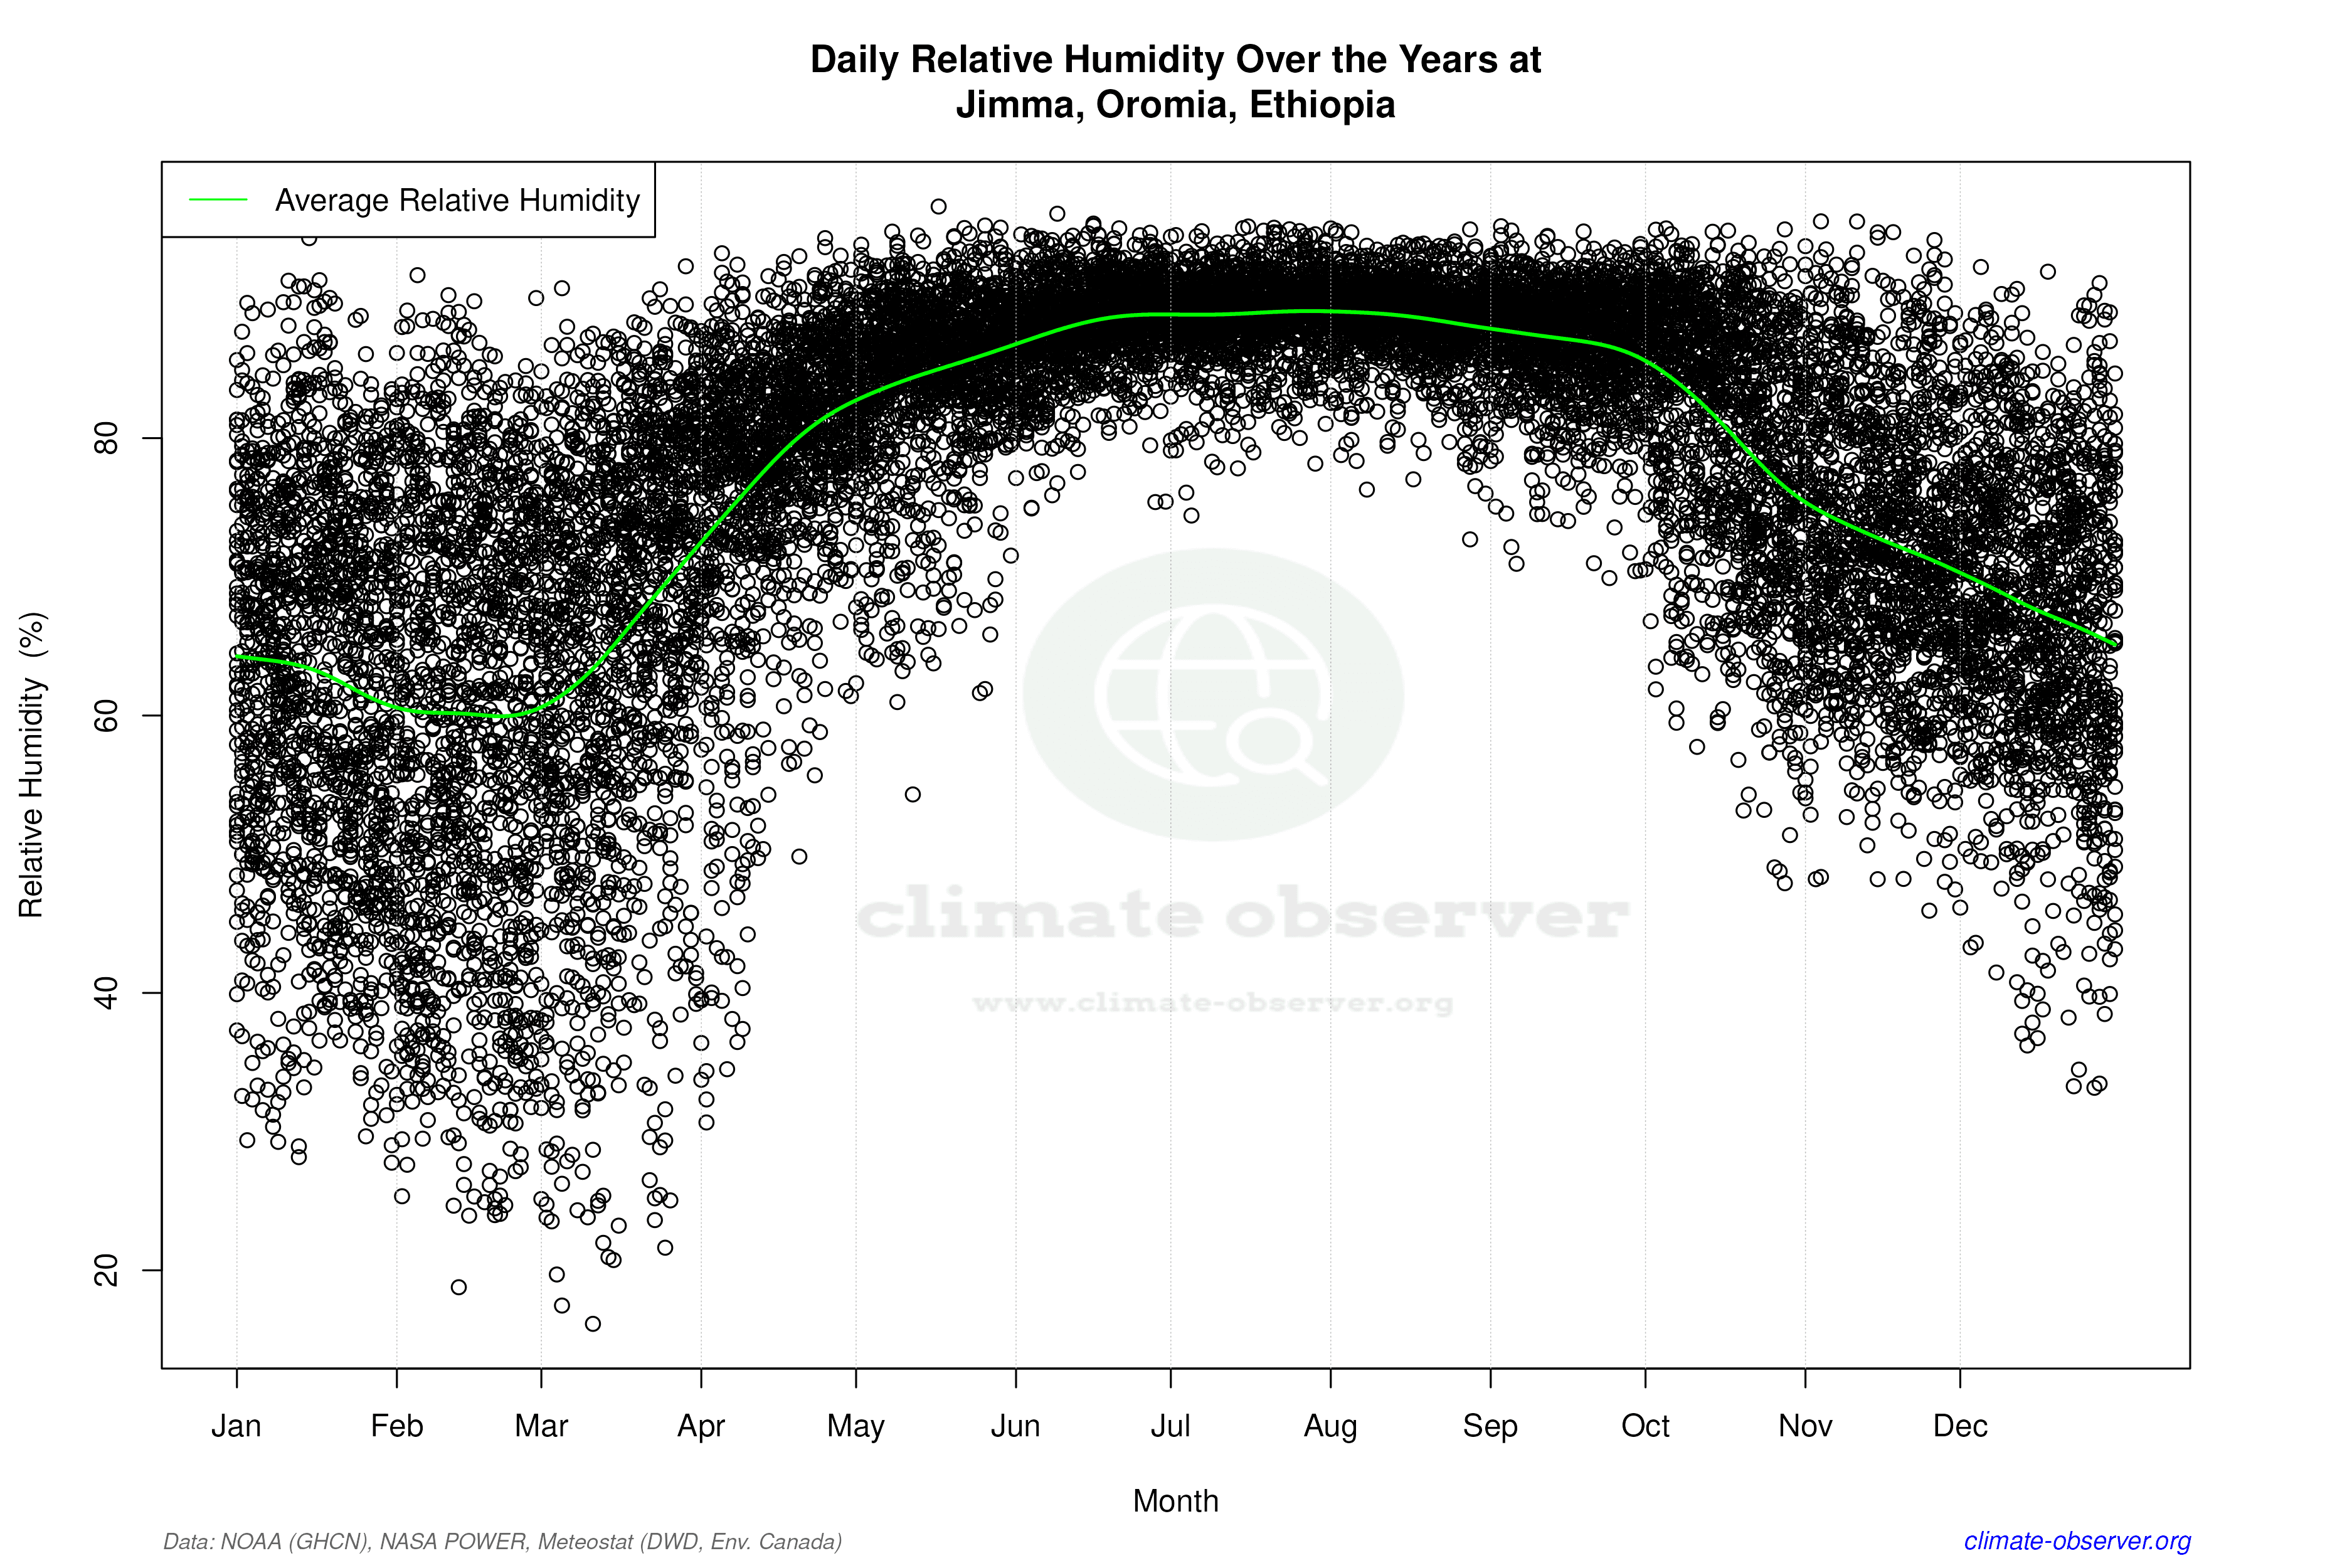
Precipitation Patterns: A Subtle Shift
The Precipitation Concentration Index (PCI) provides insight into how rainfall is distributed over time. Jimma's PCI has seen a marginal increase from a baseline of 12.88 to a current value of 13.33. This indicates a slight shift towards more concentrated rainfall events, meaning that rain is falling in fewer, more intense episodes rather than being evenly distributed throughout the season. While this change is not drastic, it could have implications for agriculture and water management in the region, as concentrated rainfall can lead to increased runoff and potential flooding.
Record Extremes: A Snapshot of Variability
Jimma's climate records highlight the variability typical of a tropical savanna climate. The highest recorded temperature in Jimma is 38.0°C (100.4°F), while the lowest is -2.0°C (28.4°F). These extremes underscore the region's capacity for significant temperature fluctuations, influenced by both seasonal changes and broader climatic shifts. Such variability can affect local ecosystems and human activities, necessitating adaptive strategies to mitigate potential impacts.
Regional Climate Goals and Implications
Ethiopia is actively pursuing climate resilience and sustainability goals, focusing on reducing vulnerability to climate change impacts. The trends observed in Jimma, particularly the warming of low temperatures and the slight increase in precipitation concentration, align with broader regional concerns about climate variability and its effects on agriculture and water resources. These insights are crucial for informing policy and adaptation strategies, ensuring that local communities can effectively respond to changing climatic conditions.
Station Statistics
10-Year Trend
High: +0.08 °F/decade
Low: +3.15 °F/decade
Rain: -0.013 in/decade
25-Year Trend
High: +2.14 °F/decade
Low: +0.10 °F/decade
Rain: +0.007 in/decade
50-Year Trend
High: -0.66 °F/decade
Low: +0.85 °F/decade
Rain: +0.003 in/decade
All-Time Trend
High: -0.81 °F/decade
Low: +0.78 °F/decade
Rain: +0.004 in/decade
Percentage Above-Average Days
Last 12 Months: 38.7%
This Year: 21.5%
Precipitation Concentration Index (PCI) ℹ️
Last 12 Months: 11.7
Historical Average: 12.1
Percentile Rank of Last 12 Months ℹ️
High: 47th percentile
Low: 97th percentile
Rain: 46th percentile
Change in Variance ℹ️
High: -20.0%
Low: -31.4%
Intraday: -33.9%
Data Coverage
87.5%
First Year of Data
1952
Station Location
Historical Weather Records
| Max High | Avg High | Min High | Max Avg | Avg Avg | Min Avg | Max Low | Avg Low | Min Low | Max Precipitation | Avg Precipitation | Max Snow | Avg Snow | |
|---|---|---|---|---|---|---|---|---|---|---|---|---|---|
| Record | 100.40 °F | — | 59.90 °F | 84.92 °F | — | 46.40 °F | 65.48 °F | — | 28.40 °F | 4.16 in | — | — | — |
| January | 95.00 °F | 80.22 °F | 62.24 °F | 76.64 °F | 65.35 °F | 48.56 °F | 61.88 °F | 49.34 °F | 28.40 °F | 1.46 in | 0.04 in | — | — |
| February | 96.26 °F | 82.47 °F | 65.73 °F | 80.96 °F | 68.05 °F | 52.88 °F | 64.96 °F | 52.06 °F | 32.00 °F | 2.23 in | 0.07 in | — | — |
| March | 99.86 °F | 82.50 °F | 65.68 °F | 82.94 °F | 69.00 °F | 50.18 °F | 65.41 °F | 54.87 °F | 32.00 °F | 4.16 in | 0.13 in | — | — |
| April | 100.40 °F | 80.22 °F | 64.65 °F | 81.50 °F | 67.99 °F | 57.02 °F | 64.40 °F | 56.04 °F | 34.70 °F | 2.52 in | 0.22 in | — | — |
| May | 94.46 °F | 77.95 °F | 64.44 °F | 81.50 °F | 66.77 °F | 57.74 °F | 65.48 °F | 56.40 °F | 39.92 °F | 3.73 in | 0.25 in | — | — |
| June | 87.98 °F | 75.07 °F | 60.73 °F | 78.08 °F | 64.87 °F | 58.46 °F | 61.70 °F | 55.96 °F | 41.00 °F | 2.95 in | 0.29 in | — | — |
| July | 84.20 °F | 72.93 °F | 59.90 °F | 75.56 °F | 63.56 °F | 55.76 °F | 62.60 °F | 56.02 °F | 47.12 °F | 3.23 in | 0.27 in | — | — |
| August | 84.02 °F | 73.38 °F | 61.56 °F | 76.10 °F | 63.51 °F | 56.66 °F | 61.70 °F | 55.93 °F | 46.22 °F | 2.50 in | 0.28 in | — | — |
| September | 88.88 °F | 74.81 °F | 62.82 °F | 77.00 °F | 64.50 °F | 56.48 °F | 63.32 °F | 55.85 °F | 46.04 °F | 2.92 in | 0.25 in | — | — |
| October | 86.00 °F | 76.76 °F | 63.99 °F | 78.44 °F | 65.04 °F | 49.46 °F | 62.24 °F | 53.24 °F | 36.86 °F | 2.44 in | 0.16 in | — | — |
| November | 87.80 °F | 77.46 °F | 64.11 °F | 75.74 °F | 64.34 °F | 51.26 °F | 60.91 °F | 49.56 °F | 32.00 °F | 2.31 in | 0.09 in | — | — |
| December | 88.88 °F | 78.37 °F | 63.73 °F | 84.92 °F | 64.16 °F | 46.40 °F | 61.16 °F | 47.87 °F | 32.00 °F | 2.23 in | 0.04 in | — | — |
Data Visualisations
Remove WatermarksCurrent Year Climate Trends vs Historical


Max Temperature this Year | 1 of 6
Climate 12-Month Moving Averages


Max Temperature 12-Month MA | 1 of 6
Daily Data Points and Averages Throughout the Year


Average Max Temperature Throughout Year | 1 of 5
