Climate for Station: Addis Ababa-Bole, Addis Ababa, Ethiopia
Loading live weather...
Climate Analysis & Overview
Addis Ababa-Bole is experiencing a complex climate narrative with a notable rise in low temperatures and a slight cooling in highs over the past decade. This is compounded by a more concentrated precipitation pattern, indicating shifts in the local climate dynamics.
A Tale of Two Temperature Trends
Addis Ababa-Bole, nestled in the highlands of Ethiopia, is classified under the Köppen climate system as a subtropical highland climate (Cwb). This classification is characterised by mild temperatures and distinct wet and dry seasons. Over the past decade, the region has experienced a rise in low temperatures by 1.68°C (3.02°F), suggesting a warming trend during cooler periods. Conversely, there has been a cooling of high temperatures by 0.60°C (1.08°F), indicating milder conditions during the hottest times of the year. This duality in temperature trends highlights a complex interplay of local geographical influences, such as elevation and proximity to the Rift Valley, which can moderate temperature extremes.
Long-Term Climatic Shifts
In examining the all-time temperature trends, a subtle yet significant warming pattern emerges. The all-time highs have increased by 0.14°C (0.25°F), while the lows have risen by 0.61°C (1.10°F). This gradual warming trend aligns with broader regional climate goals of understanding and adapting to climate change impacts. These shifts, though modest, could have implications for agriculture and water resources, which are critical to Ethiopia's economy and food security.
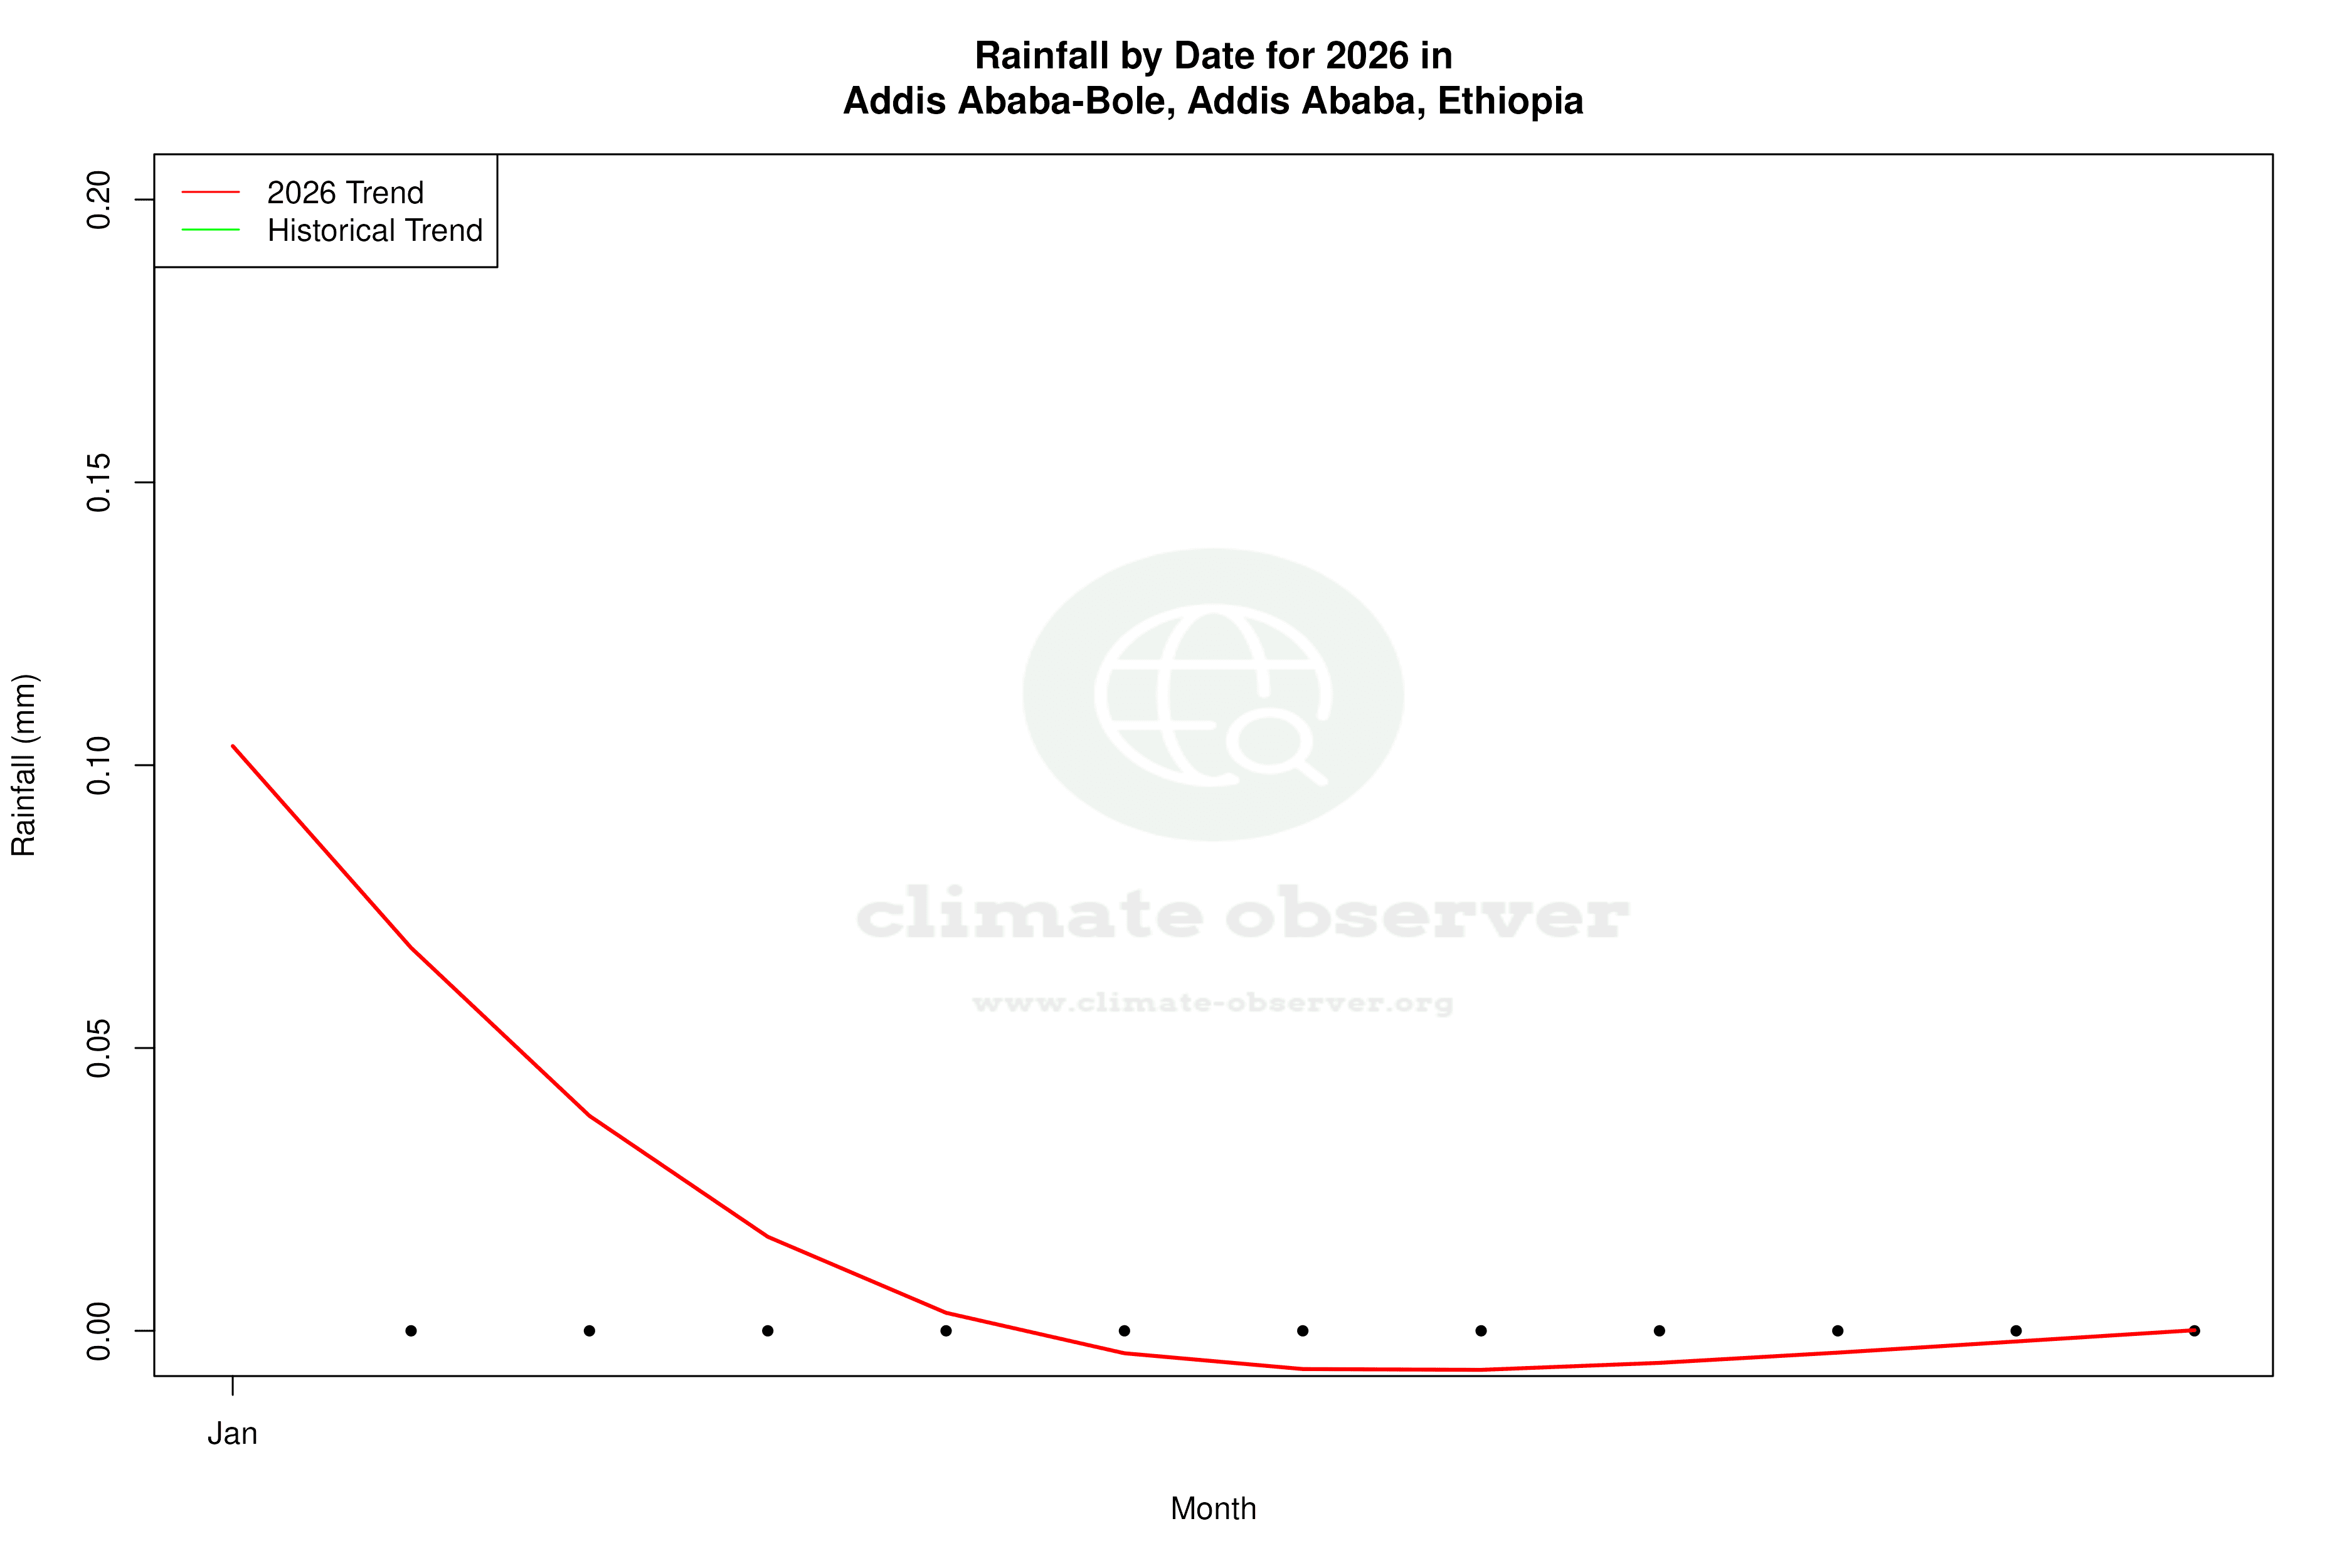
Precipitation Patterns: A Concentrated Shift
The Precipitation Concentration Index (PCI) for Addis Ababa-Bole has shown a change from a baseline of 16.93 to a current value of 18.68. The PCI is a measure of how precipitation is distributed throughout the year. An increase in PCI indicates that rainfall events are becoming more concentrated, occurring in fewer, more intense episodes. This could result in challenges such as increased risk of flooding and soil erosion during heavy rains, while also potentially leading to longer dry spells between these events.
Temperature Extremes: Record Observations
The station has recorded an all-time maximum temperature of 34.0°C (93.2°F) and a minimum of 0.0°C (32.0°F). These extremes underscore the variability inherent in the region's climate, influenced by its high altitude and equatorial location. Such variability can impact local ecosystems, agriculture, and urban planning, necessitating adaptive strategies to mitigate potential adverse effects.
Regional Climate Context
Ethiopia's commitment to addressing climate change is evident in its national policies aimed at reducing greenhouse gas emissions and enhancing climate resilience. Recent weather events, such as unseasonal rainfall and temperature fluctuations, serve as reminders of the pressing need for comprehensive climate strategies. Addis Ababa-Bole's climate data provides valuable insights into these broader patterns, informing both local and national adaptation efforts.
Station Statistics
10-Year Trend
High: -0.99 °F/decade
Low: +3.46 °F/decade
Rain: +0.029 in/decade
25-Year Trend
High: -0.51 °F/decade
Low: +1.69 °F/decade
Rain: +0.019 in/decade
50-Year Trend
High: +0.27 °F/decade
Low: +1.23 °F/decade
Rain: -0.000 in/decade
All-Time Trend
High: +0.27 °F/decade
Low: +1.10 °F/decade
Rain: +0.000 in/decade
Percentage Above-Average Days
Last 12 Months: 38.1%
This Year: 43.0%
Precipitation Concentration Index (PCI) ℹ️
Last 12 Months: 19.1
Historical Average: 16.2
Percentile Rank of Last 12 Months ℹ️
High: 49th percentile
Low: 97th percentile
Rain: 49th percentile
Change in Variance ℹ️
High: -1.1%
Low: -39.5%
Intraday: -29.2%
Data Coverage
87.0%
First Year of Data
1957
Station Location
Historical Weather Records
| Max High | Avg High | Min High | Max Avg | Avg Avg | Min Avg | Max Low | Avg Low | Min Low | Max Precipitation | Avg Precipitation | Max Snow | Avg Snow | |
|---|---|---|---|---|---|---|---|---|---|---|---|---|---|
| Record | 93.20 °F | — | 56.48 °F | 77.00 °F | — | 47.84 °F | 62.96 °F | — | 32.00 °F | 3.09 in | — | — | — |
| January | 83.84 °F | 74.35 °F | 60.80 °F | 71.42 °F | 60.76 °F | 47.84 °F | 58.46 °F | 45.91 °F | 32.00 °F | 1.42 in | 0.02 in | — | — |
| February | 91.40 °F | 76.42 °F | 61.16 °F | 76.10 °F | 63.21 °F | 50.54 °F | 62.96 °F | 48.68 °F | 32.18 °F | 1.97 in | 0.05 in | — | — |
| March | 87.80 °F | 77.27 °F | 60.08 °F | 75.74 °F | 64.60 °F | 51.44 °F | 61.34 °F | 51.26 °F | 32.00 °F | 3.09 in | 0.08 in | — | — |
| April | 87.80 °F | 76.70 °F | 61.70 °F | 77.00 °F | 64.69 °F | 56.17 °F | 61.70 °F | 52.42 °F | 36.50 °F | 2.44 in | 0.12 in | — | — |
| May | 91.40 °F | 77.34 °F | 59.90 °F | 76.64 °F | 65.41 °F | 56.84 °F | 61.70 °F | 52.63 °F | 39.20 °F | 2.40 in | 0.11 in | — | — |
| June | 93.20 °F | 74.37 °F | 63.50 °F | 75.38 °F | 62.95 °F | 54.86 °F | 62.24 °F | 52.15 °F | 33.80 °F | 2.80 in | 0.15 in | — | — |
| July | 84.38 °F | 69.55 °F | 59.00 °F | 70.88 °F | 60.20 °F | 53.42 °F | 60.80 °F | 52.40 °F | 41.72 °F | 2.66 in | 0.29 in | — | — |
| August | 82.40 °F | 69.24 °F | 56.48 °F | 67.10 °F | 60.06 °F | 53.24 °F | 59.00 °F | 52.22 °F | 42.26 °F | 2.56 in | 0.29 in | — | — |
| September | 86.00 °F | 70.66 °F | 59.86 °F | 69.26 °F | 61.03 °F | 51.62 °F | 58.28 °F | 51.23 °F | 39.02 °F | 2.05 in | 0.18 in | — | — |
| October | 84.20 °F | 72.65 °F | 61.70 °F | 71.42 °F | 61.44 °F | 49.50 °F | 59.00 °F | 47.34 °F | 32.00 °F | 1.87 in | 0.05 in | — | — |
| November | 82.63 °F | 72.86 °F | 63.23 °F | 70.70 °F | 60.39 °F | 49.93 °F | 58.10 °F | 44.46 °F | 32.00 °F | 1.57 in | 0.01 in | — | — |
| December | 81.37 °F | 73.03 °F | 63.14 °F | 70.34 °F | 59.51 °F | 48.20 °F | 58.64 °F | 43.70 °F | 32.00 °F | 1.57 in | 0.01 in | — | — |
Data Visualisations
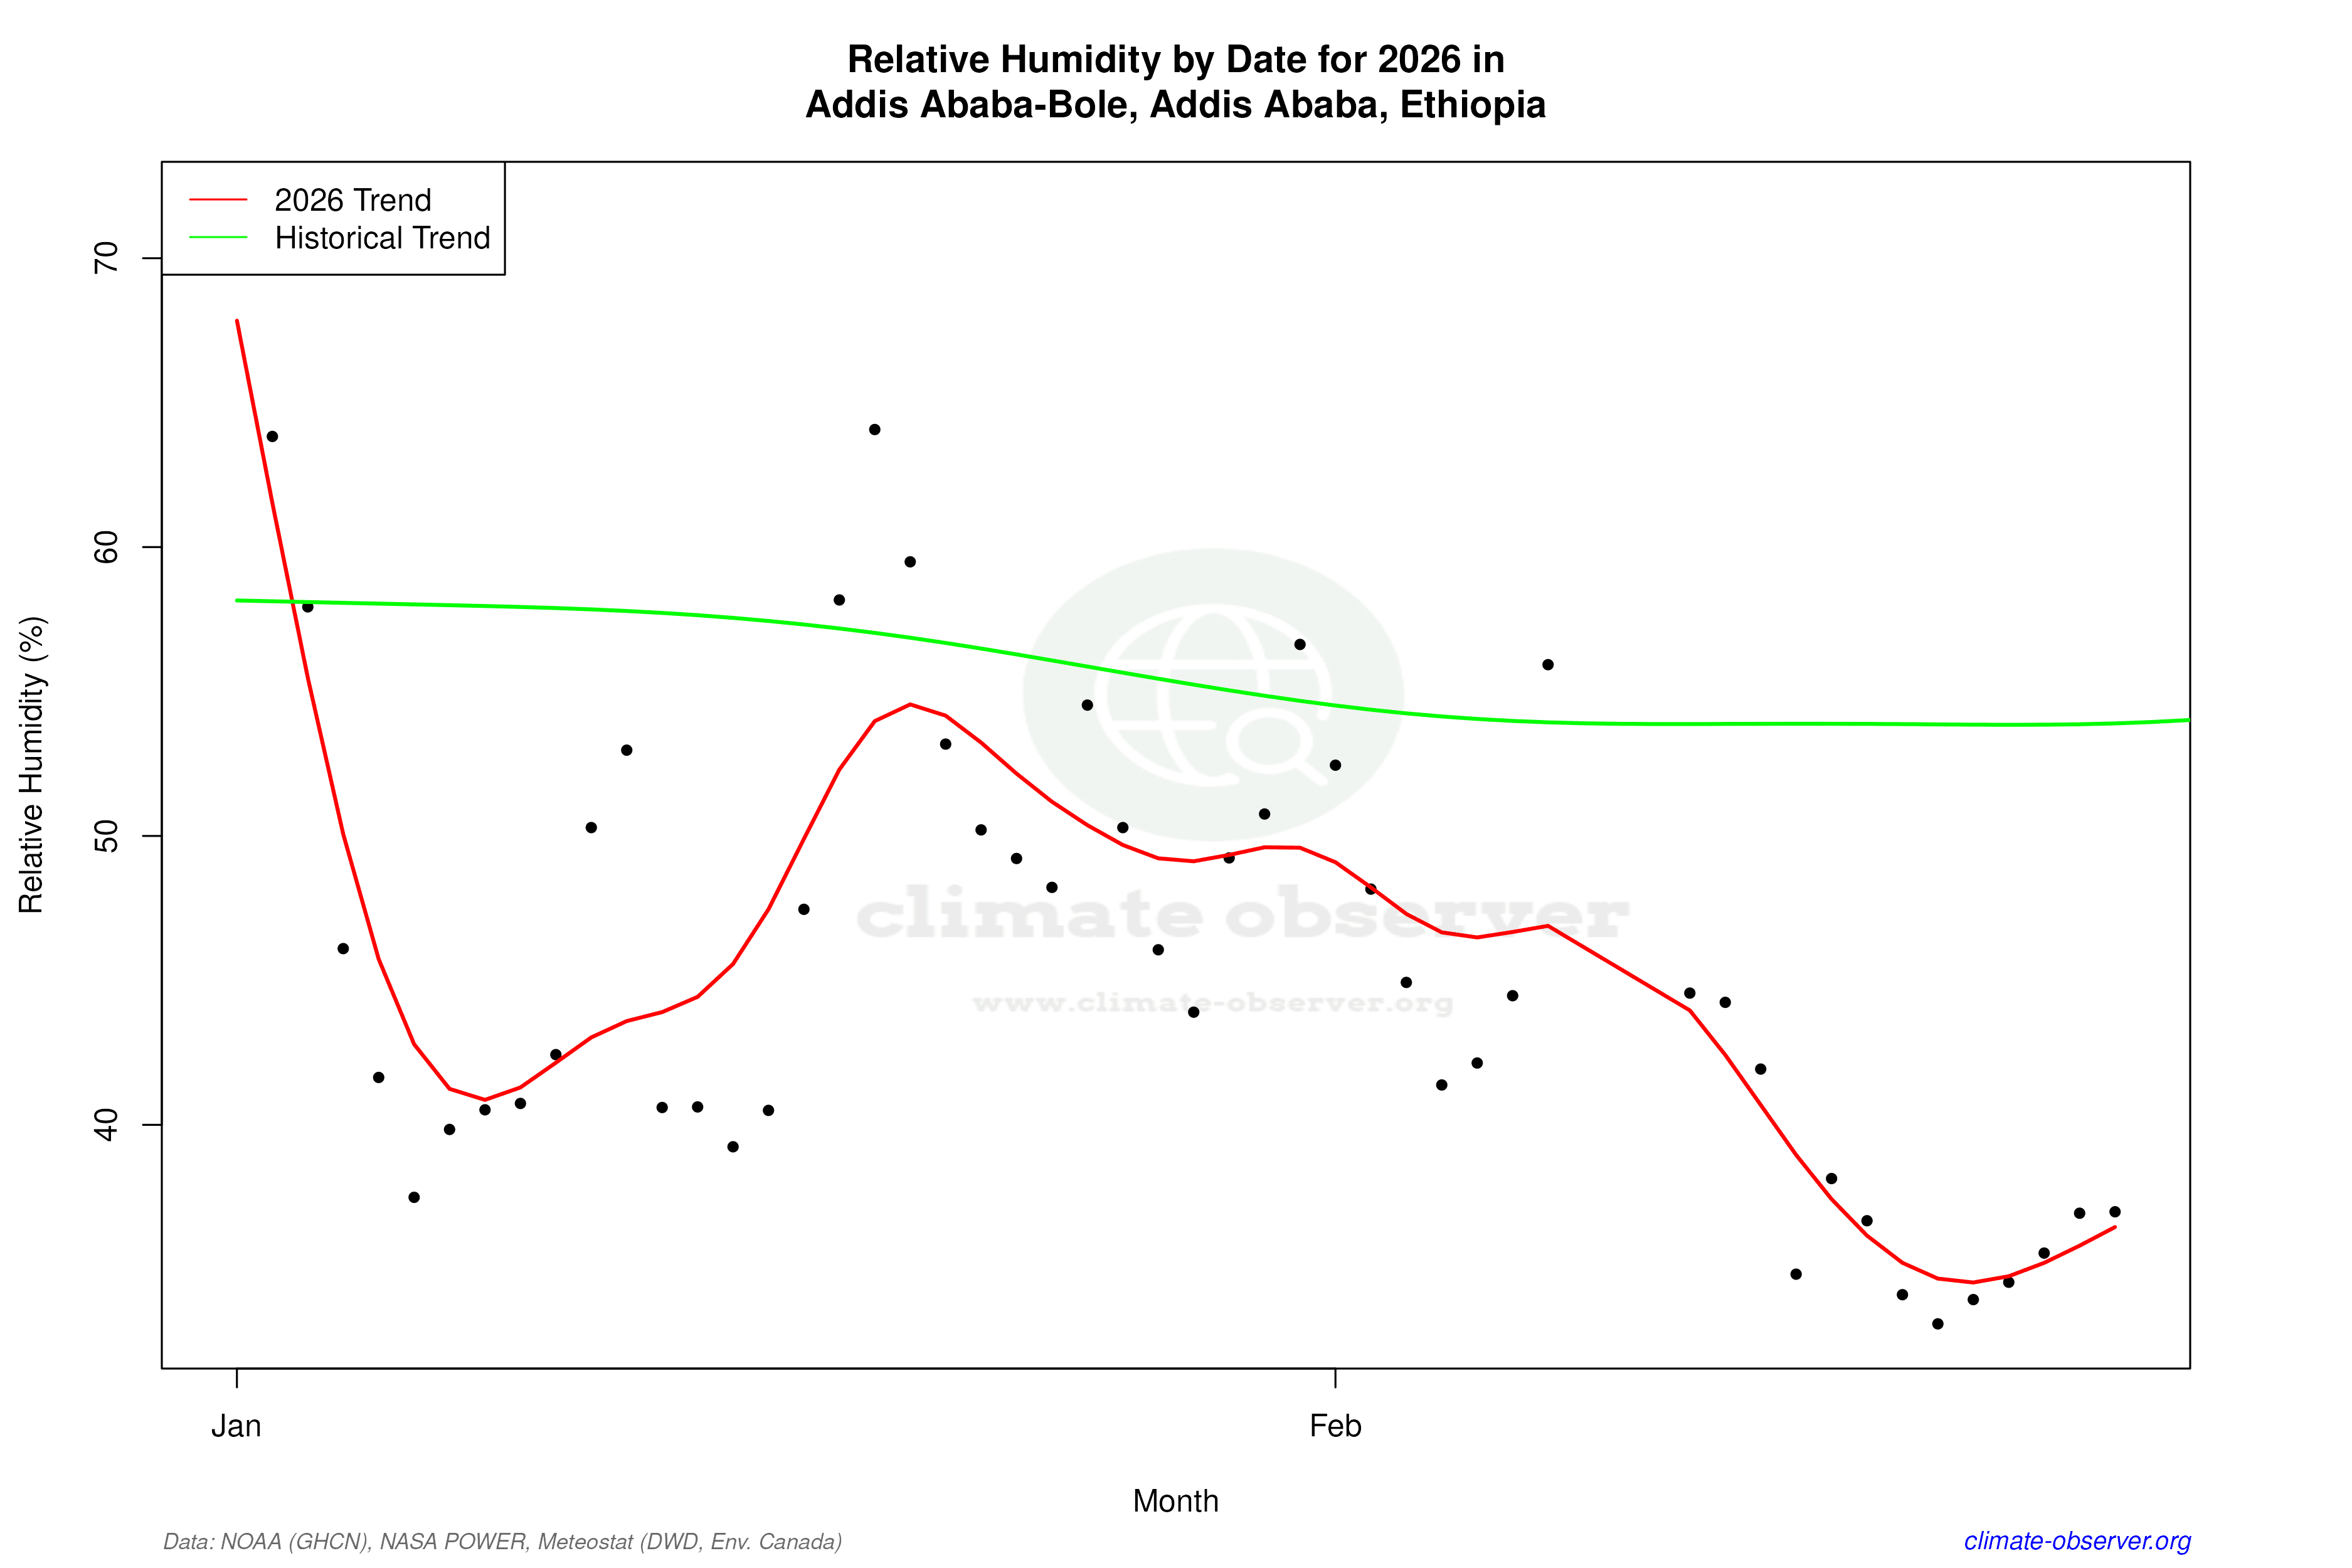
Remove WatermarksCurrent Year Climate Trends vs Historical


Max Temperature this Year | 1 of 6
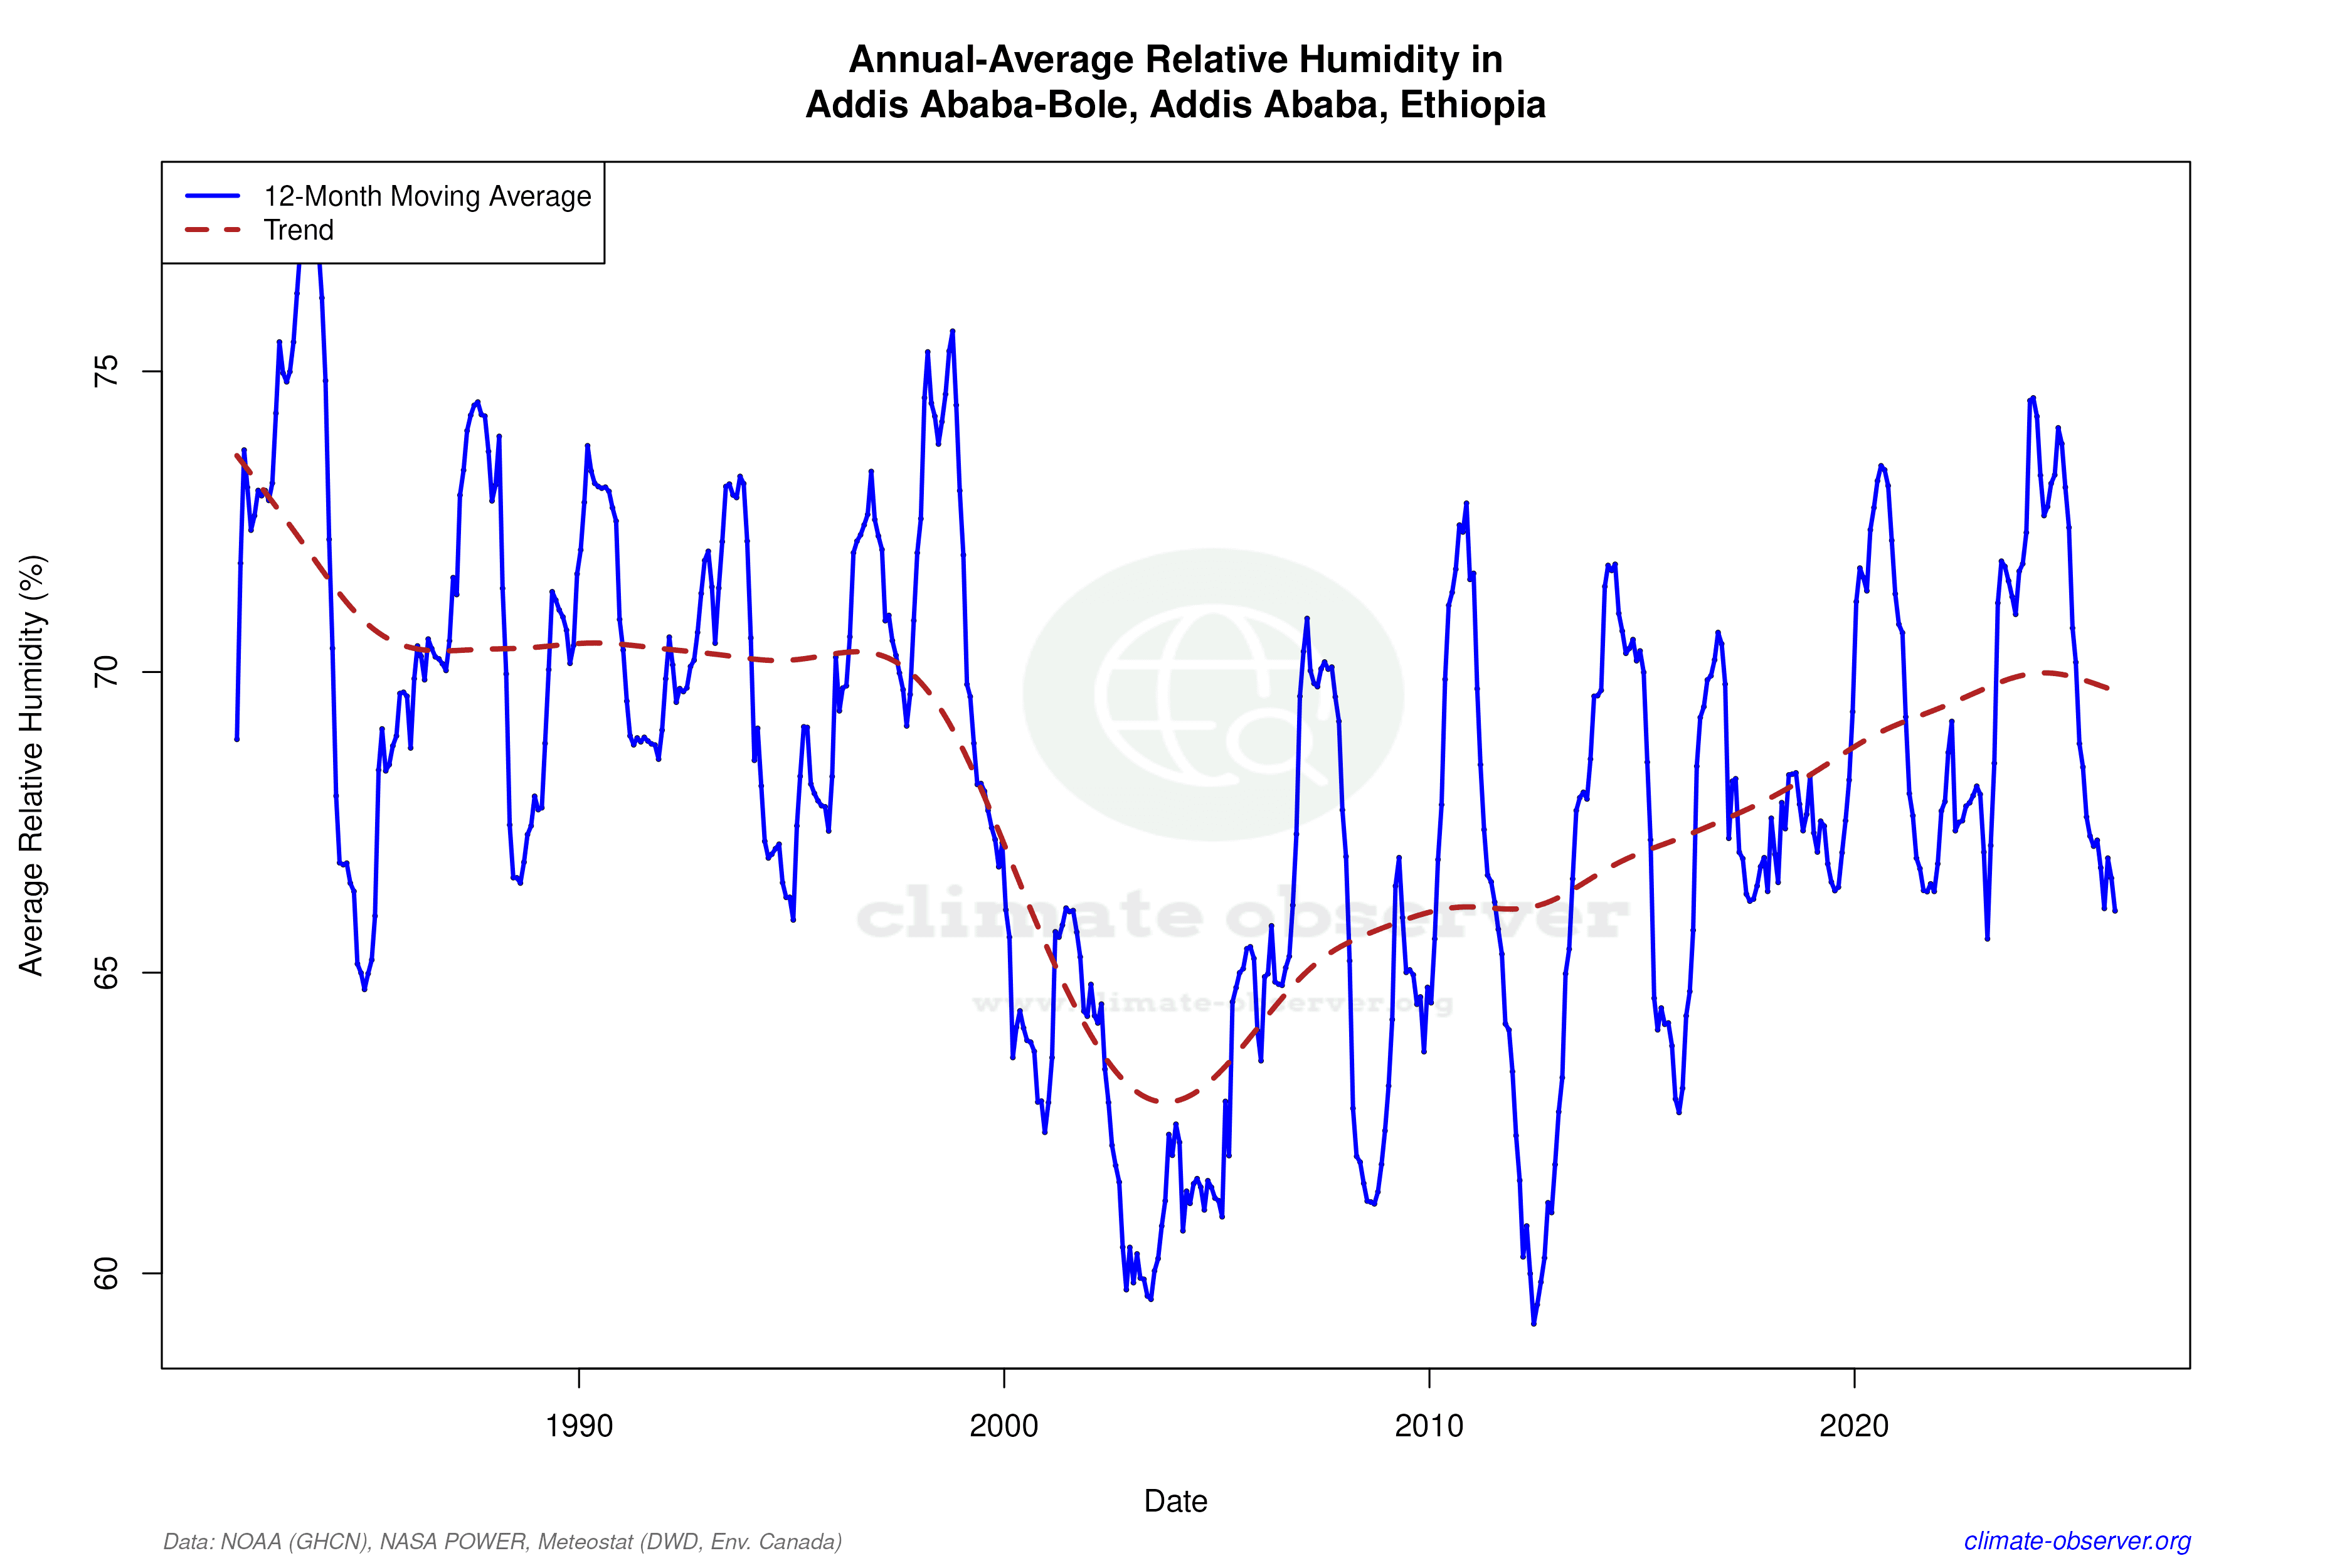
Climate 12-Month Moving Averages


Max Temperature 12-Month MA | 1 of 6
Daily Data Points and Averages Throughout the Year


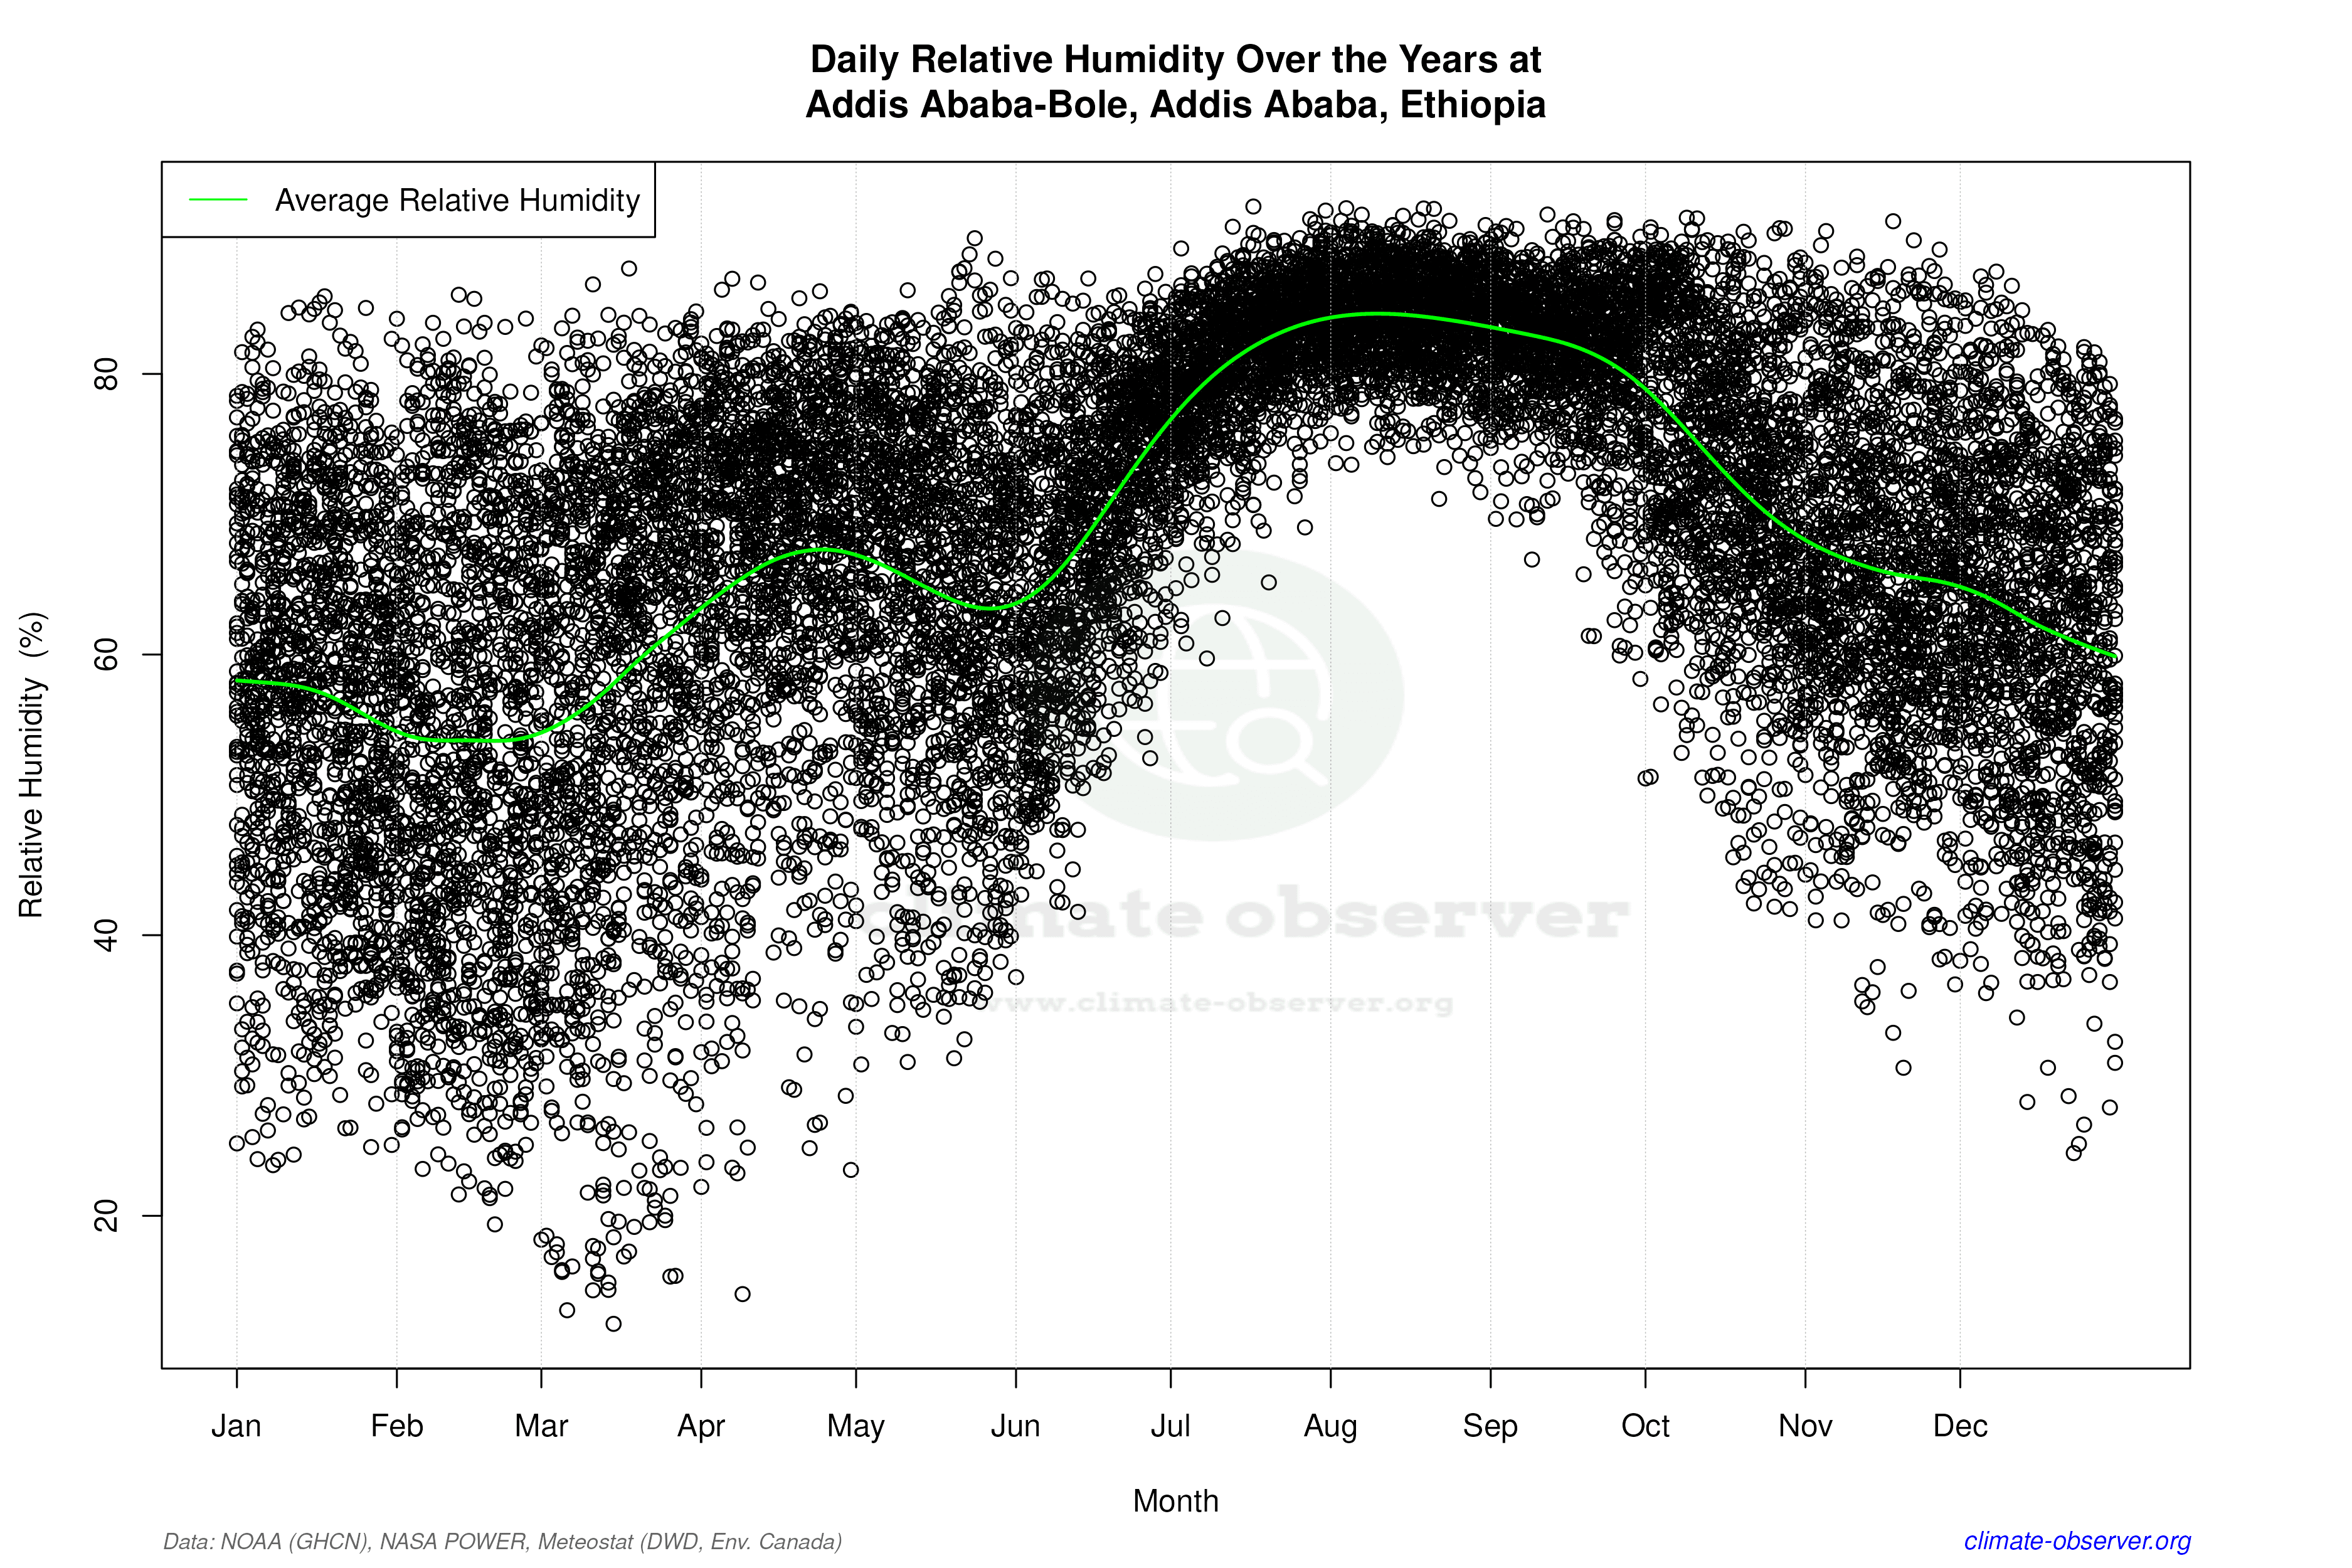

Average Max Temperature Throughout Year | 1 of 5
