Climate for Station: Jyvaskyla Lentoasema, Central Finland, Finland
Loading live weather...
Climate Analysis & Overview
Jyväskylän lentoasema is experiencing a warming trend with a notable increase in high temperatures over the past decade. The Precipitation Concentration Index indicates a more even distribution of rainfall, which may influence local climate resilience efforts.
Köppen Climate and Local Influences
Jyväskylän lentoasema, located at 62.4019°N, 25.6783°E, falls under the Dfc classification of the Köppen climate system, indicating a subarctic climate with cold, snowy winters and mild summers. The region's numerous lakes and forests play a significant role in moderating temperature fluctuations and influencing local weather patterns. The presence of these natural features contributes to the area's distinct seasonal variations, which are evident in the recorded temperature extremes: a maximum of 34.2°C (93.6°F) and a minimum of -38.5°C (-37.3°F).
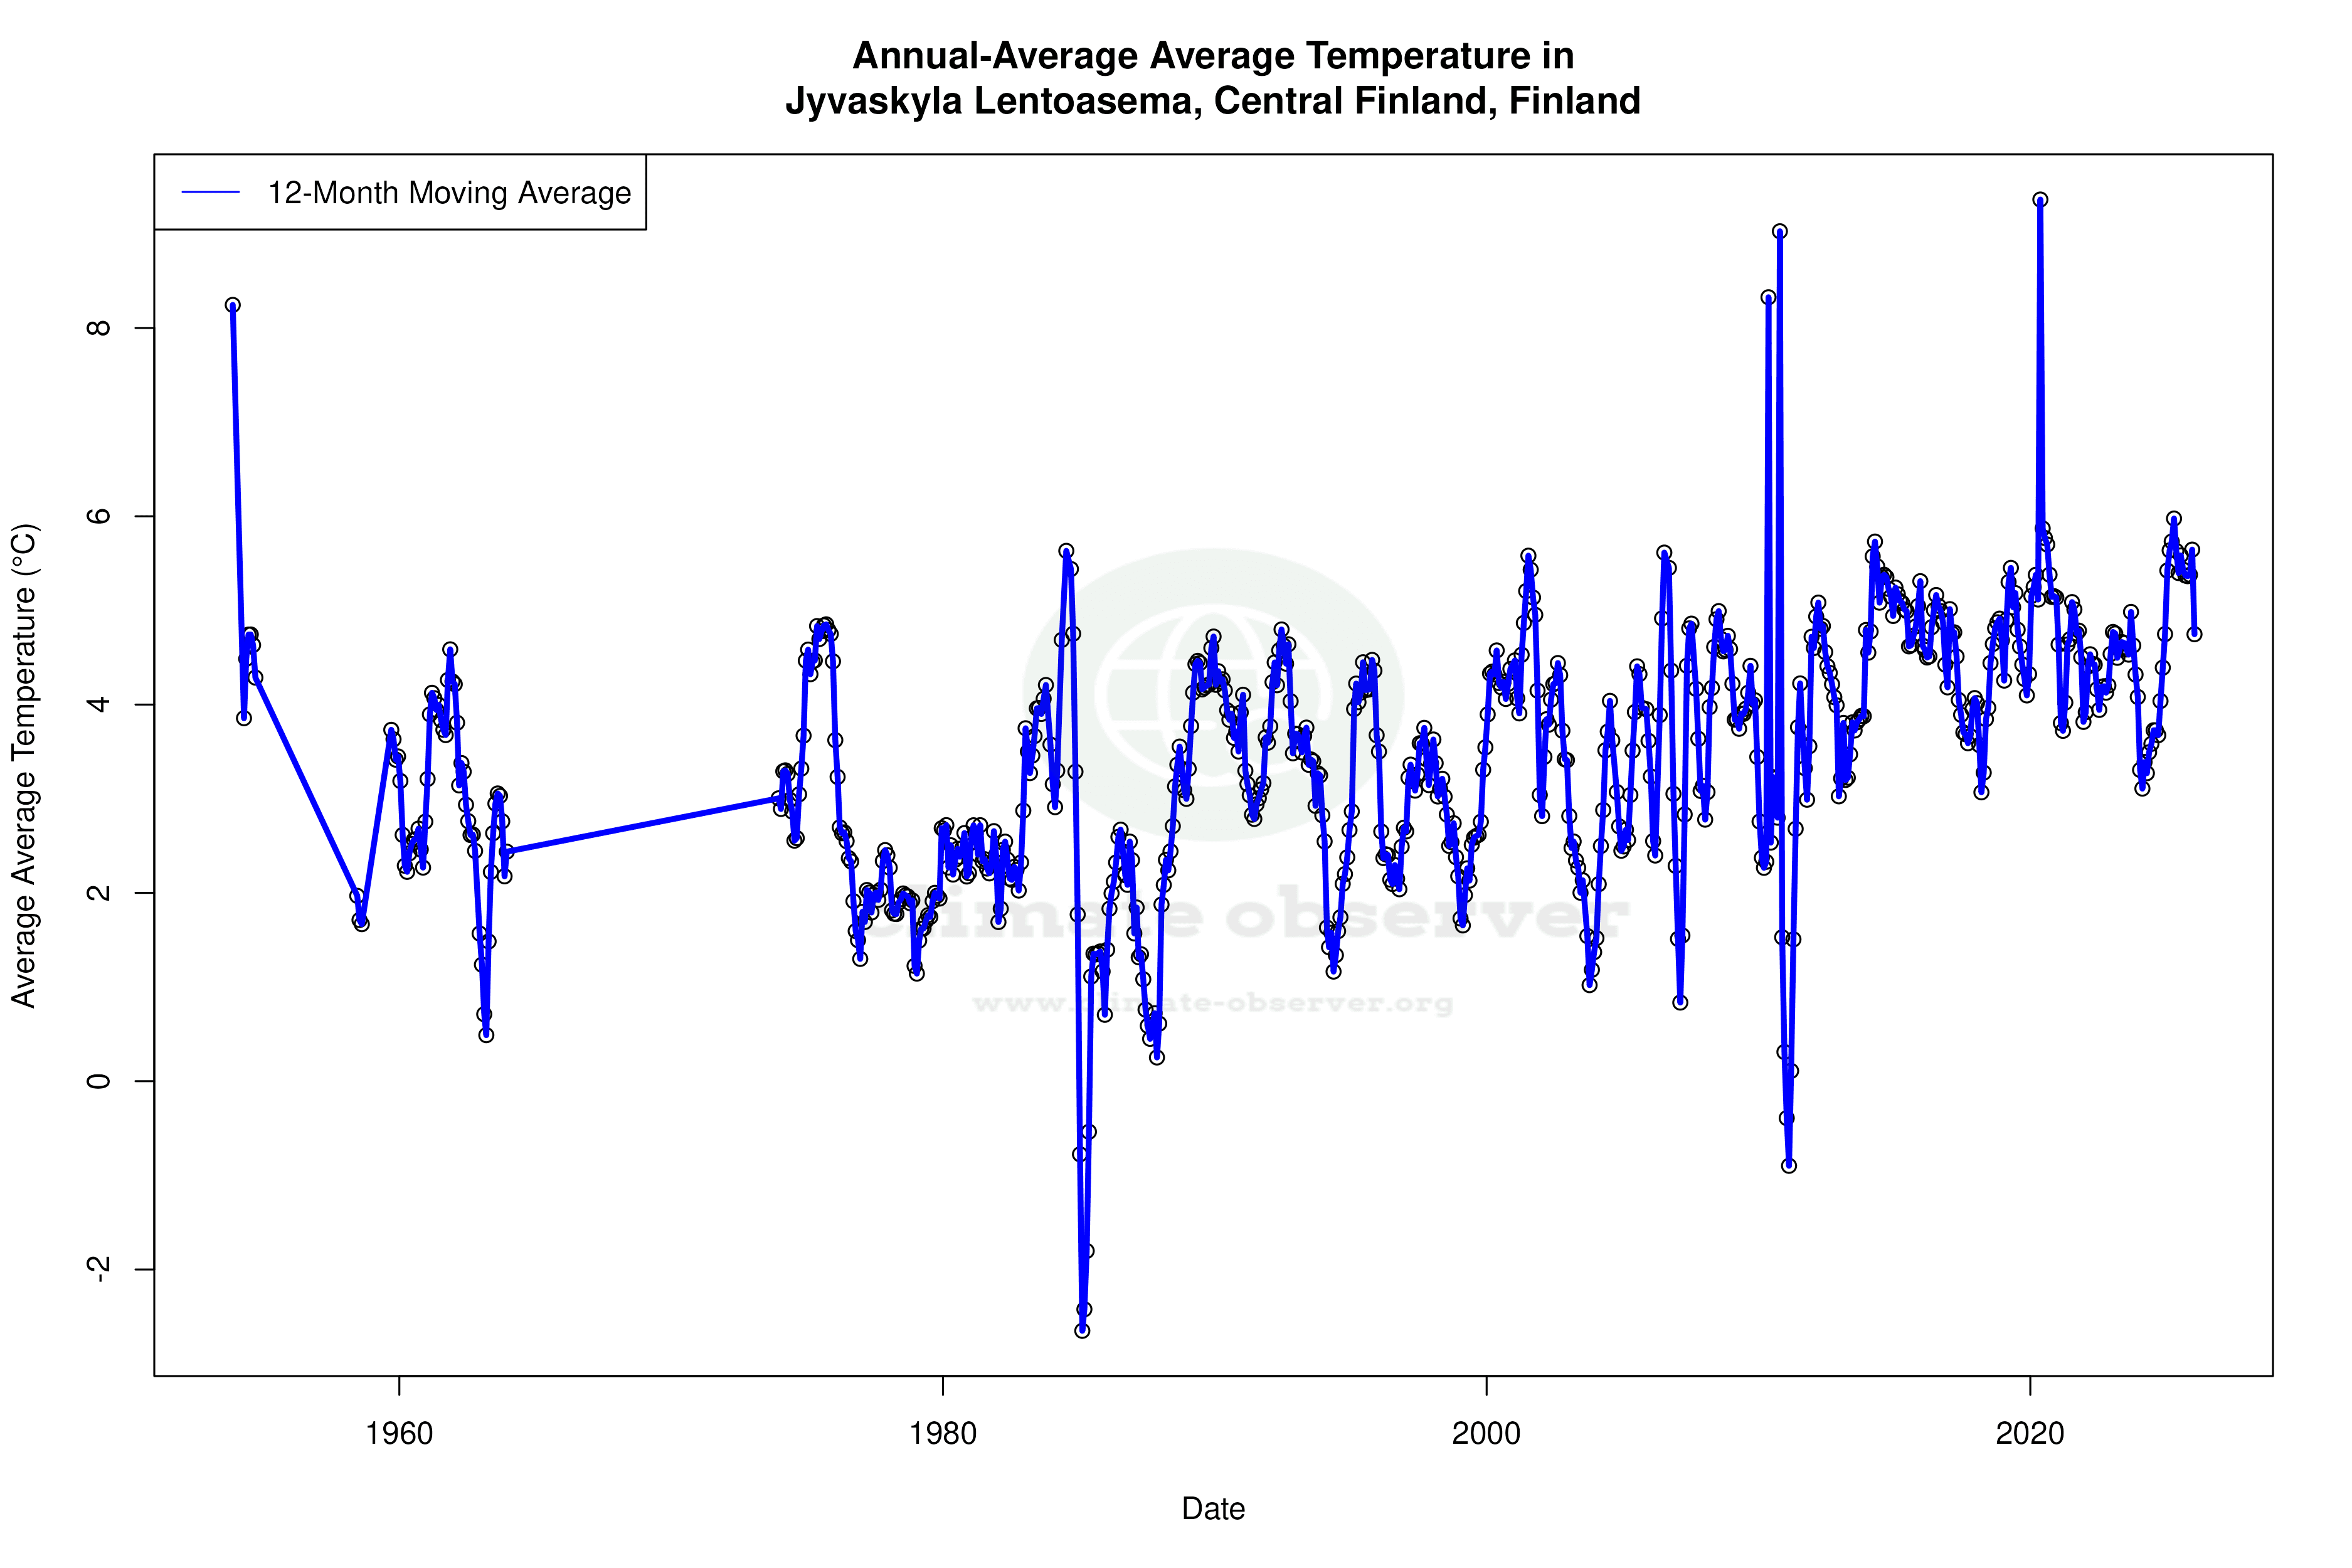
Temperature Trends: A Warming Landscape
Over the past decade, Jyväskylän lentoasema has witnessed a warming trend, with high temperatures increasing by 0.62°C (1.12°F). This trend is more pronounced than the all-time increase of 0.33°C (0.59°F) in high temperatures. In contrast, the low temperatures have seen a modest rise of 0.08°C (0.14°F) over the same period, compared to an all-time increase of 0.37°C (0.67°F). These statistics suggest that while both high and low temperatures are on the rise, the increase in highs is more significant in recent years. This warming trend aligns with Finland's regional climate goals, which include adapting to and mitigating the impacts of climate change.
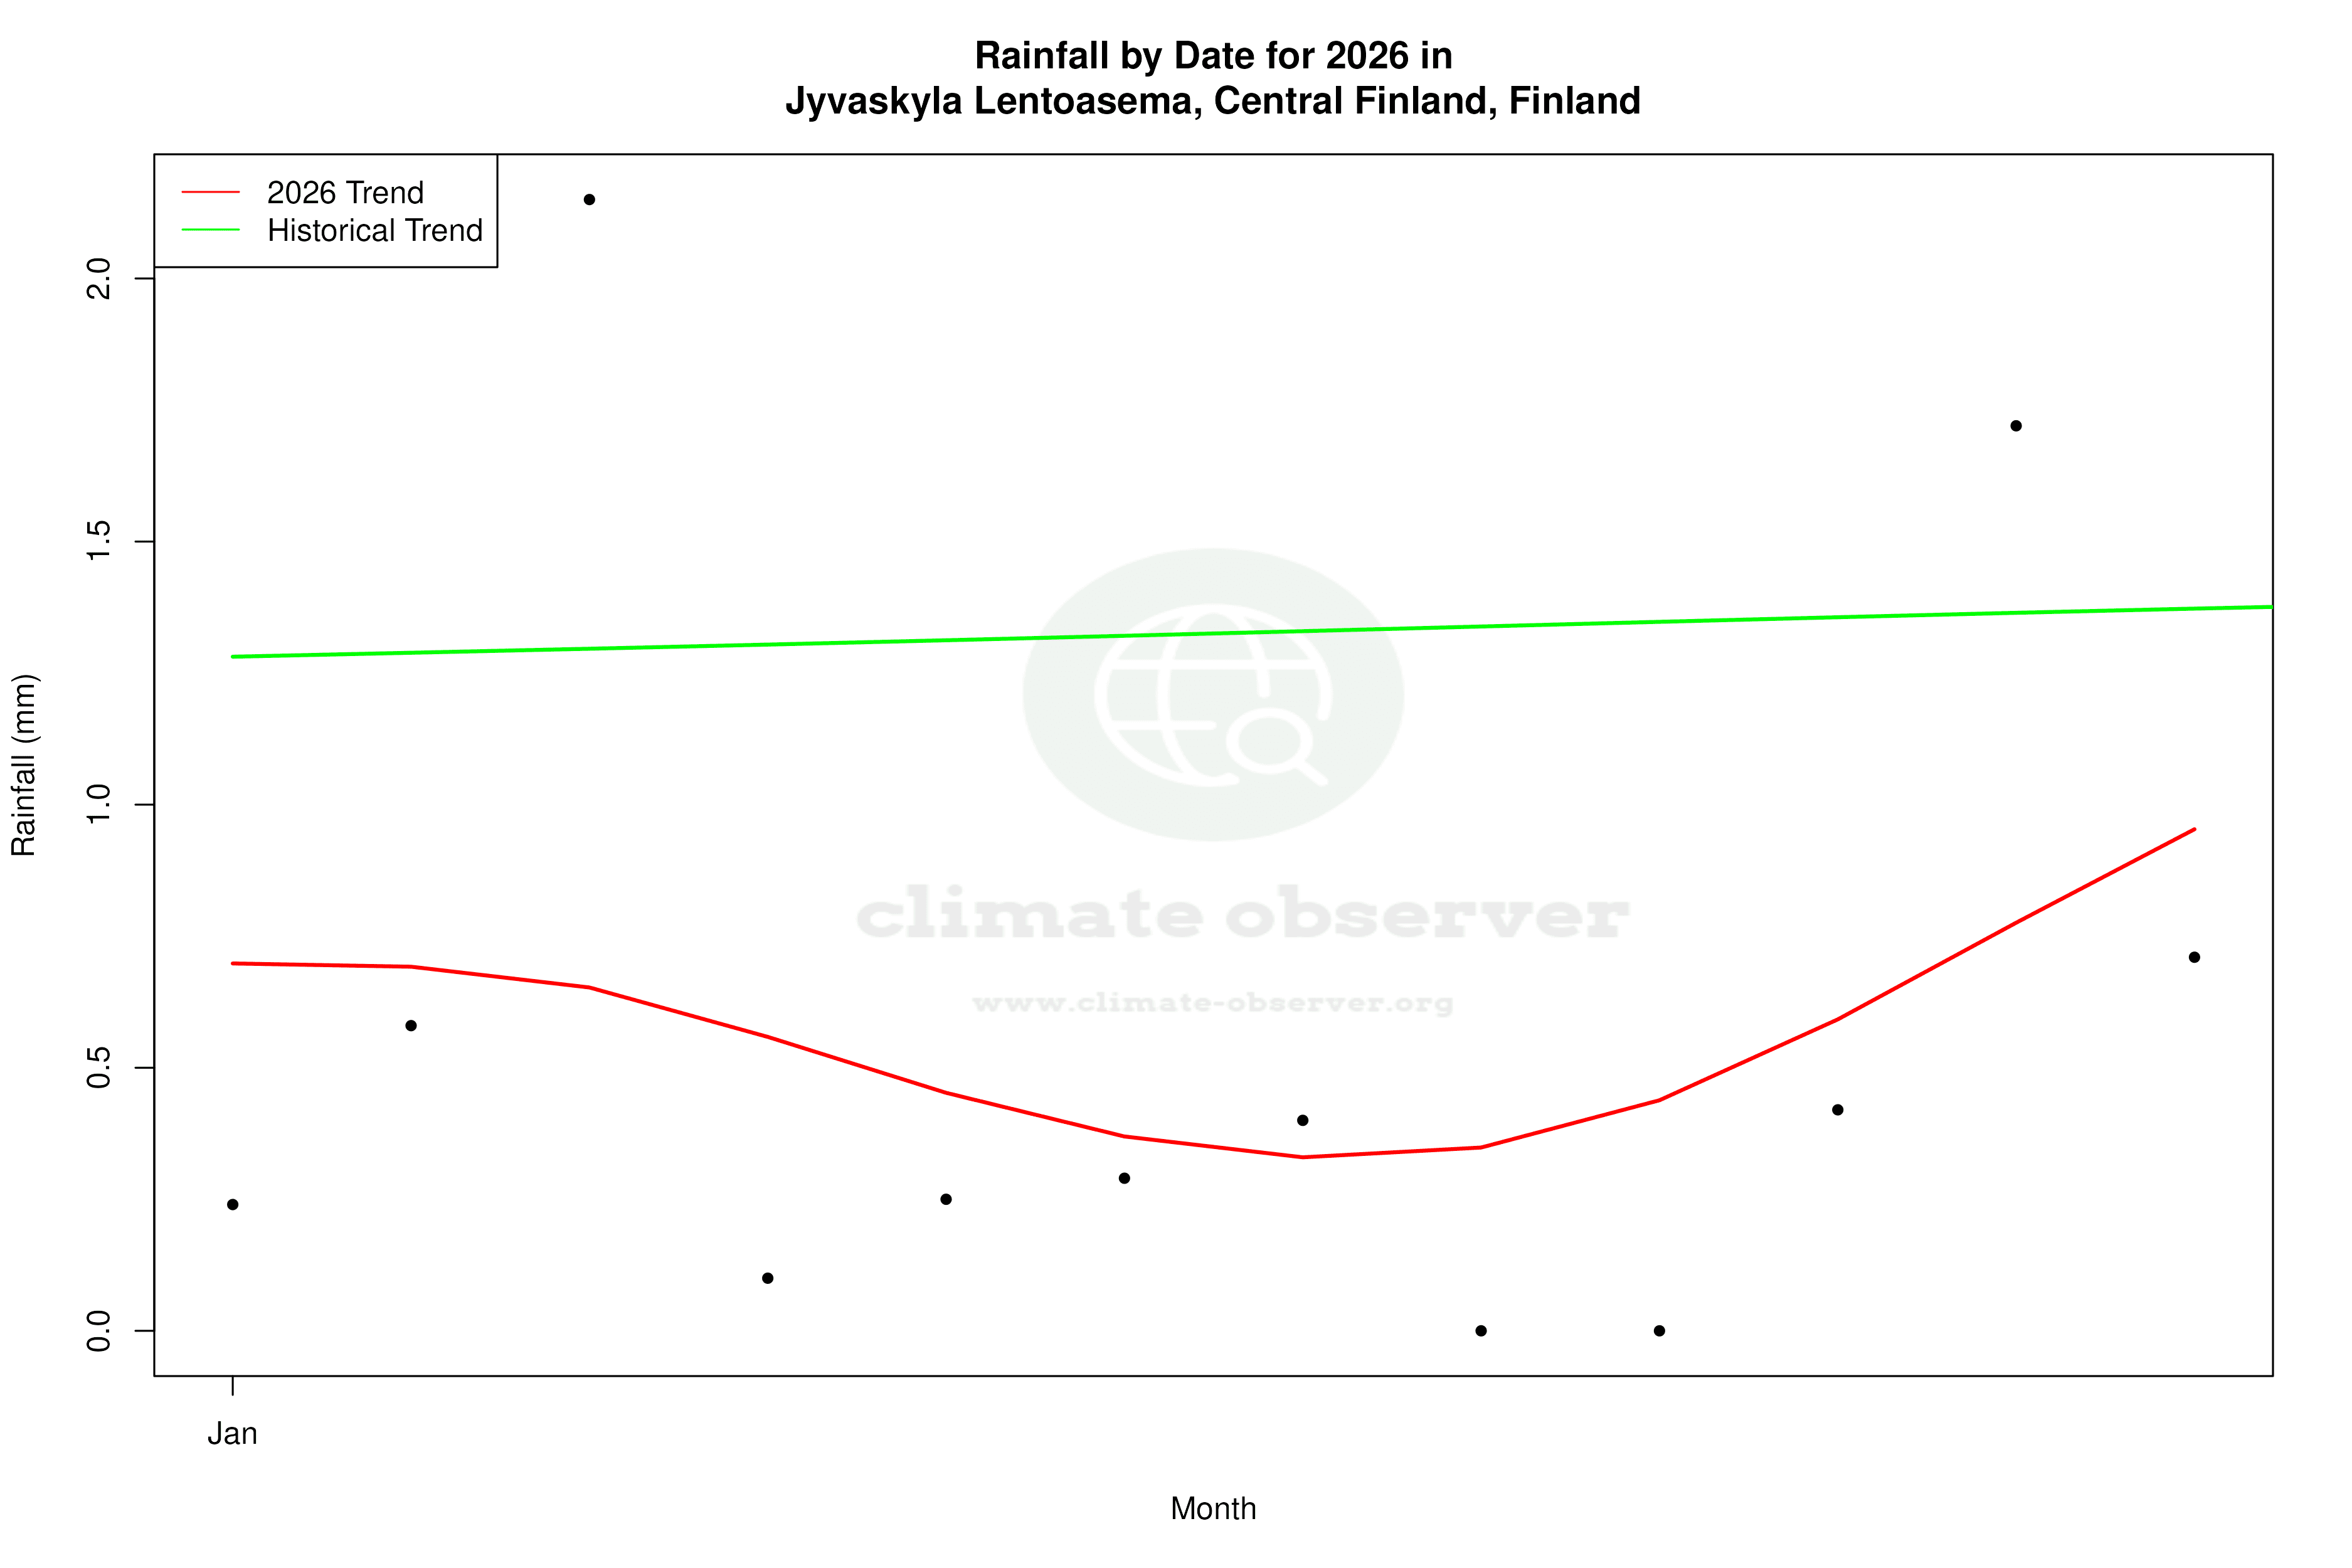
Precipitation Patterns: A More Even Distribution
The Precipitation Concentration Index (PCI) at Jyväskylän lentoasema has decreased from a baseline of 11.5 to a current value of 10.0. This marginal decrease indicates a more even distribution of precipitation throughout the year, reducing the likelihood of extreme rainfall events. Such a shift can enhance the region's resilience to climate variability by providing more consistent water availability for ecosystems and human use. The even distribution of precipitation may also mitigate some of the adverse impacts of the warming trend, such as increased evaporation rates.
Implications for Regional Climate Resilience
The observed climatic changes at Jyväskylän lentoasema have implications for regional climate resilience strategies. The warming trend, particularly in high temperatures, could affect local ecosystems, agriculture, and infrastructure. However, the more even distribution of precipitation may offer some relief by supporting water management efforts. As Finland continues to pursue its climate goals, understanding these localised trends will be crucial for developing effective adaptation and mitigation strategies.
Station Statistics
10-Year Trend
High: -1.36 °F/decade
Low: -1.82 °F/decade
Rain: -0.005 in/decade
25-Year Trend
High: +0.31 °F/decade
Low: +0.66 °F/decade
Rain: +0.000 in/decade
50-Year Trend
High: +0.90 °F/decade
Low: +0.92 °F/decade
Rain: +0.000 in/decade
All-Time Trend
High: +0.43 °F/decade
Low: +0.56 °F/decade
Rain: +0.000 in/decade
Percentage Above-Average Days
Last 12 Months: 54.2%
This Year: 65.5%
Precipitation Concentration Index (PCI) ℹ️
Last 12 Months: 10.4
Historical Average: 10.9
Percentile Rank of Last 12 Months ℹ️
High: 60th percentile
Low: 68th percentile
Rain: 28th percentile
Change in Variance ℹ️
High: -4.5%
Low: -16.3%
Intraday: +3.1%
Data Coverage
96.1%
First Year of Data
2000
Station Location
Historical Weather Records
| Max High | Avg High | Min High | Max Avg | Avg Avg | Min Avg | Max Low | Avg Low | Min Low | Max Precipitation | Avg Precipitation | Max Snow | Avg Snow | |
|---|---|---|---|---|---|---|---|---|---|---|---|---|---|
| Record | 93.56 °F | — | -28.30 °F | 80.42 °F | — | -32.98 °F | 71.42 °F | — | -37.30 °F | 2.22 in | — | — | — |
| January | 46.04 °F | 22.11 °F | -28.30 °F | 41.54 °F | 17.17 °F | -32.98 °F | 37.40 °F | 9.60 °F | -37.30 °F | 0.98 in | 0.05 in | — | — |
| February | 51.80 °F | 23.05 °F | -16.78 °F | 40.46 °F | 17.23 °F | -25.24 °F | 37.04 °F | 9.21 °F | -37.30 °F | 0.84 in | 0.04 in | — | — |
| March | 61.16 °F | 32.62 °F | 5.36 °F | 48.92 °F | 25.04 °F | -8.32 °F | 39.02 °F | 15.90 °F | -26.86 °F | 0.61 in | 0.04 in | — | — |
| April | 72.68 °F | 43.84 °F | 22.64 °F | 57.02 °F | 35.64 °F | 12.74 °F | 49.10 °F | 26.52 °F | -10.12 °F | 1.48 in | 0.04 in | — | — |
| May | 84.74 °F | 58.13 °F | 32.18 °F | 72.68 °F | 48.43 °F | 28.04 °F | 59.36 °F | 36.70 °F | 15.80 °F | 1.19 in | 0.05 in | — | — |
| June | 91.04 °F | 67.17 °F | 41.18 °F | 77.18 °F | 57.30 °F | 37.04 °F | 67.28 °F | 46.52 °F | 26.06 °F | 1.63 in | 0.08 in | — | — |
| July | 93.56 °F | 70.75 °F | 46.40 °F | 80.42 °F | 61.63 °F | 44.24 °F | 71.42 °F | 51.22 °F | 33.62 °F | 1.84 in | 0.10 in | — | — |
| August | 90.14 °F | 66.55 °F | 47.30 °F | 75.92 °F | 57.58 °F | 41.36 °F | 65.48 °F | 48.54 °F | 28.04 °F | 2.22 in | 0.10 in | — | — |
| September | 79.70 °F | 55.55 °F | 34.88 °F | 66.20 °F | 48.09 °F | 30.92 °F | 60.26 °F | 40.58 °F | 15.44 °F | 2.05 in | 0.08 in | — | — |
| October | 68.18 °F | 43.39 °F | 17.78 °F | 57.92 °F | 38.41 °F | 7.88 °F | 53.60 °F | 32.98 °F | -2.74 °F | 1.38 in | 0.08 in | — | — |
| November | 55.76 °F | 33.10 °F | -2.02 °F | 51.44 °F | 29.52 °F | -13.36 °F | 47.84 °F | 24.47 °F | -17.32 °F | 1.08 in | 0.07 in | — | — |
| December | 48.92 °F | 26.28 °F | -19.12 °F | 44.42 °F | 21.38 °F | -25.06 °F | 41.36 °F | 15.50 °F | -30.64 °F | 1.04 in | 0.06 in | — | — |
Data Visualisations
Remove WatermarksCurrent Year Climate Trends vs Historical


Max Temperature this Year | 1 of 6
Climate 12-Month Moving Averages


Max Temperature 12-Month MA | 1 of 6
Daily Data Points and Averages Throughout the Year


Average Max Temperature Throughout Year | 1 of 5
