Climate for Station: Kapingamarangi, Pohnpei, Federated States of Micronesia
Loading live weather...
Climate Analysis & Overview
Kapingamarangi, a remote atoll in Pohnpei, Micronesia, experiences a warming trend with a notable increase in high temperatures over the past decade. Precipitation has become more evenly distributed, indicating a shift in local weather patterns that align with regional climate goals to manage water resources effectively.
Tropical Warmth and Oceanic Influence
Kapingamarangi falls under the tropical rainforest climate classification, characterised by consistently high temperatures and significant rainfall due to its proximity to the equator. The atoll's geographical position in the Pacific Ocean heavily influences its climate, with the surrounding waters moderating temperature extremes. Over the past decade, the high temperatures have risen by 0.63°C (1.13°F), while the lows show a negligible increase of 0.01°C (0.02°F). This warming trend is consistent with broader regional patterns observed across the Federated States of Micronesia.
Long-term Climate Dynamics
Examining the all-time data reveals a more pronounced warming trend in high temperatures, with an increase of 0.73°C (1.31°F). Conversely, the low temperatures have experienced a cooling of 0.57°C (1.03°F). This divergence suggests a widening range between daily highs and lows, which may impact local ecosystems and human activities. The record high temperature for the station stands at 37.2°C (98.96°F), while the record low is 12.8°C (55.04°F), highlighting the potential for extreme weather events.
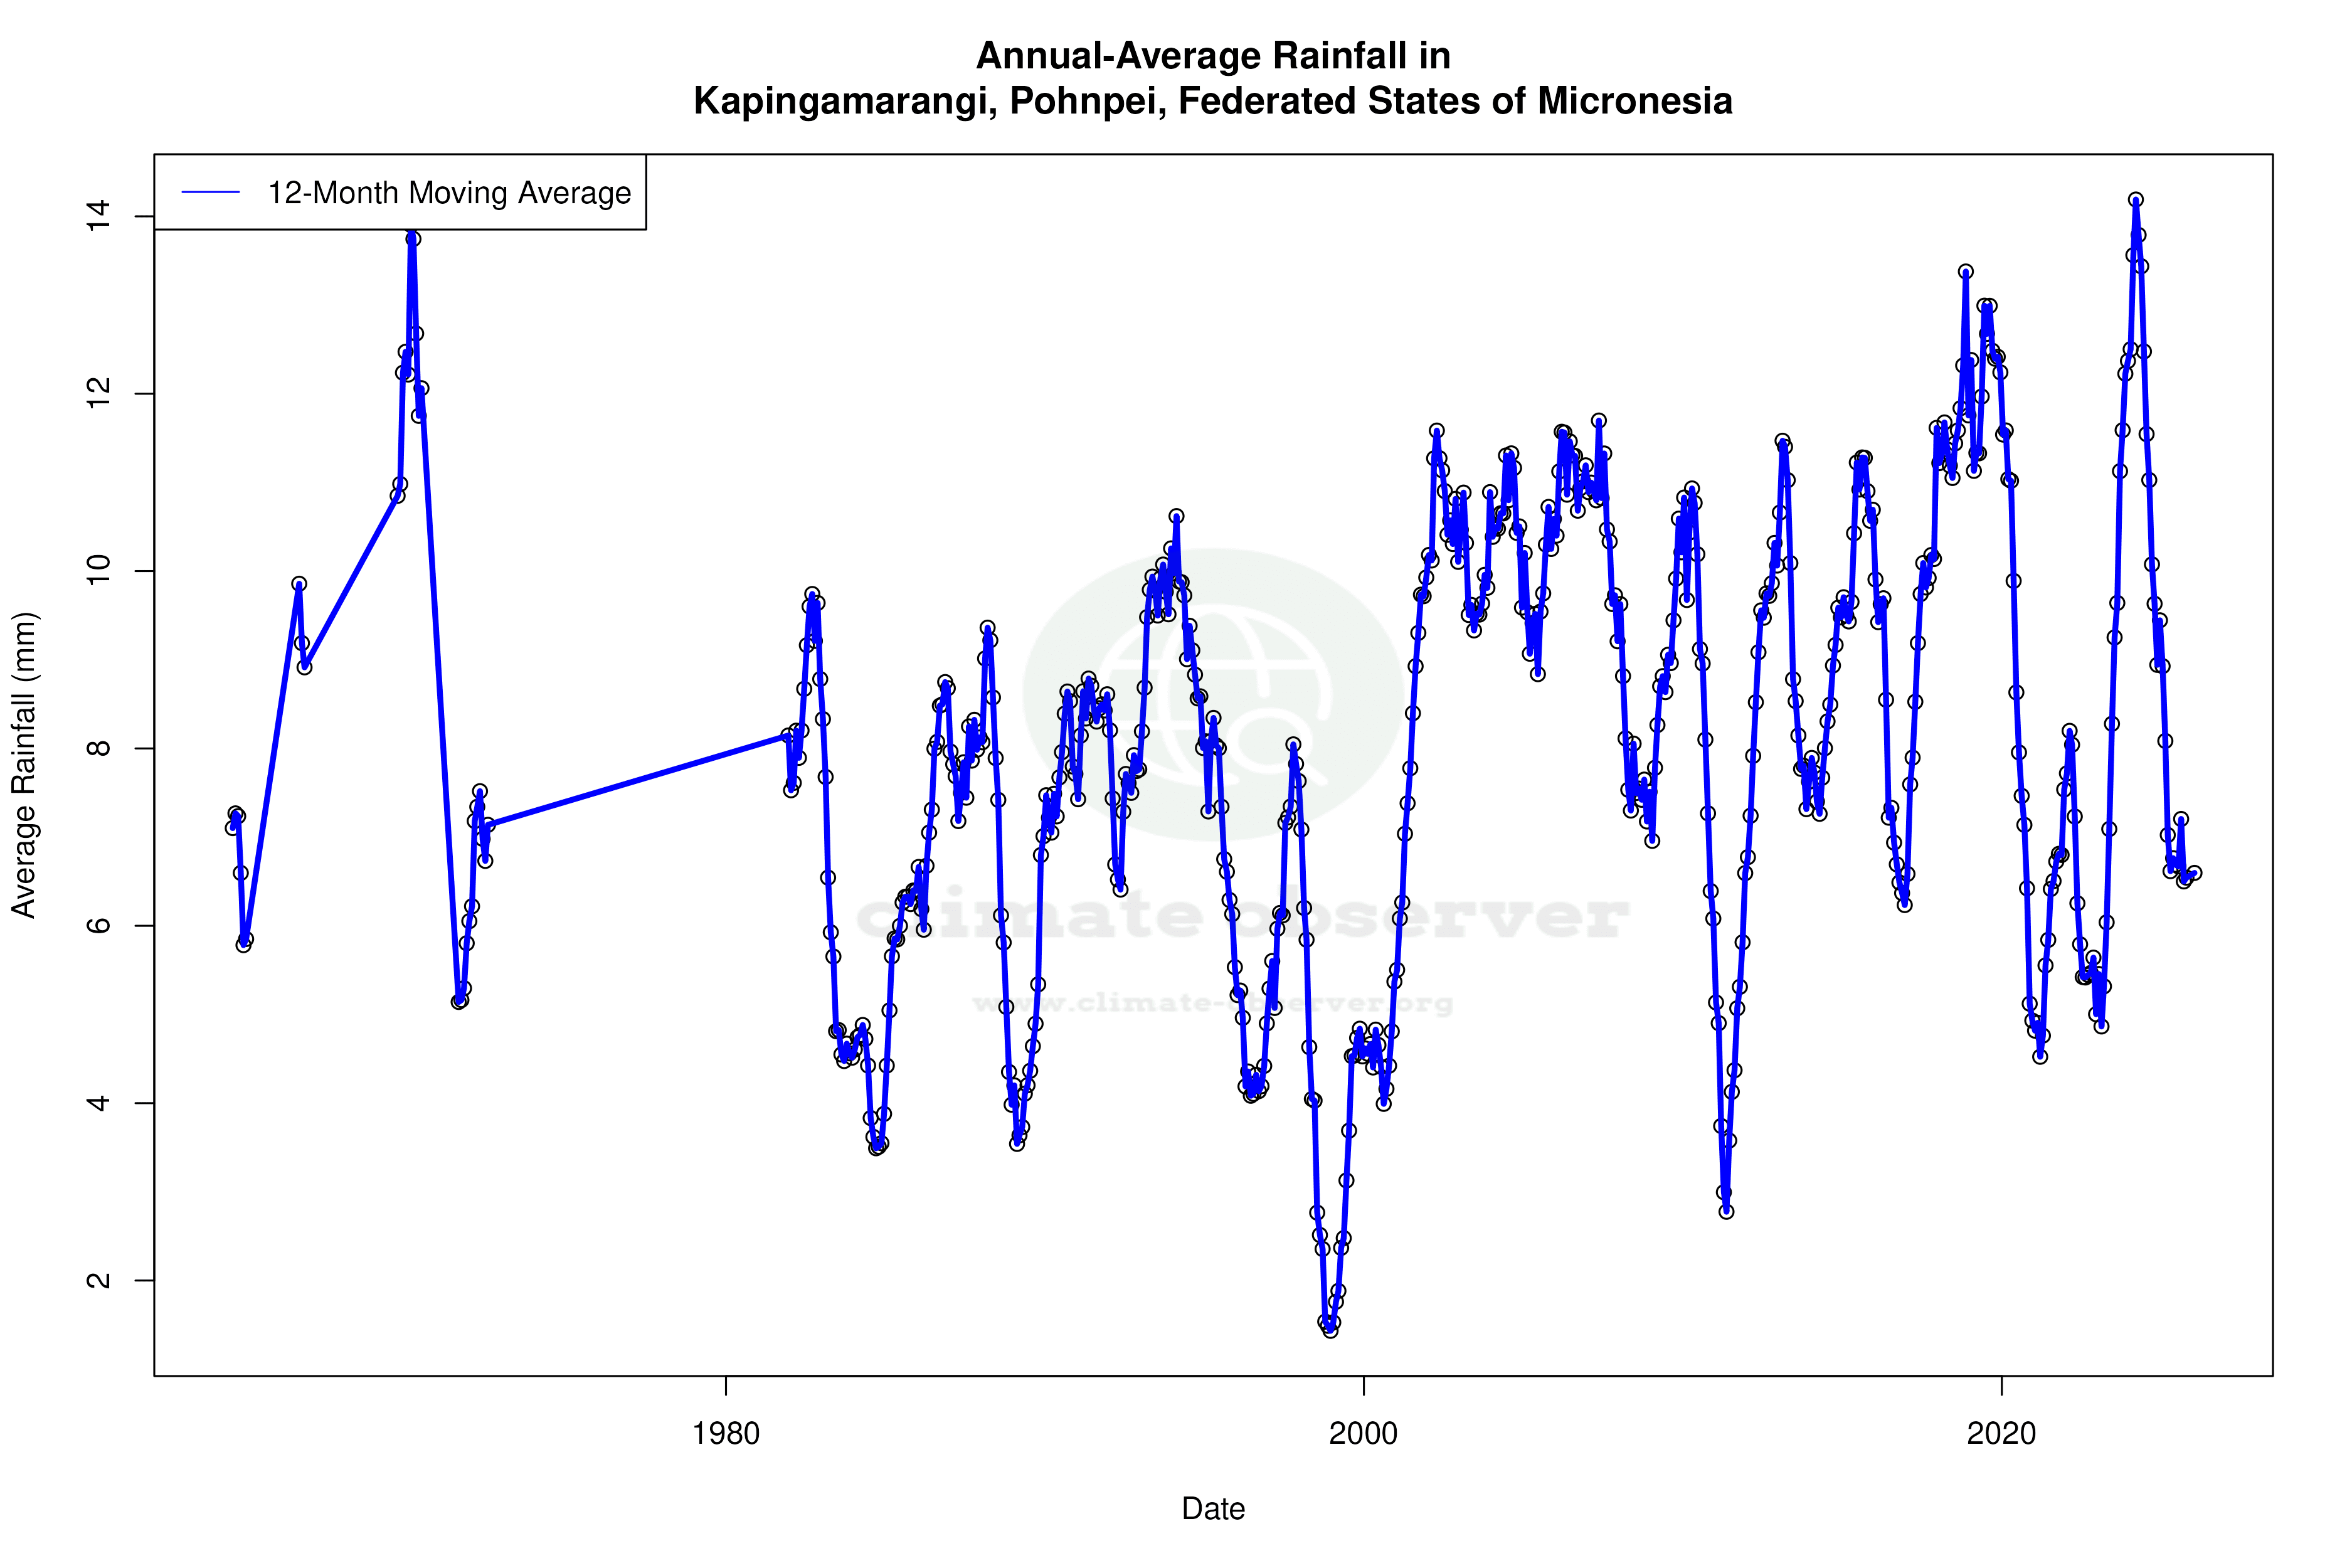
Precipitation Patterns and Distribution
The Precipitation Concentration Index (PCI) offers insights into rainfall distribution. A lower PCI indicates more evenly distributed precipitation throughout the year. Kapingamarangi's PCI has decreased from a baseline of 11.63 to a current value of 9.31, suggesting a more uniform distribution of rainfall events. This shift aligns with regional climate adaptation strategies, aiming to enhance water resource management and mitigate the impacts of concentrated rainfall events.
Regional Climate Goals and Adaptation
The Federated States of Micronesia have set ambitious climate goals, focusing on resilience and sustainable resource management. The observed trends in Kapingamarangi's climate data reflect these objectives, with more evenly distributed precipitation supporting agricultural practices and reducing the risk of flooding. As the region continues to adapt to changing climatic conditions, understanding these localised trends becomes increasingly crucial for informed policy-making and community planning.
Station Statistics
10-Year Trend
High: +0.55 °F/decade
Low: +1.11 °F/decade
Rain: -0.081 in/decade
25-Year Trend
High: +3.86 °F/decade
Low: -4.20 °F/decade
Rain: -0.028 in/decade
50-Year Trend
High: +1.91 °F/decade
Low: -1.54 °F/decade
Rain: +0.026 in/decade
All-Time Trend
High: +1.27 °F/decade
Low: -0.98 °F/decade
Rain: +0.016 in/decade
Percentage Above-Average Days
Last 12 Months: 89.9%
This Year: 84.5%
Precipitation Concentration Index (PCI) ℹ️
Last 12 Months: 9.4
Historical Average: 10.9
Percentile Rank of Last 12 Months ℹ️
High: 84th percentile
Low: 27th percentile
Rain: 32nd percentile
Change in Variance ℹ️
High: -21.5%
Low: +55.2%
Intraday: -41.4%
Data Coverage
80.1%
First Year of Data
1962
Station Location
Historical Weather Records
| Max High | Avg High | Min High | Max Avg | Avg Avg | Min Avg | Max Low | Avg Low | Min Low | Max Precipitation | Avg Precipitation | Max Snow | Avg Snow | |
|---|---|---|---|---|---|---|---|---|---|---|---|---|---|
| Record | 98.96 °F | — | 78.08 °F | 86.58 °F | — | 78.08 °F | 86.38 °F | — | 55.04 °F | 7.00 in | — | 0.00 in | — |
| January | 96.98 °F | 85.49 °F | 78.08 °F | 85.84 °F | 82.69 °F | 78.82 °F | 85.53 °F | 79.11 °F | 64.94 °F | 6.12 in | 0.32 in | 0.00 in | 0.00 in |
| February | 95.00 °F | 85.51 °F | 78.98 °F | 85.68 °F | 82.66 °F | 79.34 °F | 85.12 °F | 79.18 °F | 64.04 °F | 6.68 in | 0.35 in | 0.00 in | 0.00 in |
| March | 95.00 °F | 85.28 °F | 80.11 °F | 85.73 °F | 82.62 °F | 78.93 °F | 85.19 °F | 79.26 °F | 60.08 °F | 5.14 in | 0.37 in | 0.00 in | 0.00 in |
| April | 98.06 °F | 85.01 °F | 78.98 °F | 85.82 °F | 82.49 °F | 79.36 °F | 85.14 °F | 79.29 °F | 55.04 °F | 7.00 in | 0.39 in | 0.00 in | 0.00 in |
| May | 98.96 °F | 85.15 °F | 79.56 °F | 86.04 °F | 82.67 °F | 79.12 °F | 85.48 °F | 79.70 °F | 60.98 °F | 5.12 in | 0.32 in | 0.00 in | 0.00 in |
| June | 96.98 °F | 85.11 °F | 79.92 °F | 85.84 °F | 82.47 °F | 78.62 °F | 85.42 °F | 79.42 °F | 60.08 °F | 6.67 in | 0.36 in | 0.00 in | 0.00 in |
| July | 95.00 °F | 84.72 °F | 78.98 °F | 85.68 °F | 82.11 °F | 78.48 °F | 84.83 °F | 78.99 °F | 60.08 °F | 5.75 in | 0.34 in | 0.00 in | 0.00 in |
| August | 95.00 °F | 84.83 °F | 79.52 °F | 86.36 °F | 82.18 °F | 79.03 °F | 84.92 °F | 79.20 °F | 60.08 °F | 3.90 in | 0.26 in | 0.00 in | 0.00 in |
| September | 93.92 °F | 84.96 °F | 79.66 °F | 86.22 °F | 82.42 °F | 78.08 °F | 85.35 °F | 79.45 °F | 64.04 °F | 6.12 in | 0.24 in | 0.00 in | 0.00 in |
| October | 95.00 °F | 85.38 °F | 79.45 °F | 86.18 °F | 82.65 °F | 79.02 °F | 84.81 °F | 79.55 °F | 62.06 °F | 4.31 in | 0.21 in | 0.00 in | 0.00 in |
| November | 95.00 °F | 85.42 °F | 78.98 °F | 86.58 °F | 82.78 °F | 79.07 °F | 86.38 °F | 79.42 °F | 60.08 °F | 5.64 in | 0.29 in | 0.00 in | 0.00 in |
| December | 96.08 °F | 85.35 °F | 80.26 °F | 86.07 °F | 82.79 °F | 79.45 °F | 85.60 °F | 79.68 °F | 60.98 °F | 6.52 in | 0.32 in | 0.00 in | 0.00 in |
Data Visualisations
Remove WatermarksCurrent Year Climate Trends vs Historical


Max Temperature this Year | 1 of 6
Climate 12-Month Moving Averages


Max Temperature 12-Month MA | 1 of 6
Daily Data Points and Averages Throughout the Year


Average Max Temperature Throughout Year | 1 of 5