Climate for Station: Lyon - St Exupery, Auvergne-Rhone-Alpes, France
Loading live weather...
Climate Analysis & Overview
Lyon - St Exupery is experiencing a warming trend with significant changes in temperature patterns over the past decade. The region's precipitation is becoming more evenly distributed, reflecting broader climatic shifts in the Auvergne-Rhône-Alpes area. These changes are crucial for understanding local climate dynamics and aligning with France's regional climate goals.
Lyon's Climatic Backdrop
Lyon, located in the Auvergne-Rhône-Alpes region of France, is characterised by a temperate oceanic climate (Cfb) according to the Köppen classification. The city's geographical position, nestled between the Rhône and Saône rivers and in proximity to the Alps, influences its climatic conditions. This setting contributes to moderate seasonal temperature variations and a relatively balanced distribution of precipitation throughout the year.
Temperature Trends and Shifts
Over the past decade, Lyon - St Exupery has experienced a noticeable warming trend. The average high temperatures have increased by 0.86°C (1.55°F), while the lows have risen by 1.17°C (2.11°F). These changes are more pronounced than the all-time trends, which show a rise of 0.16°C (0.29°F) for highs and 0.29°C (0.52°F) for lows. This suggests that recent years have seen accelerated warming, a critical factor as France aims to mitigate climate change impacts.
Precipitation Patterns and PCI Insights
The Precipitation Concentration Index (PCI) for Lyon has decreased from a baseline of 11.4 to a current value of 9.1. This indicates a more even distribution of rainfall events, as a lower PCI suggests less concentration of precipitation in fewer events. Such a shift could lead to more consistent water availability, beneficial for agriculture and water management in the region.
Record Extremes and Implications
Lyon's climate extremes are marked by a record high of 39.9°C (103.8°F) and a record low of -23.0°C (-9.4°F). These extremes highlight the potential for significant temperature fluctuations, which can impact local ecosystems and infrastructure. Understanding these records is vital for planning and resilience strategies, especially in the face of potential future climate variability.
Contextualising Regional Climate Goals
In line with France's regional climate objectives, which focus on reducing greenhouse gas emissions and enhancing sustainability, the observed climatic trends in Lyon provide essential insights. The warming patterns and evolving precipitation dynamics underscore the importance of adaptive measures and policy implementations to address climate change challenges effectively.
Station Statistics
10-Year Trend
High: +2.29 °F/decade
Low: +2.71 °F/decade
Rain: +0.035 in/decade
25-Year Trend
High: +1.32 °F/decade
Low: +1.14 °F/decade
Rain: +0.004 in/decade
50-Year Trend
High: +0.97 °F/decade
Low: +1.12 °F/decade
Rain: -0.005 in/decade
All-Time Trend
High: +0.30 °F/decade
Low: +0.53 °F/decade
Rain: +0.000 in/decade
Percentage Above-Average Days
Last 12 Months: 53.6%
This Year: 69.1%
Precipitation Concentration Index (PCI) ℹ️
Last 12 Months: 9.6
Historical Average: 11.6
Percentile Rank of Last 12 Months ℹ️
High: 84th percentile
Low: 93rd percentile
Rain: 80th percentile
Change in Variance ℹ️
High: +2.4%
Low: +0.7%
Intraday: -18.4%
Data Coverage
87.5%
First Year of Data
1920
Station Location
Historical Weather Records
| Max High | Avg High | Min High | Max Avg | Avg Avg | Min Avg | Max Low | Avg Low | Min Low | Max Precipitation | Avg Precipitation | Max Snow | Avg Snow | |
|---|---|---|---|---|---|---|---|---|---|---|---|---|---|
| Record | 103.82 °F | — | 7.88 °F | 93.56 °F | — | 8.24 °F | 78.80 °F | — | -9.40 °F | 3.82 in | — | — | — |
| January | 68.72 °F | 42.76 °F | 10.04 °F | 59.90 °F | 38.69 °F | 8.24 °F | 56.12 °F | 31.88 °F | -9.40 °F | 1.80 in | 0.07 in | — | — |
| February | 72.32 °F | 46.64 °F | 7.88 °F | 60.08 °F | 41.34 °F | 15.26 °F | 56.48 °F | 33.31 °F | -8.50 °F | 1.84 in | 0.07 in | — | — |
| March | 78.98 °F | 54.69 °F | 26.24 °F | 66.56 °F | 47.76 °F | 24.62 °F | 57.56 °F | 37.96 °F | 13.10 °F | 2.07 in | 0.07 in | — | — |
| April | 86.18 °F | 60.92 °F | 36.32 °F | 69.80 °F | 53.30 °F | 33.62 °F | 62.42 °F | 42.81 °F | 24.08 °F | 2.20 in | 0.08 in | — | — |
| May | 93.56 °F | 68.42 °F | 42.80 °F | 80.06 °F | 60.98 °F | 37.04 °F | 69.80 °F | 49.68 °F | 25.16 °F | 2.92 in | 0.11 in | — | — |
| June | 100.58 °F | 75.59 °F | 48.20 °F | 87.44 °F | 68.26 °F | 44.42 °F | 78.80 °F | 55.98 °F | 36.14 °F | 2.80 in | 0.11 in | — | — |
| July | 103.10 °F | 80.39 °F | 56.12 °F | 93.56 °F | 72.76 °F | 55.22 °F | 77.54 °F | 59.59 °F | 42.98 °F | 2.91 in | 0.08 in | — | — |
| August | 103.82 °F | 79.40 °F | 57.56 °F | 89.96 °F | 71.79 °F | 55.58 °F | 76.46 °F | 58.90 °F | 40.28 °F | 2.78 in | 0.10 in | — | — |
| September | 96.44 °F | 72.48 °F | 49.28 °F | 80.24 °F | 64.28 °F | 46.22 °F | 72.14 °F | 53.67 °F | 32.36 °F | 3.51 in | 0.12 in | — | — |
| October | 86.54 °F | 62.48 °F | 35.96 °F | 75.74 °F | 56.02 °F | 36.68 °F | 67.82 °F | 47.05 °F | 23.90 °F | 3.82 in | 0.11 in | — | — |
| November | 73.40 °F | 50.75 °F | 28.40 °F | 66.38 °F | 45.76 °F | 26.06 °F | 61.70 °F | 38.93 °F | 15.08 °F | 3.54 in | 0.11 in | — | — |
| December | 68.18 °F | 43.57 °F | 13.28 °F | 62.42 °F | 40.30 °F | 18.32 °F | 55.76 °F | 33.53 °F | -6.16 °F | 3.19 in | 0.08 in | — | — |
Data Visualisations
Remove WatermarksCurrent Year Climate Trends vs Historical


Max Temperature this Year | 1 of 6
Climate 12-Month Moving Averages


Max Temperature 12-Month MA | 1 of 6
Daily Data Points and Averages Throughout the Year


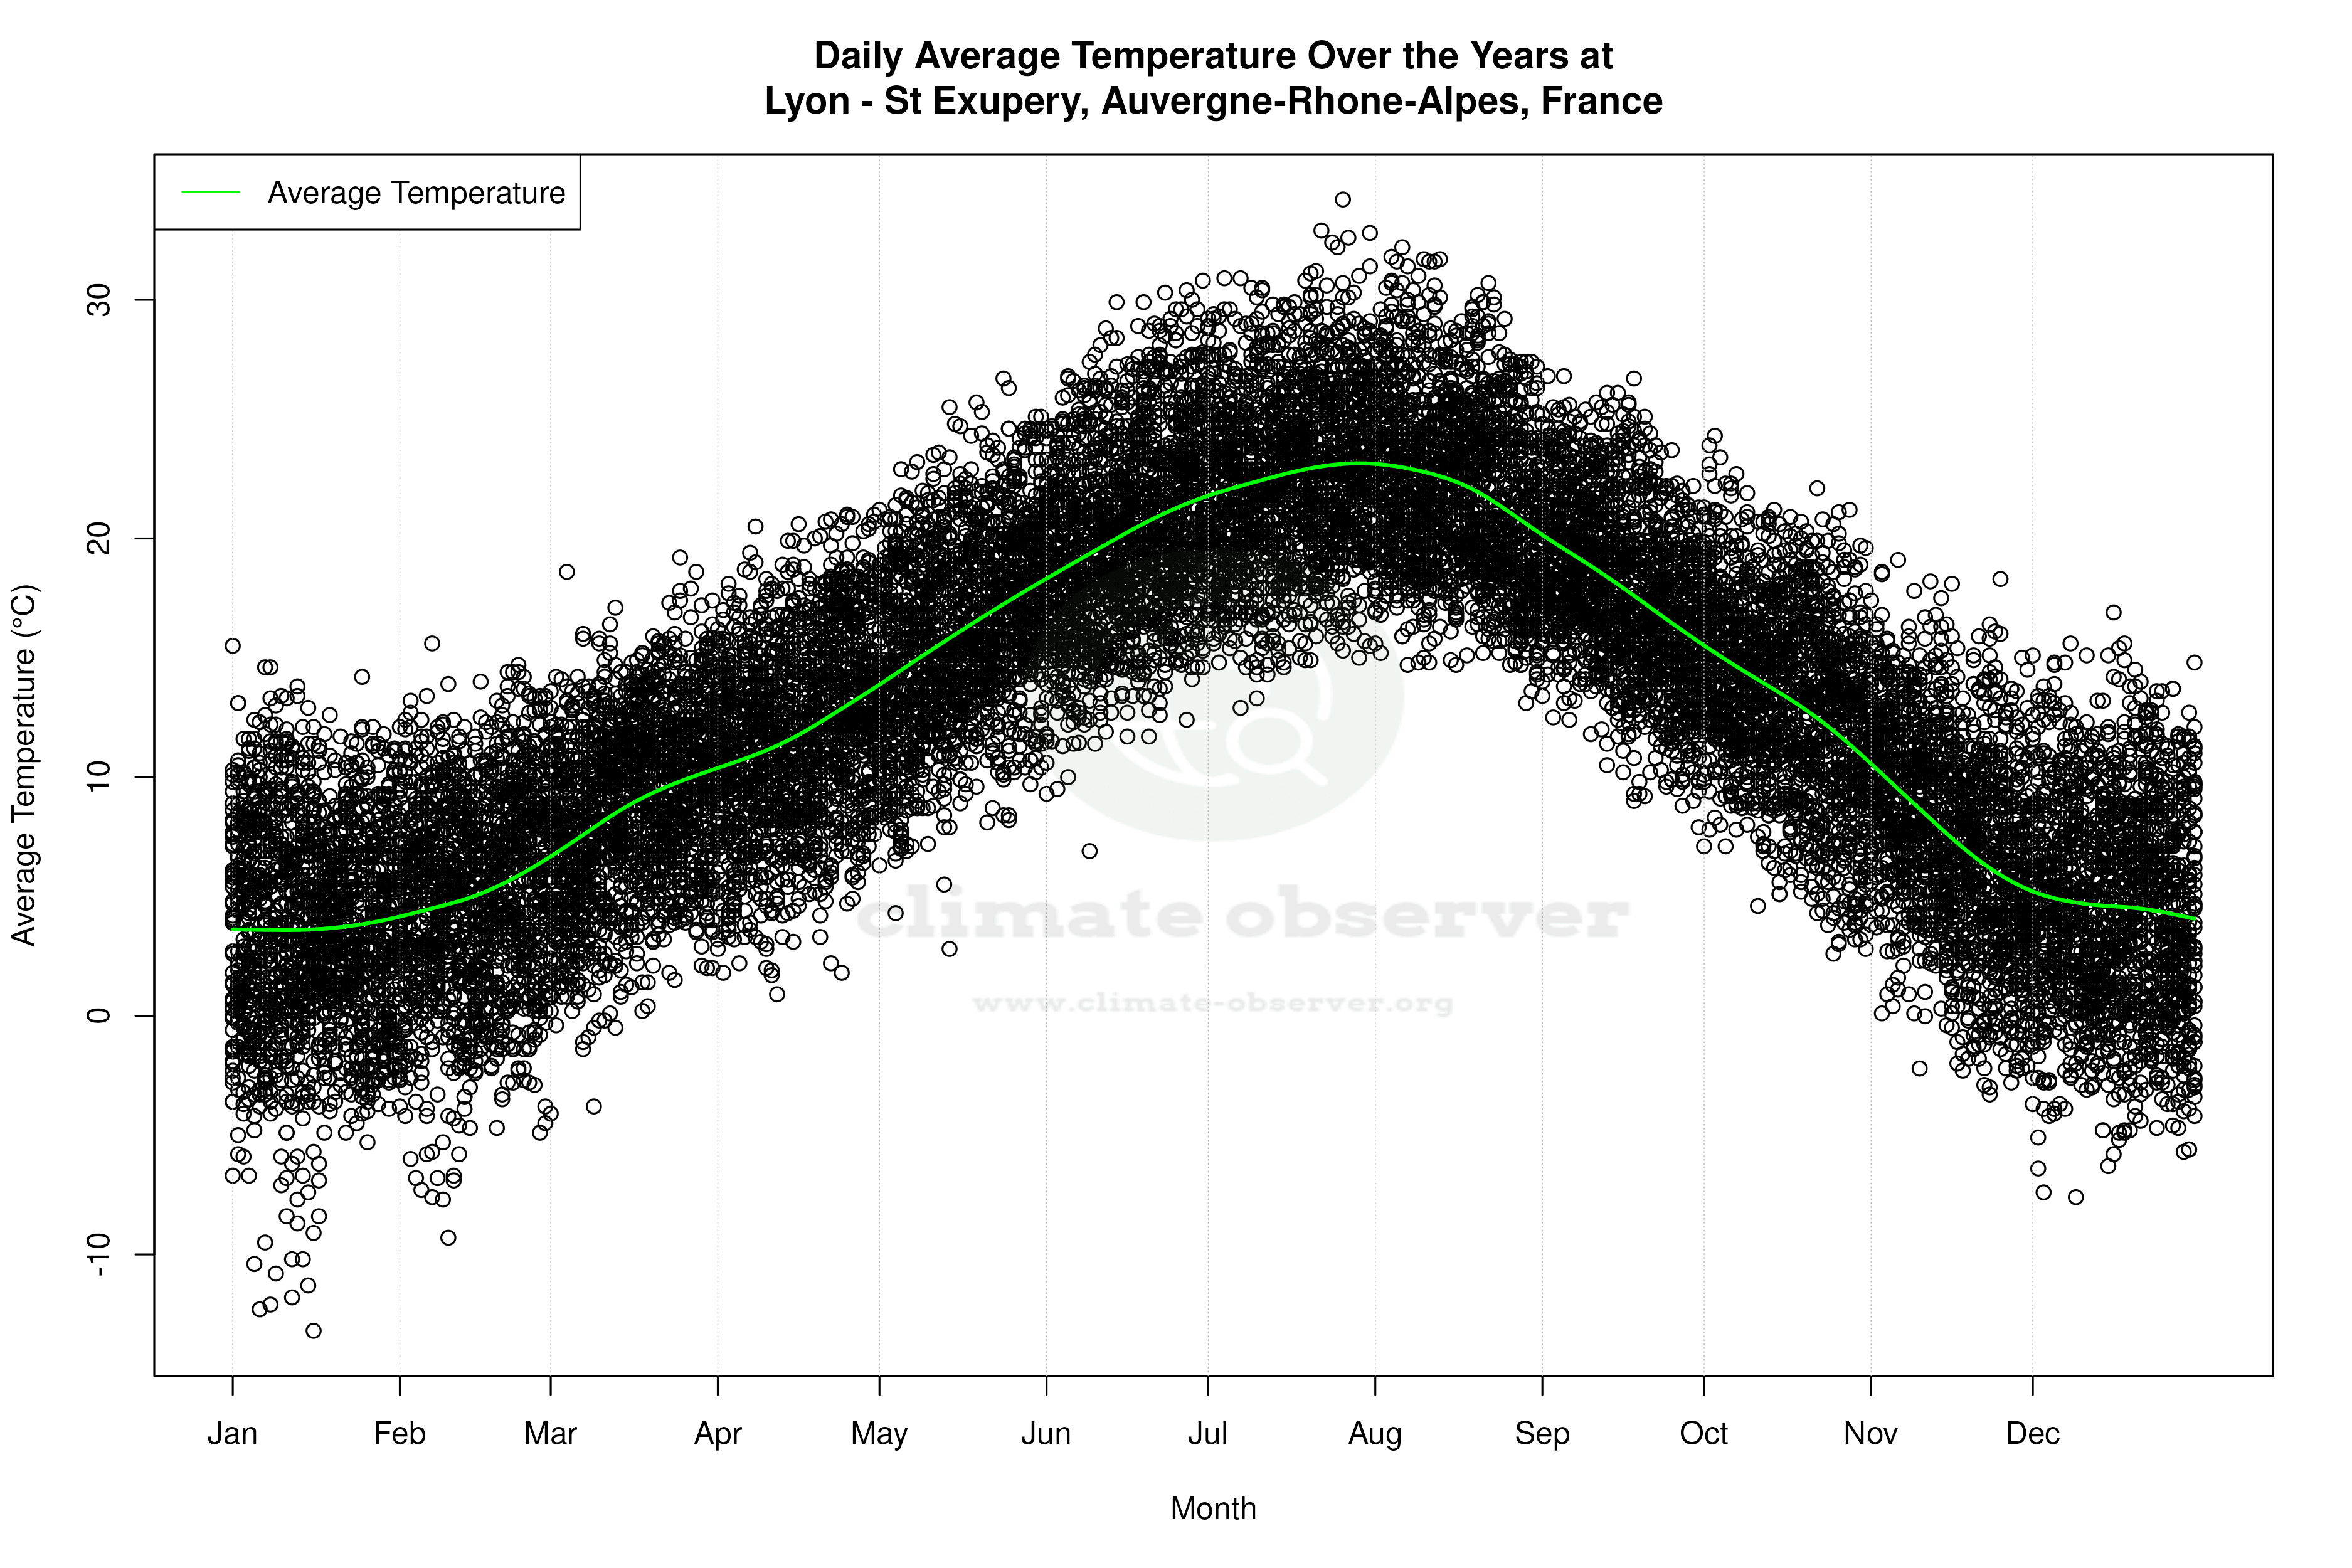


Average Max Temperature Throughout Year | 1 of 5
