Climate for Station: Caen-Carpiquet, Normandy, France
Loading live weather...
Climate Analysis & Overview
The climate profile for Caen-Carpiquet reveals a warming trend over the past decade, with highs increasing by 0.81°C (1.46°F) and lows by 0.88°C (1.59°F). All-time trends show a more moderate warming, with highs rising by 0.25°C (0.45°F) and lows by 0.22°C (0.40°F). The Precipitation Concentration Index (PCI) indicates a slight shift towards more evenly distributed precipitation.
Maritime Influence and Temperature Trends
Situated in Normandie, France, Caen-Carpiquet experiences a temperate oceanic climate, classified under the Köppen system as Cfb. This classification is characterised by mild temperatures and moderate rainfall throughout the year, heavily influenced by proximity to the Atlantic Ocean. Over the past decade, the region has seen a notable warming trend, with average high temperatures rising by 0.81°C (1.46°F) and lows by 0.88°C (1.59°F). This recent warming is more pronounced than the long-term all-time trends, which show a more gradual increase of 0.25°C (0.45°F) for highs and 0.22°C (0.40°F) for lows. The warming over both periods suggests a consistent pattern that aligns with broader regional climate changes and France's commitment to reducing greenhouse gas emissions.
Precipitation Patterns and Distribution
The Precipitation Concentration Index (PCI) for Caen-Carpiquet has shown a slight decrease from a baseline of 11.08 to a current value of 10.78. PCI is a measure of how rainfall is distributed over time, with lower values indicating more evenly spread precipitation. This marginal change suggests that rainfall events have become slightly more evenly distributed, a trend that could be beneficial for agriculture and water management in the region. The even distribution of precipitation aligns with the temperate climate, reducing the risk of extreme weather events such as floods or droughts.
Extreme Temperature Records
Caen-Carpiquet's temperature records highlight the potential for extreme weather events. The highest recorded temperature is 39.7°C (103.5°F), while the lowest is -19.6°C (-3.3°F). These extremes underscore the variability inherent in the region's climate, despite the overall temperate classification. Such records are critical for understanding the potential impacts of climate change, as they provide benchmarks for future temperature fluctuations.
Implications for Regional Climate Goals
In the context of France's regional climate goals, the observed warming trends in Caen-Carpiquet are significant. France aims to achieve carbon neutrality by 2050, and understanding local climate dynamics is crucial for tailoring effective mitigation strategies. The warming trends and slight changes in precipitation distribution highlight the need for adaptive measures to address the impacts of climate change on local ecosystems and communities. As Caen-Carpiquet continues to experience these shifts, ongoing monitoring and analysis will be vital to inform policy and ensure resilience against future climate challenges.
Station Statistics
10-Year Trend
High: +1.77 °F/decade
Low: +2.00 °F/decade
Rain: +0.046 in/decade
25-Year Trend
High: +0.89 °F/decade
Low: +0.45 °F/decade
Rain: +0.014 in/decade
50-Year Trend
High: +0.75 °F/decade
Low: +0.34 °F/decade
Rain: +0.003 in/decade
All-Time Trend
High: +0.46 °F/decade
Low: +0.41 °F/decade
Rain: +0.002 in/decade
Percentage Above-Average Days
Last 12 Months: 60.8%
This Year: 73.2%
Precipitation Concentration Index (PCI) ℹ️
Last 12 Months: 10.3
Historical Average: 10.6
Percentile Rank of Last 12 Months ℹ️
High: 96th percentile
Low: 92nd percentile
Rain: 95th percentile
Change in Variance ℹ️
High: +2.2%
Low: -5.2%
Intraday: +14.2%
Data Coverage
90.8%
First Year of Data
1944
Station Location
Historical Weather Records
| Max High | Avg High | Min High | Max Avg | Avg Avg | Min Avg | Max Low | Avg Low | Min Low | Max Precipitation | Avg Precipitation | Max Snow | Avg Snow | |
|---|---|---|---|---|---|---|---|---|---|---|---|---|---|
| Record | 103.46 °F | — | 18.86 °F | 83.48 °F | — | 10.22 °F | 70.88 °F | — | -3.28 °F | 3.39 in | — | — | — |
| January | 62.24 °F | 45.87 °F | 18.86 °F | 57.20 °F | 41.57 °F | 10.22 °F | 55.04 °F | 35.87 °F | -3.28 °F | 1.24 in | 0.09 in | — | — |
| February | 69.44 °F | 47.36 °F | 19.94 °F | 58.82 °F | 42.24 °F | 16.70 °F | 53.78 °F | 36.06 °F | 2.30 °F | 1.52 in | 0.08 in | — | — |
| March | 76.82 °F | 52.37 °F | 31.82 °F | 59.90 °F | 45.76 °F | 25.52 °F | 57.20 °F | 38.52 °F | 18.68 °F | 1.13 in | 0.07 in | — | — |
| April | 79.88 °F | 56.62 °F | 38.12 °F | 65.12 °F | 49.10 °F | 34.16 °F | 57.38 °F | 41.17 °F | 21.74 °F | 1.22 in | 0.06 in | — | — |
| May | 86.72 °F | 62.58 °F | 43.16 °F | 74.98 °F | 54.97 °F | 39.38 °F | 65.28 °F | 46.58 °F | 30.56 °F | 1.08 in | 0.08 in | — | — |
| June | 95.36 °F | 67.99 °F | 51.62 °F | 79.88 °F | 60.23 °F | 48.92 °F | 68.18 °F | 51.35 °F | 33.80 °F | 1.93 in | 0.07 in | — | — |
| July | 103.46 °F | 72.15 °F | 56.30 °F | 83.48 °F | 63.96 °F | 51.08 °F | 70.88 °F | 54.75 °F | 40.46 °F | 3.39 in | 0.07 in | — | — |
| August | 102.02 °F | 72.33 °F | 56.12 °F | 81.50 °F | 64.12 °F | 51.08 °F | 69.98 °F | 54.97 °F | 37.40 °F | 1.98 in | 0.07 in | — | — |
| September | 92.30 °F | 68.18 °F | 51.98 °F | 76.82 °F | 59.94 °F | 46.58 °F | 66.92 °F | 51.67 °F | 35.24 °F | 1.77 in | 0.09 in | — | — |
| October | 85.28 °F | 61.03 °F | 36.50 °F | 70.34 °F | 54.11 °F | 34.70 °F | 63.68 °F | 46.88 °F | 25.34 °F | 3.23 in | 0.09 in | — | — |
| November | 70.88 °F | 52.33 °F | 30.20 °F | 61.34 °F | 47.20 °F | 28.04 °F | 60.26 °F | 41.12 °F | 19.76 °F | 2.26 in | 0.11 in | — | — |
| December | 63.14 °F | 47.27 °F | 23.54 °F | 59.72 °F | 43.04 °F | 23.18 °F | 56.66 °F | 37.48 °F | 12.20 °F | 1.60 in | 0.10 in | — | — |
Data Visualisations
Remove WatermarksCurrent Year Climate Trends vs Historical
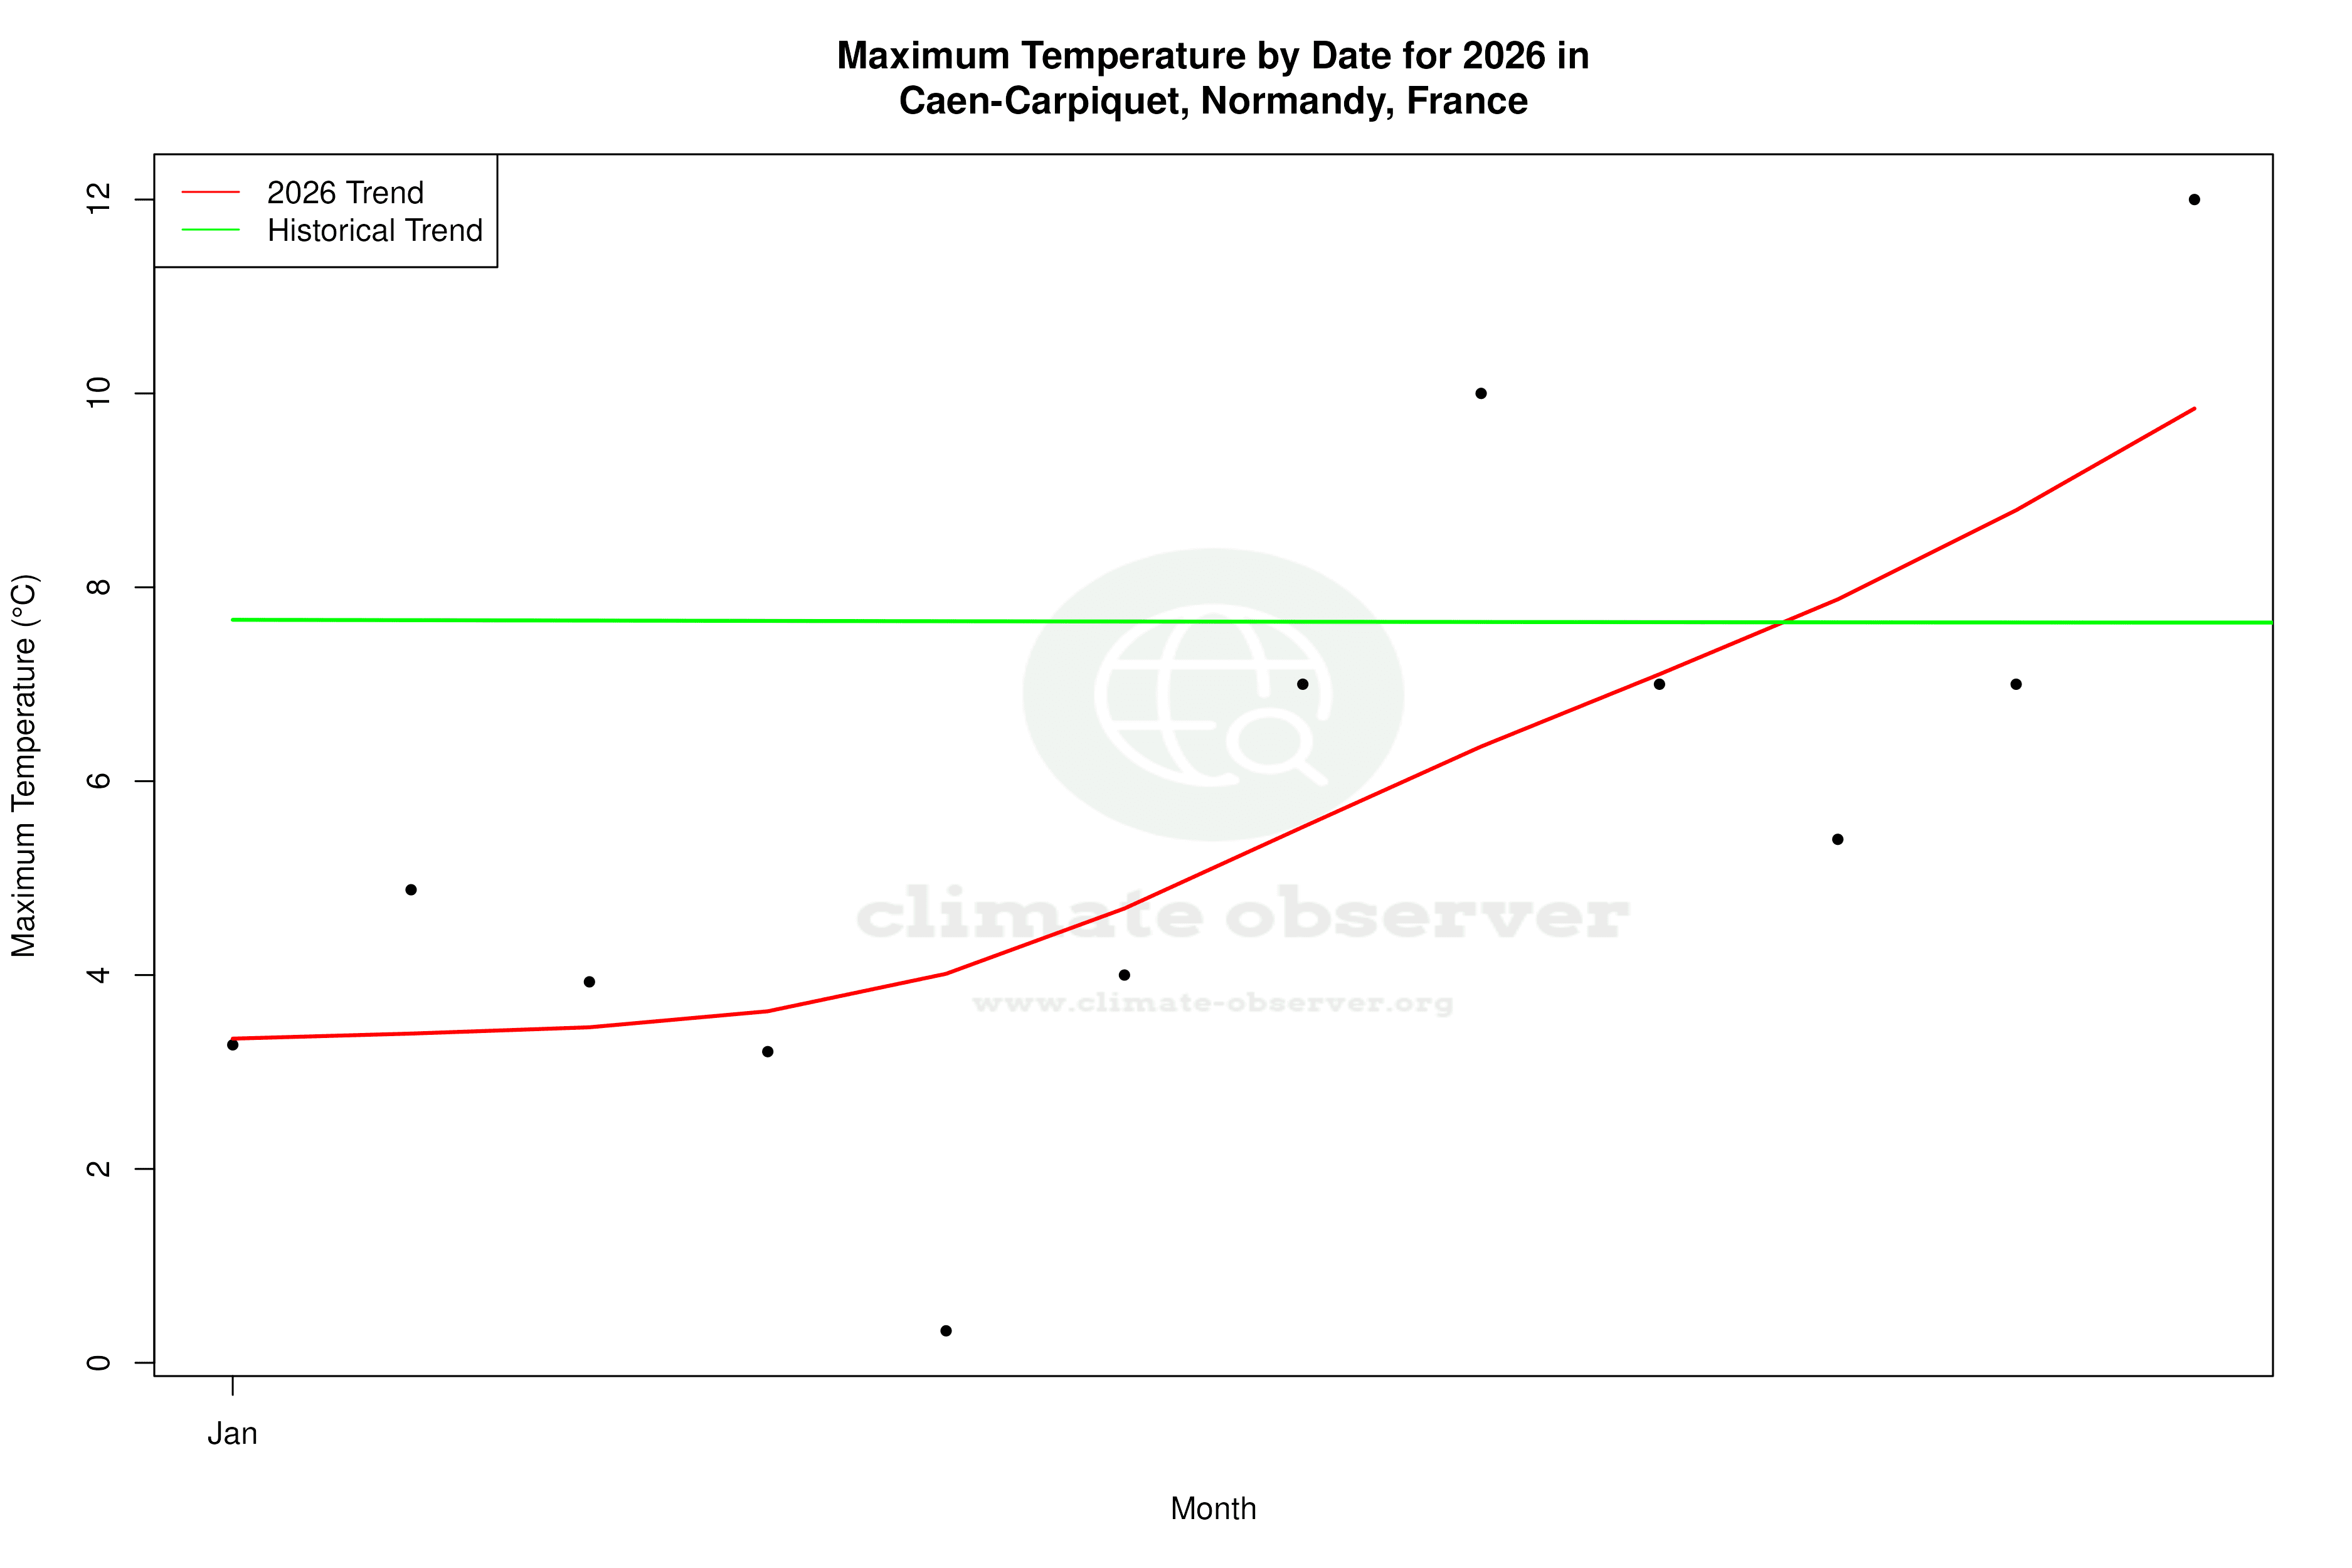


Max Temperature this Year | 1 of 6
Climate 12-Month Moving Averages


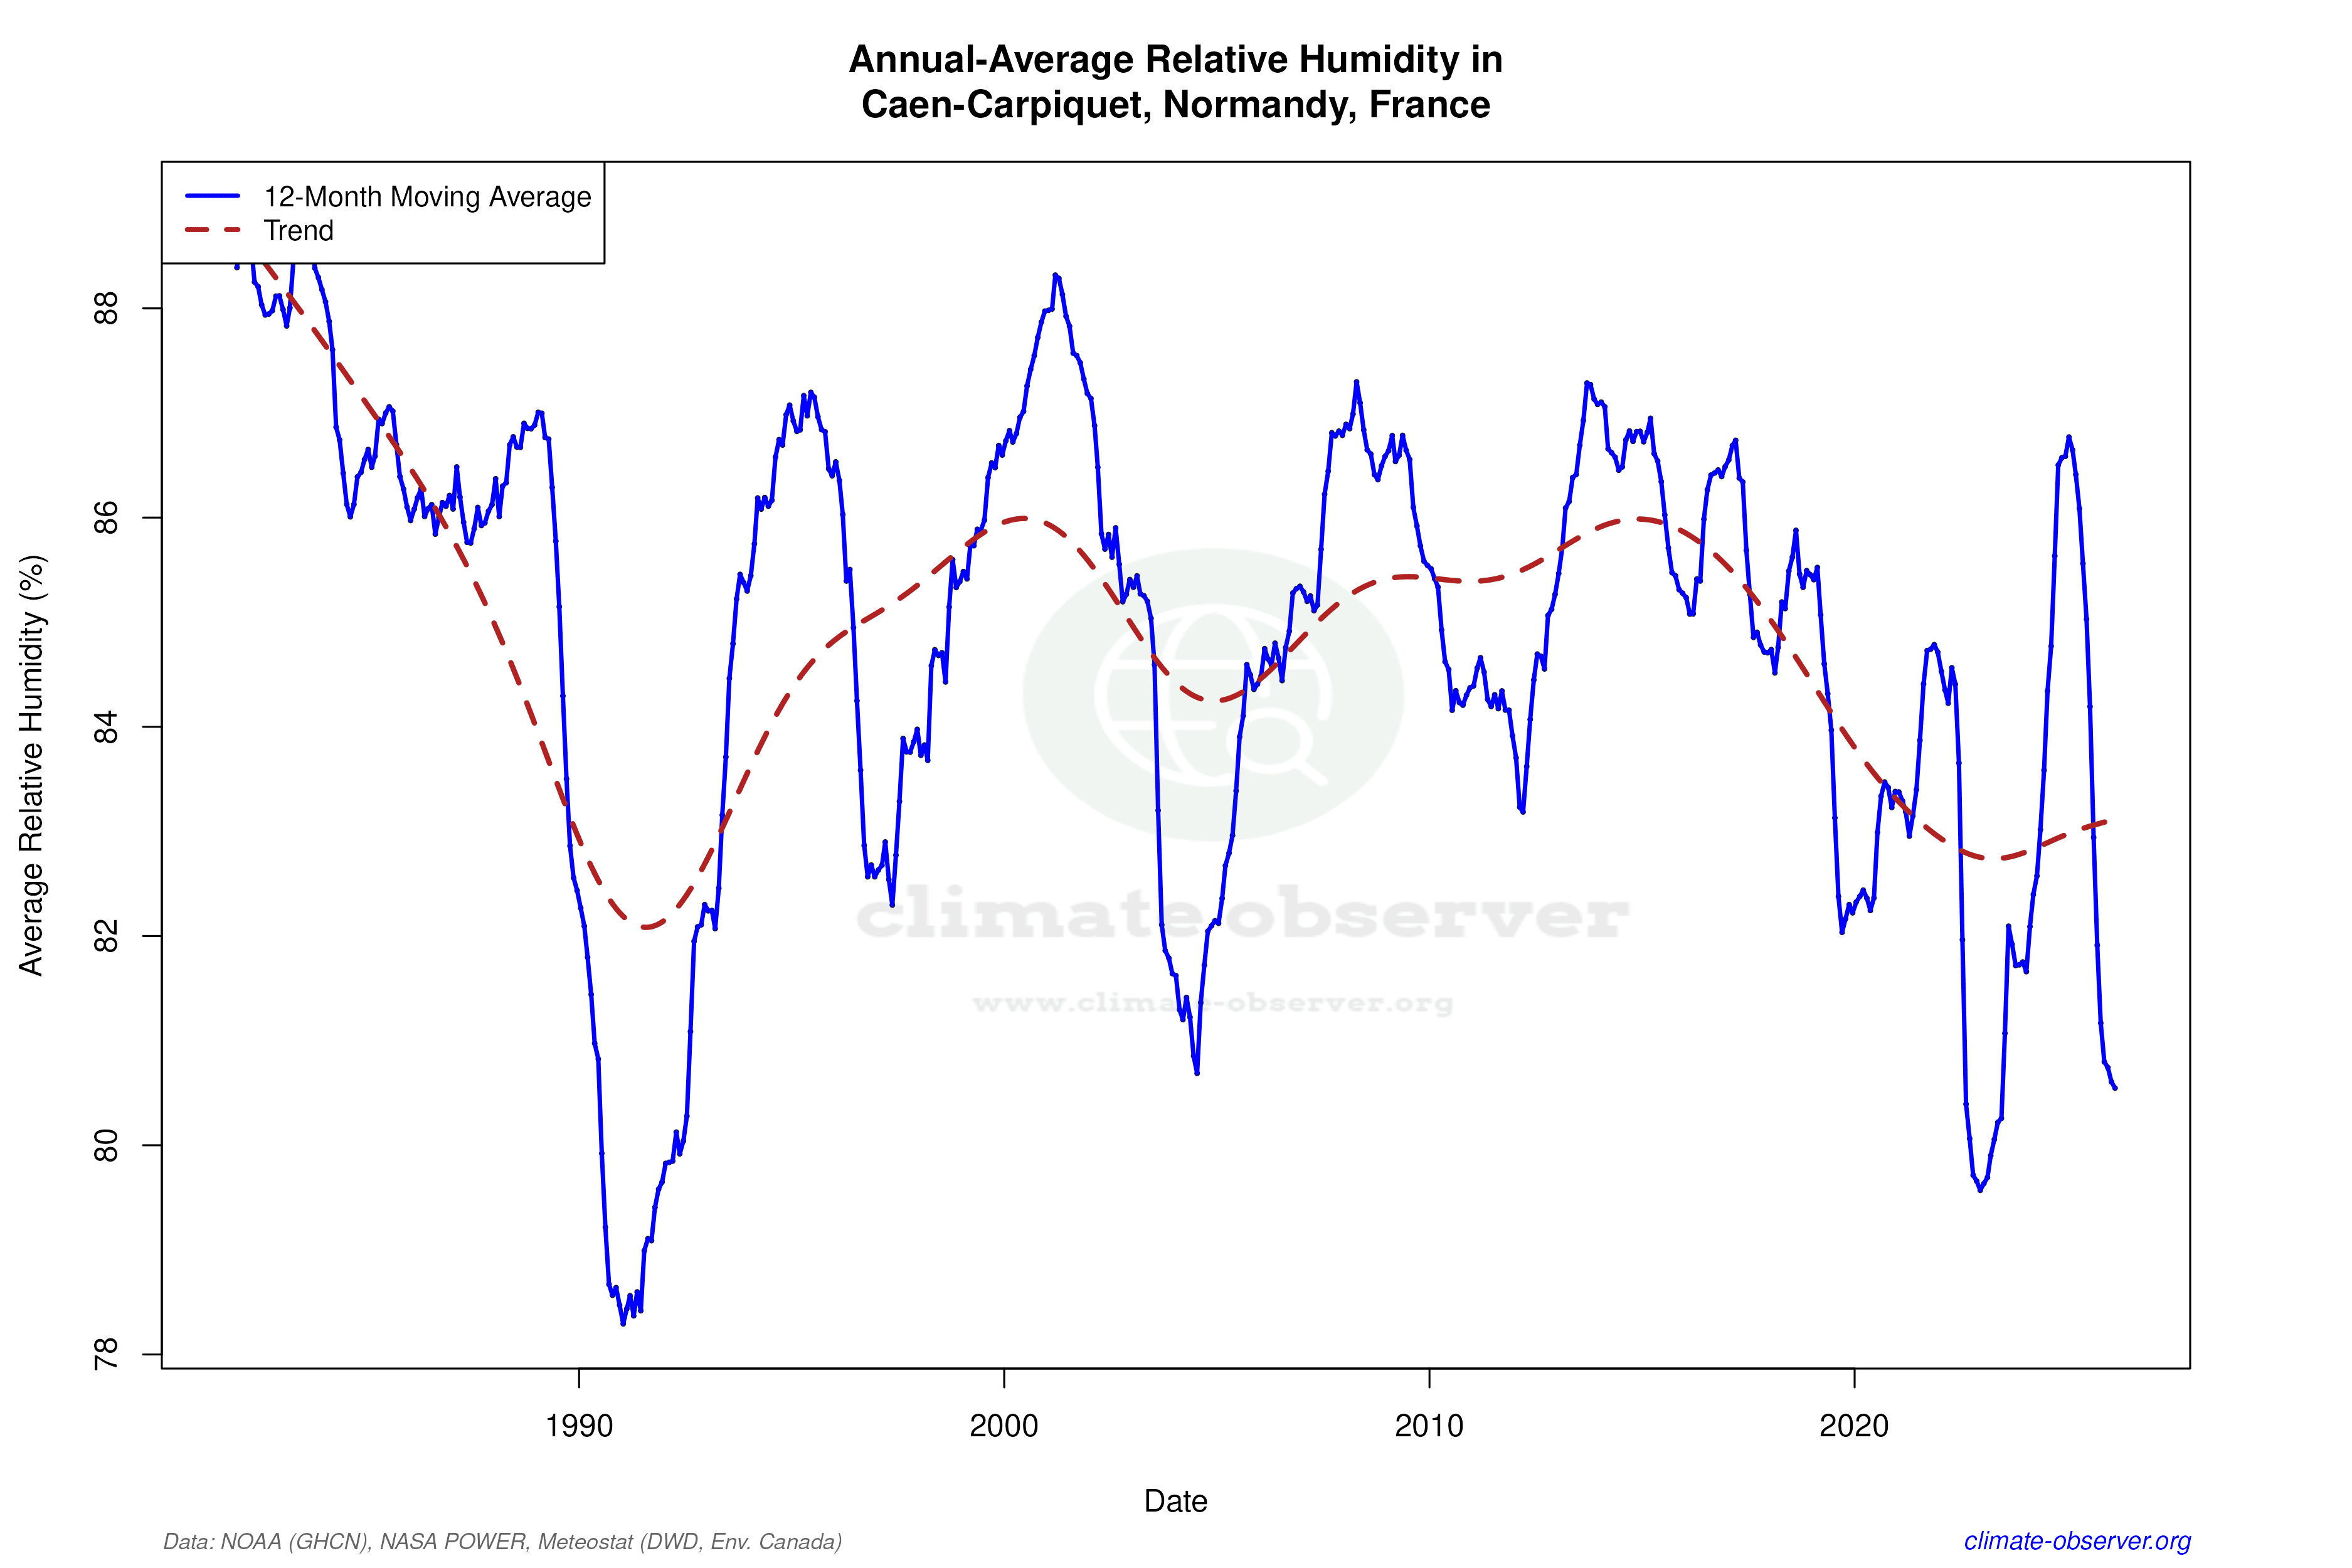

Max Temperature 12-Month MA | 1 of 6
Daily Data Points and Averages Throughout the Year


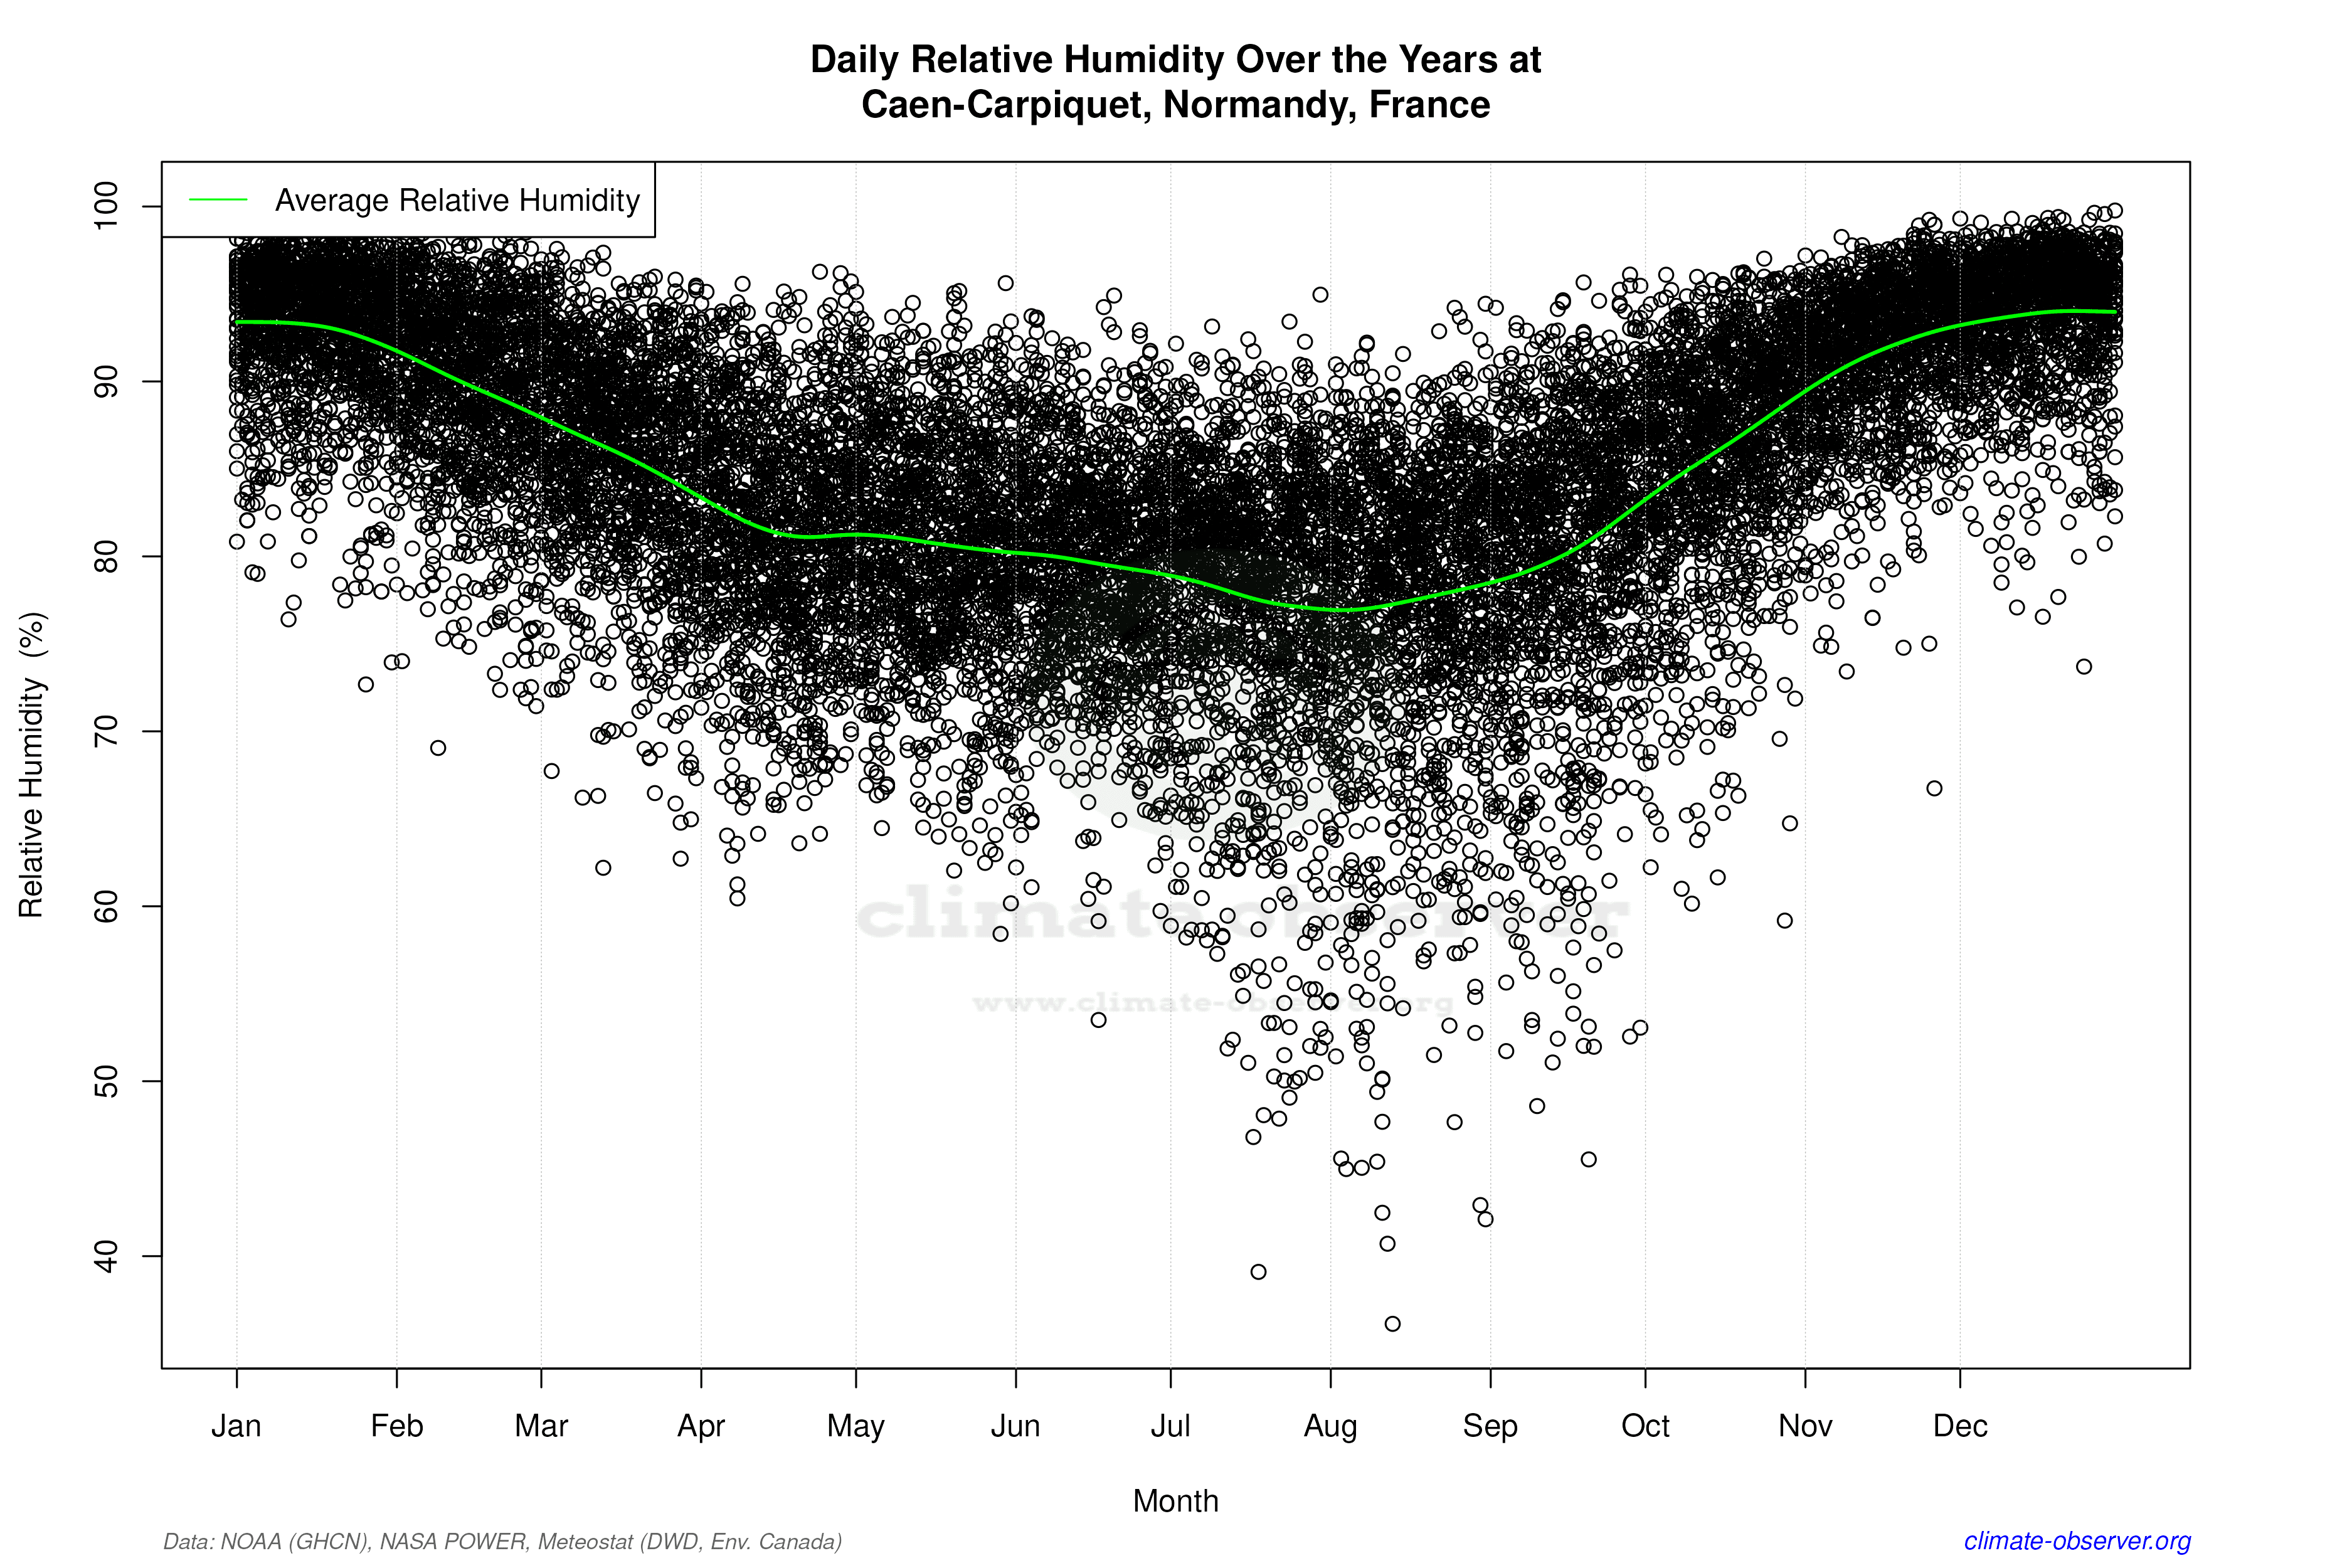

Average Max Temperature Throughout Year | 1 of 5
