Climate for Station: Brest-Guipavas, Brittany, France
Loading live weather...
Climate Analysis & Overview
Brest-Guipavas is experiencing a warming trend, with notable increases in both high and low temperatures over the past decade, aligning with broader regional climate trends. The Precipitation Concentration Index indicates a slight shift towards more concentrated rainfall events, reflecting changes in precipitation patterns.
Maritime Influence and Climate Classification
Brest-Guipavas, located at 48.4442°N, -4.4117°E, is characterised by a temperate oceanic climate, classified as Cfb in the Köppen system. This classification is typical for coastal regions in Brittany, where the proximity to the Atlantic Ocean moderates temperatures, reducing extremes. The maritime influence ensures mild winters and cool summers, with consistent precipitation throughout the year. The local geography, including its coastal position, plays a significant role in shaping the climate, buffering against severe temperature fluctuations and promoting a stable climate regime.
Warming Trends Over Time
The all-time temperature trends in Brest-Guipavas reveal a gradual warming, with high temperatures increasing by 0.26°C (0.47°F) and low temperatures by 0.14°C (0.25°F). These figures highlight a long-term rise in temperature, consistent with global warming patterns observed across Europe. More pronounced are the 10-year trends, where high temperatures have risen by 0.67°C (1.21°F) and lows by 0.63°C (1.13°F), indicating an accelerated warming in recent years. This rapid increase over the last decade may be attributed to regional climatic shifts and anthropogenic factors.
Precipitation Patterns and Concentration
The Precipitation Concentration Index (PCI) for Brest-Guipavas has seen a slight increase from a baseline of 11.86 to a current value of 13.01. The PCI is a measure of how precipitation is distributed over time; a higher value suggests more precipitation is falling in fewer, more intense events. This marginal increase indicates a trend towards more concentrated rainfall, which could have implications for local water management and flood risk strategies. Although not yet at a critical level, this shift warrants monitoring as part of broader climate adaptation efforts.
Temperature Extremes and Records
Temperature records at Brest-Guipavas show an absolute maximum of 35.2°C (95.4°F) and a minimum of -14.0°C (6.8°F). These extremes underscore the variability inherent in the region’s climate, despite its generally moderate conditions. Such records are crucial for understanding the potential range of climate variability and for preparing for extreme weather events, which may become more frequent with ongoing climate change.
Regional Climate Context
Brest-Guipavas's climate changes are reflective of broader regional trends in France, where efforts are underway to mitigate climate impacts through renewable energy initiatives and carbon reduction goals. Recent weather events, such as unusually warm winters or intense summer storms, align with the observed data trends, emphasising the importance of integrating climate resilience into regional planning.
Station Statistics
10-Year Trend
High: +1.17 °F/decade
Low: +1.48 °F/decade
Rain: +0.030 in/decade
25-Year Trend
High: +0.84 °F/decade
Low: +0.29 °F/decade
Rain: +0.006 in/decade
50-Year Trend
High: +0.78 °F/decade
Low: +0.27 °F/decade
Rain: +0.002 in/decade
All-Time Trend
High: +0.49 °F/decade
Low: +0.28 °F/decade
Rain: +0.001 in/decade
Percentage Above-Average Days
Last 12 Months: 57.2%
This Year: 73.2%
Precipitation Concentration Index (PCI) ℹ️
Last 12 Months: 12.4
Historical Average: 11.8
Percentile Rank of Last 12 Months ℹ️
High: 98th percentile
Low: 90th percentile
Rain: 56th percentile
Change in Variance ℹ️
High: +5.1%
Low: +3.1%
Intraday: +40.9%
Data Coverage
91.4%
First Year of Data
1945
Station Location
Historical Weather Records
| Max High | Avg High | Min High | Max Avg | Avg Avg | Min Avg | Max Low | Avg Low | Min Low | Max Precipitation | Avg Precipitation | Max Snow | Avg Snow | |
|---|---|---|---|---|---|---|---|---|---|---|---|---|---|
| Record | 95.36 °F | — | 22.82 °F | 80.02 °F | — | 18.86 °F | 70.52 °F | — | 6.80 °F | 3.50 in | — | — | — |
| January | 62.24 °F | 48.37 °F | 22.82 °F | 56.12 °F | 44.38 °F | 18.86 °F | 54.32 °F | 39.31 °F | 6.80 °F | 3.50 in | 0.18 in | — | — |
| February | 69.26 °F | 49.02 °F | 26.78 °F | 57.74 °F | 44.53 °F | 22.46 °F | 54.32 °F | 39.22 °F | 7.88 °F | 2.91 in | 0.15 in | — | — |
| March | 73.94 °F | 52.47 °F | 34.34 °F | 62.06 °F | 46.71 °F | 31.46 °F | 54.50 °F | 41.07 °F | 23.18 °F | 1.85 in | 0.12 in | — | — |
| April | 81.68 °F | 55.86 °F | 39.20 °F | 69.08 °F | 49.24 °F | 35.24 °F | 56.30 °F | 42.81 °F | 27.68 °F | 2.17 in | 0.10 in | — | — |
| May | 85.10 °F | 60.78 °F | 44.60 °F | 75.25 °F | 54.22 °F | 42.08 °F | 65.77 °F | 47.32 °F | 30.56 °F | 1.81 in | 0.09 in | — | — |
| June | 93.74 °F | 65.42 °F | 51.62 °F | 76.46 °F | 58.78 °F | 47.48 °F | 68.00 °F | 51.69 °F | 35.60 °F | 1.69 in | 0.08 in | — | — |
| July | 95.36 °F | 68.60 °F | 55.94 °F | 80.02 °F | 61.94 °F | 51.80 °F | 67.46 °F | 54.85 °F | 39.20 °F | 1.47 in | 0.07 in | — | — |
| August | 92.79 °F | 68.79 °F | 55.40 °F | 78.49 °F | 61.93 °F | 50.90 °F | 70.52 °F | 55.16 °F | 42.44 °F | 2.22 in | 0.09 in | — | — |
| September | 90.68 °F | 65.97 °F | 53.42 °F | 75.92 °F | 58.95 °F | 46.94 °F | 68.54 °F | 52.75 °F | 37.22 °F | 2.42 in | 0.10 in | — | — |
| October | 82.58 °F | 60.44 °F | 46.04 °F | 68.36 °F | 54.44 °F | 39.56 °F | 63.68 °F | 48.98 °F | 29.30 °F | 3.25 in | 0.15 in | — | — |
| November | 69.26 °F | 53.79 °F | 35.78 °F | 60.98 °F | 49.19 °F | 28.58 °F | 58.64 °F | 43.98 °F | 20.12 °F | 1.88 in | 0.18 in | — | — |
| December | 64.94 °F | 50.04 °F | 31.82 °F | 59.72 °F | 45.95 °F | 28.76 °F | 57.20 °F | 40.93 °F | 13.82 °F | 2.41 in | 0.19 in | — | — |
Data Visualisations
Remove WatermarksCurrent Year Climate Trends vs Historical


Max Temperature this Year | 1 of 6
Climate 12-Month Moving Averages


Max Temperature 12-Month MA | 1 of 6
Daily Data Points and Averages Throughout the Year


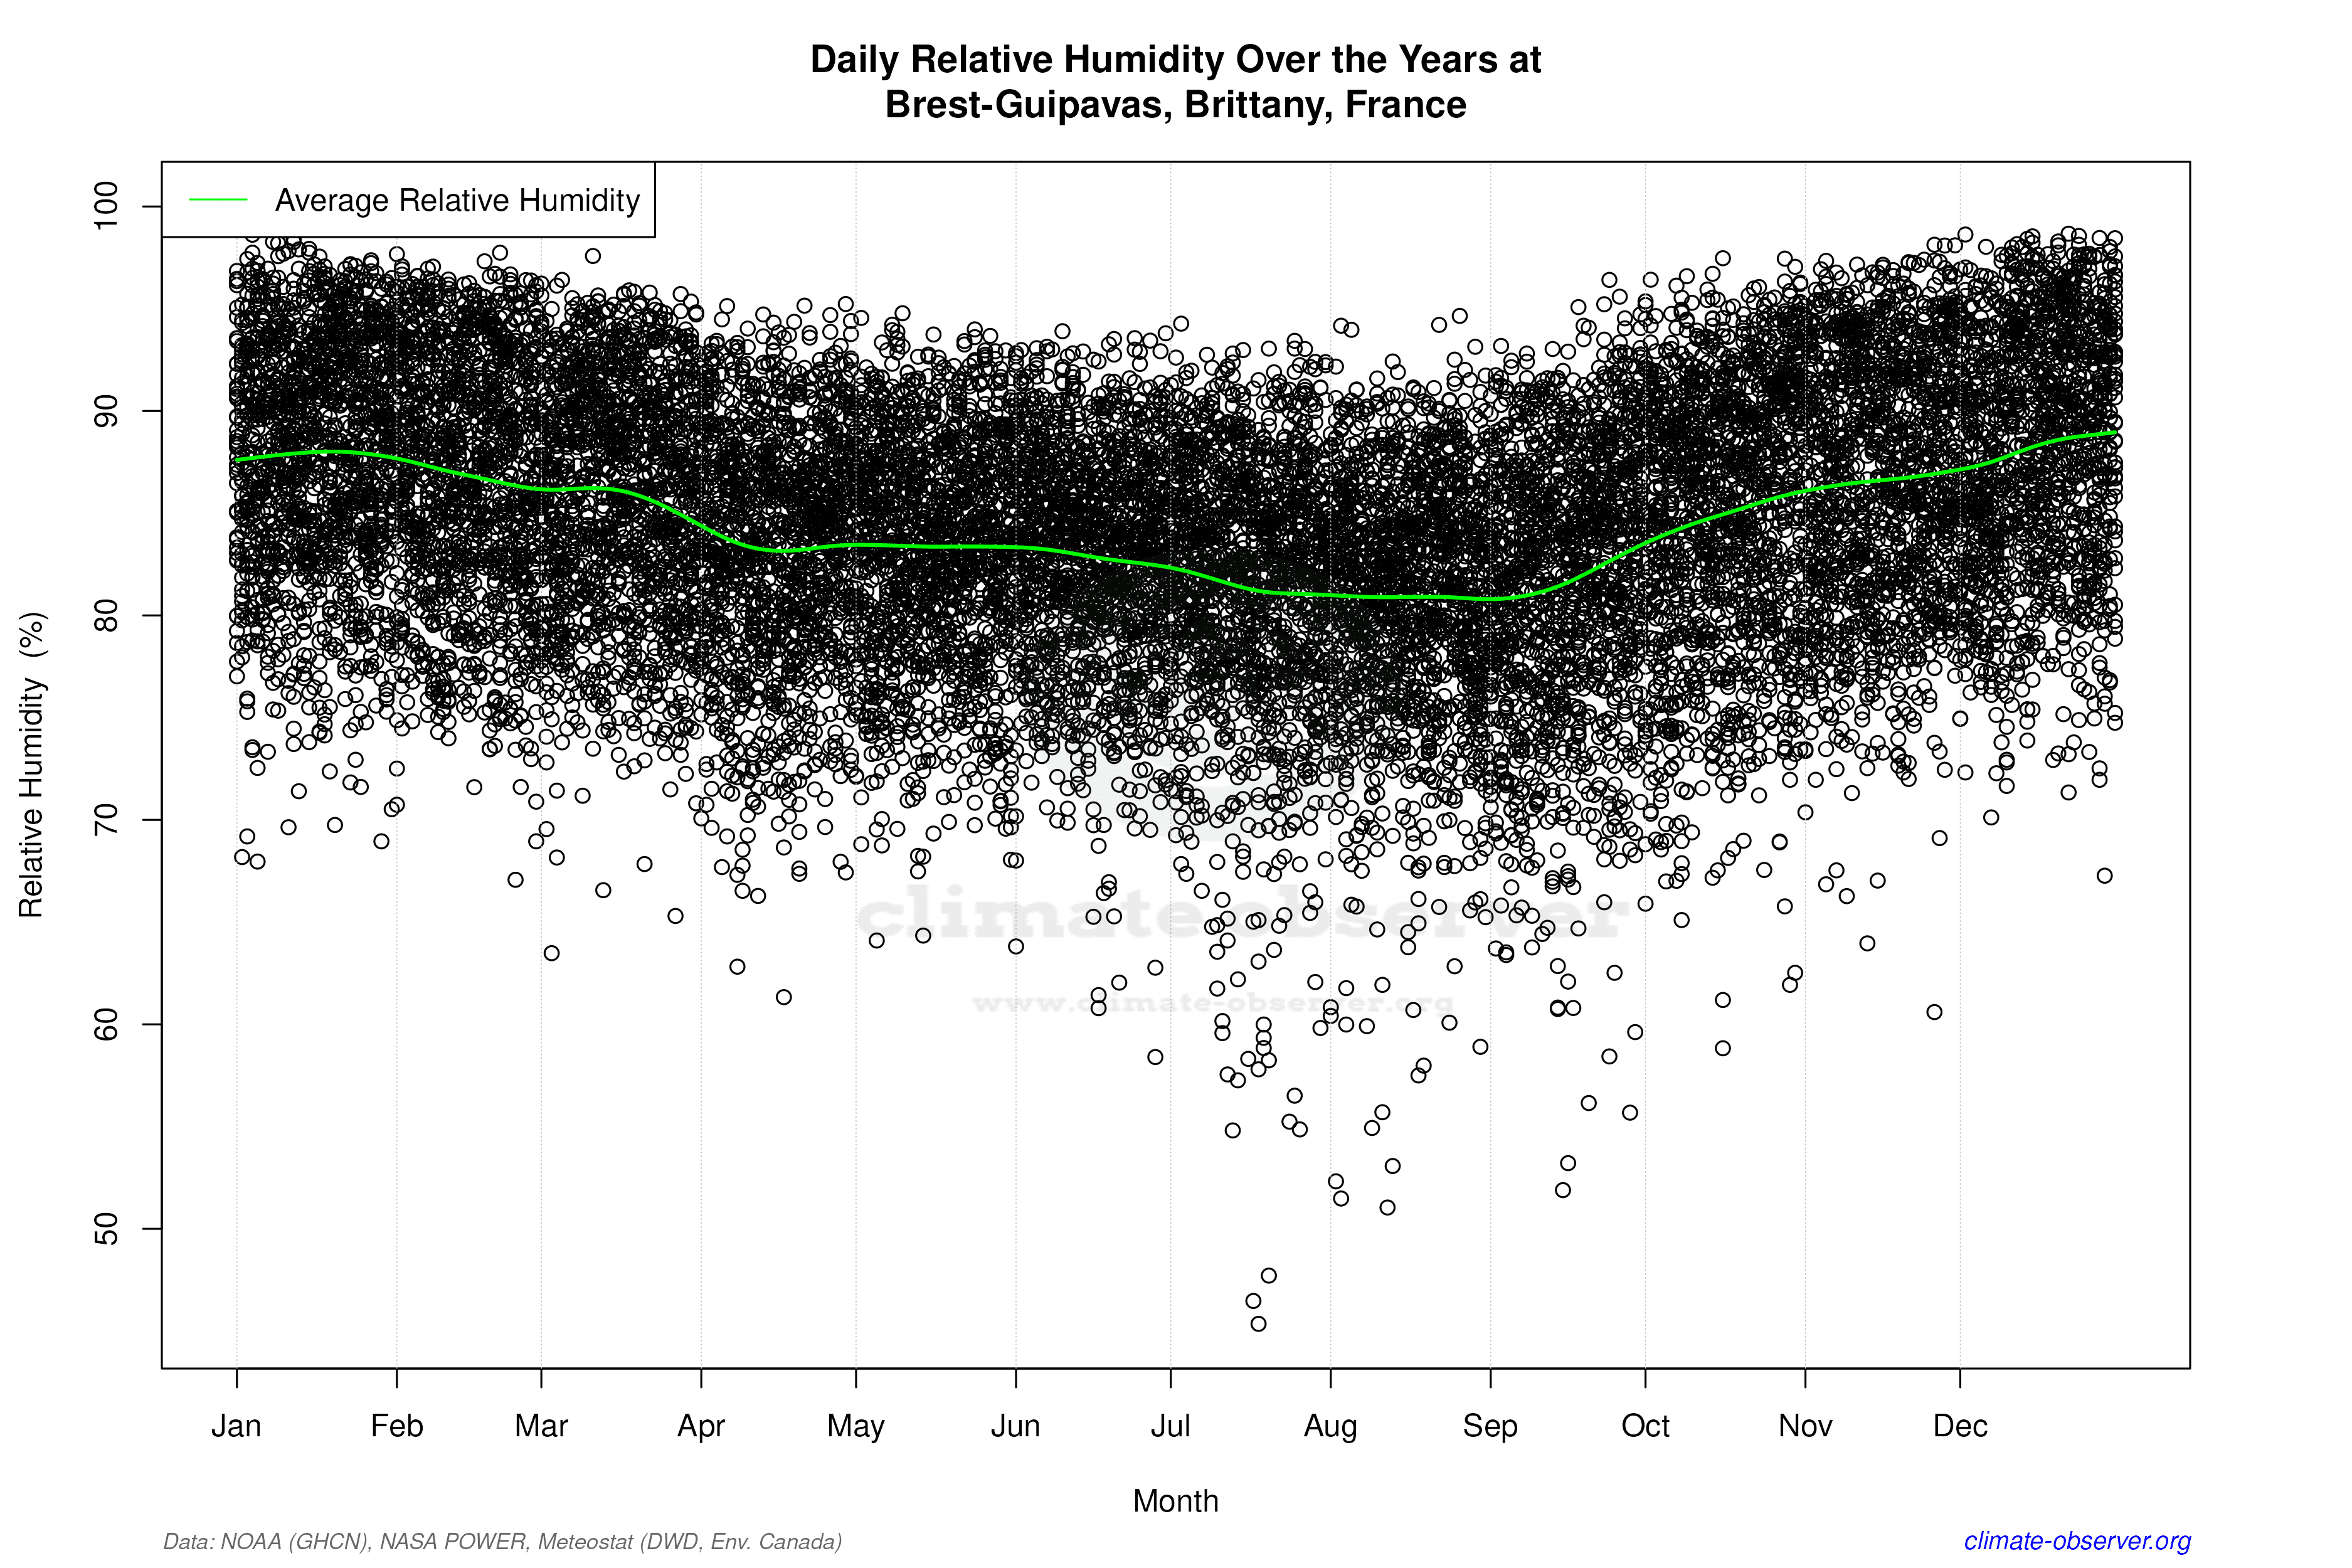

Average Max Temperature Throughout Year | 1 of 5
