Climate for Station: Mitt. Narsarsuaq, Greenland, Greenland [Denmark]
Loading live weather...
Climate Analysis & Overview
The climate profile for Mitt. Narsarsuaq reveals a complex interplay of warming and cooling trends, with a notable shift toward more evenly distributed precipitation. While the all-time data suggests a slight warming, recent trends indicate a cooling in highs, highlighting the nuanced climate dynamics of this Greenlandic region.
Köppen Climate Classification and Geographic Influence
Mitt. Narsarsuaq, located at latitude 61.1667 and longitude -45.4167, falls under the Köppen climate classification of ET, or tundra climate. This classification is characterised by cold temperatures and a lack of a true summer. The station is situated near the Tunulliarfik Fjord, which influences local climate patterns by moderating temperatures due to the proximity of the ocean. The surrounding mountainous terrain also plays a crucial role in shaping the microclimate, often leading to significant temperature variations over short distances.
Temperature Trends: A Tale of Two Scales
The all-time temperature trends at Mitt. Narsarsuaq show a slight warming, with highs increasing by 0.11°C (0.20°F) and lows by 0.03°C (0.05°F). However, the past decade tells a different story. High temperatures have cooled by 1.13°C (2.03°F), while low temperatures have warmed by 1.01°C (1.82°F). This divergence suggests a complex thermal oscillation, potentially influenced by broader climatic shifts or localised environmental changes.
Precipitation Patterns: A Shift Towards Even Distribution
The Precipitation Concentration Index (PCI) for Mitt. Narsarsuaq has decreased from a baseline of 12.5 to a current value of 9.4. This indicates a more even distribution of precipitation events over time. A PCI below 10 suggests that rainfall is spread more uniformly across the year, reducing the risk of intense, concentrated precipitation events. This shift could have implications for local ecosystems and water management strategies, aligning with Greenland's broader climate adaptation goals.
Record Extremes: A Snapshot of Variability
The station has recorded a maximum temperature of 25.2°C (77.4°F) and a minimum of -39.8°C (-39.6°F). These extremes highlight the variability inherent in the region's climate, influenced by its geographic location and the interplay between oceanic and terrestrial factors. Such records are crucial for understanding the potential range of climate conditions that can be expected in the future.
Regional Climate Context and Implications
Greenland's climate goals focus on understanding and mitigating the impacts of climate change, particularly in sensitive regions like Mitt. Narsarsuaq. Recent weather events, such as unseasonal temperature spikes or shifts in precipitation patterns, underscore the importance of continuous monitoring. The nuanced trends observed at this station provide valuable insights into the broader climatic changes occurring across Greenland, informing both local and national climate strategies.
Station Statistics
10-Year Trend
High: -1.09 °F/decade
Low: +2.37 °F/decade
Rain: -0.020 in/decade
25-Year Trend
High: -0.57 °F/decade
Low: +0.42 °F/decade
Rain: -0.014 in/decade
50-Year Trend
High: +0.92 °F/decade
Low: +1.27 °F/decade
Rain: +0.004 in/decade
All-Time Trend
High: +0.22 °F/decade
Low: +0.11 °F/decade
Rain: +0.011 in/decade
Percentage Above-Average Days
Last 12 Months: 49.2%
This Year: 25.7%
Precipitation Concentration Index (PCI) ℹ️
Last 12 Months: 10.2
Historical Average: 11.3
Percentile Rank of Last 12 Months ℹ️
High: 70th percentile
Low: 82nd percentile
Rain: 26th percentile
Change in Variance ℹ️
High: -8.9%
Low: -20.5%
Intraday: -10.9%
Data Coverage
84.0%
First Year of Data
1941
Station Location
Historical Weather Records
| Max High | Avg High | Min High | Max Avg | Avg Avg | Min Avg | Max Low | Avg Low | Min Low | Max Precipitation | Avg Precipitation | Max Snow | Avg Snow | |
|---|---|---|---|---|---|---|---|---|---|---|---|---|---|
| Record | 77.36 °F | — | -25.78 °F | 66.92 °F | — | -25.42 °F | 61.34 °F | — | -39.64 °F | 5.22 in | — | — | — |
| January | 57.74 °F | 26.97 °F | -25.78 °F | 52.34 °F | 16.13 °F | -25.42 °F | 49.28 °F | 12.44 °F | -39.64 °F | 4.42 in | 0.12 in | — | — |
| February | 59.72 °F | 27.85 °F | -15.52 °F | 52.70 °F | 16.70 °F | -23.21 °F | 49.64 °F | 12.67 °F | -28.66 °F | 3.44 in | 0.11 in | — | — |
| March | 61.88 °F | 31.40 °F | -6.59 °F | 53.78 °F | 20.60 °F | -20.58 °F | 49.46 °F | 16.64 °F | -22.54 °F | 2.84 in | 0.10 in | — | — |
| April | 66.38 °F | 40.06 °F | 9.82 °F | 56.30 °F | 29.24 °F | -2.92 °F | 53.06 °F | 26.34 °F | -9.76 °F | 2.68 in | 0.10 in | — | — |
| May | 76.64 °F | 49.56 °F | 23.18 °F | 64.94 °F | 38.13 °F | 6.49 °F | 59.18 °F | 35.33 °F | 5.05 °F | 2.42 in | 0.10 in | — | — |
| June | 77.36 °F | 56.64 °F | 35.24 °F | 66.74 °F | 45.67 °F | 26.42 °F | 61.34 °F | 41.62 °F | 24.33 °F | 2.11 in | 0.13 in | — | — |
| July | 75.38 °F | 59.61 °F | 37.83 °F | 66.92 °F | 48.68 °F | 34.21 °F | 59.00 °F | 44.40 °F | 30.16 °F | 2.70 in | 0.13 in | — | — |
| August | 75.20 °F | 57.24 °F | 38.41 °F | 66.20 °F | 46.54 °F | 30.61 °F | 59.00 °F | 42.80 °F | 27.21 °F | 3.04 in | 0.15 in | — | — |
| September | 72.32 °F | 49.71 °F | 28.49 °F | 65.84 °F | 39.46 °F | 19.06 °F | 60.26 °F | 36.84 °F | 17.02 °F | 3.95 in | 0.17 in | — | — |
| October | 65.66 °F | 40.19 °F | 13.28 °F | 60.26 °F | 30.21 °F | 3.85 °F | 59.36 °F | 28.15 °F | -1.84 °F | 3.20 in | 0.13 in | — | — |
| November | 65.30 °F | 32.88 °F | -0.94 °F | 56.48 °F | 23.26 °F | -9.22 °F | 54.14 °F | 20.21 °F | -14.98 °F | 3.90 in | 0.16 in | — | — |
| December | 59.90 °F | 28.21 °F | -10.66 °F | 52.70 °F | 18.30 °F | -21.32 °F | 50.18 °F | 14.31 °F | -32.62 °F | 5.22 in | 0.13 in | — | — |
Data Visualisations
Remove WatermarksCurrent Year Climate Trends vs Historical


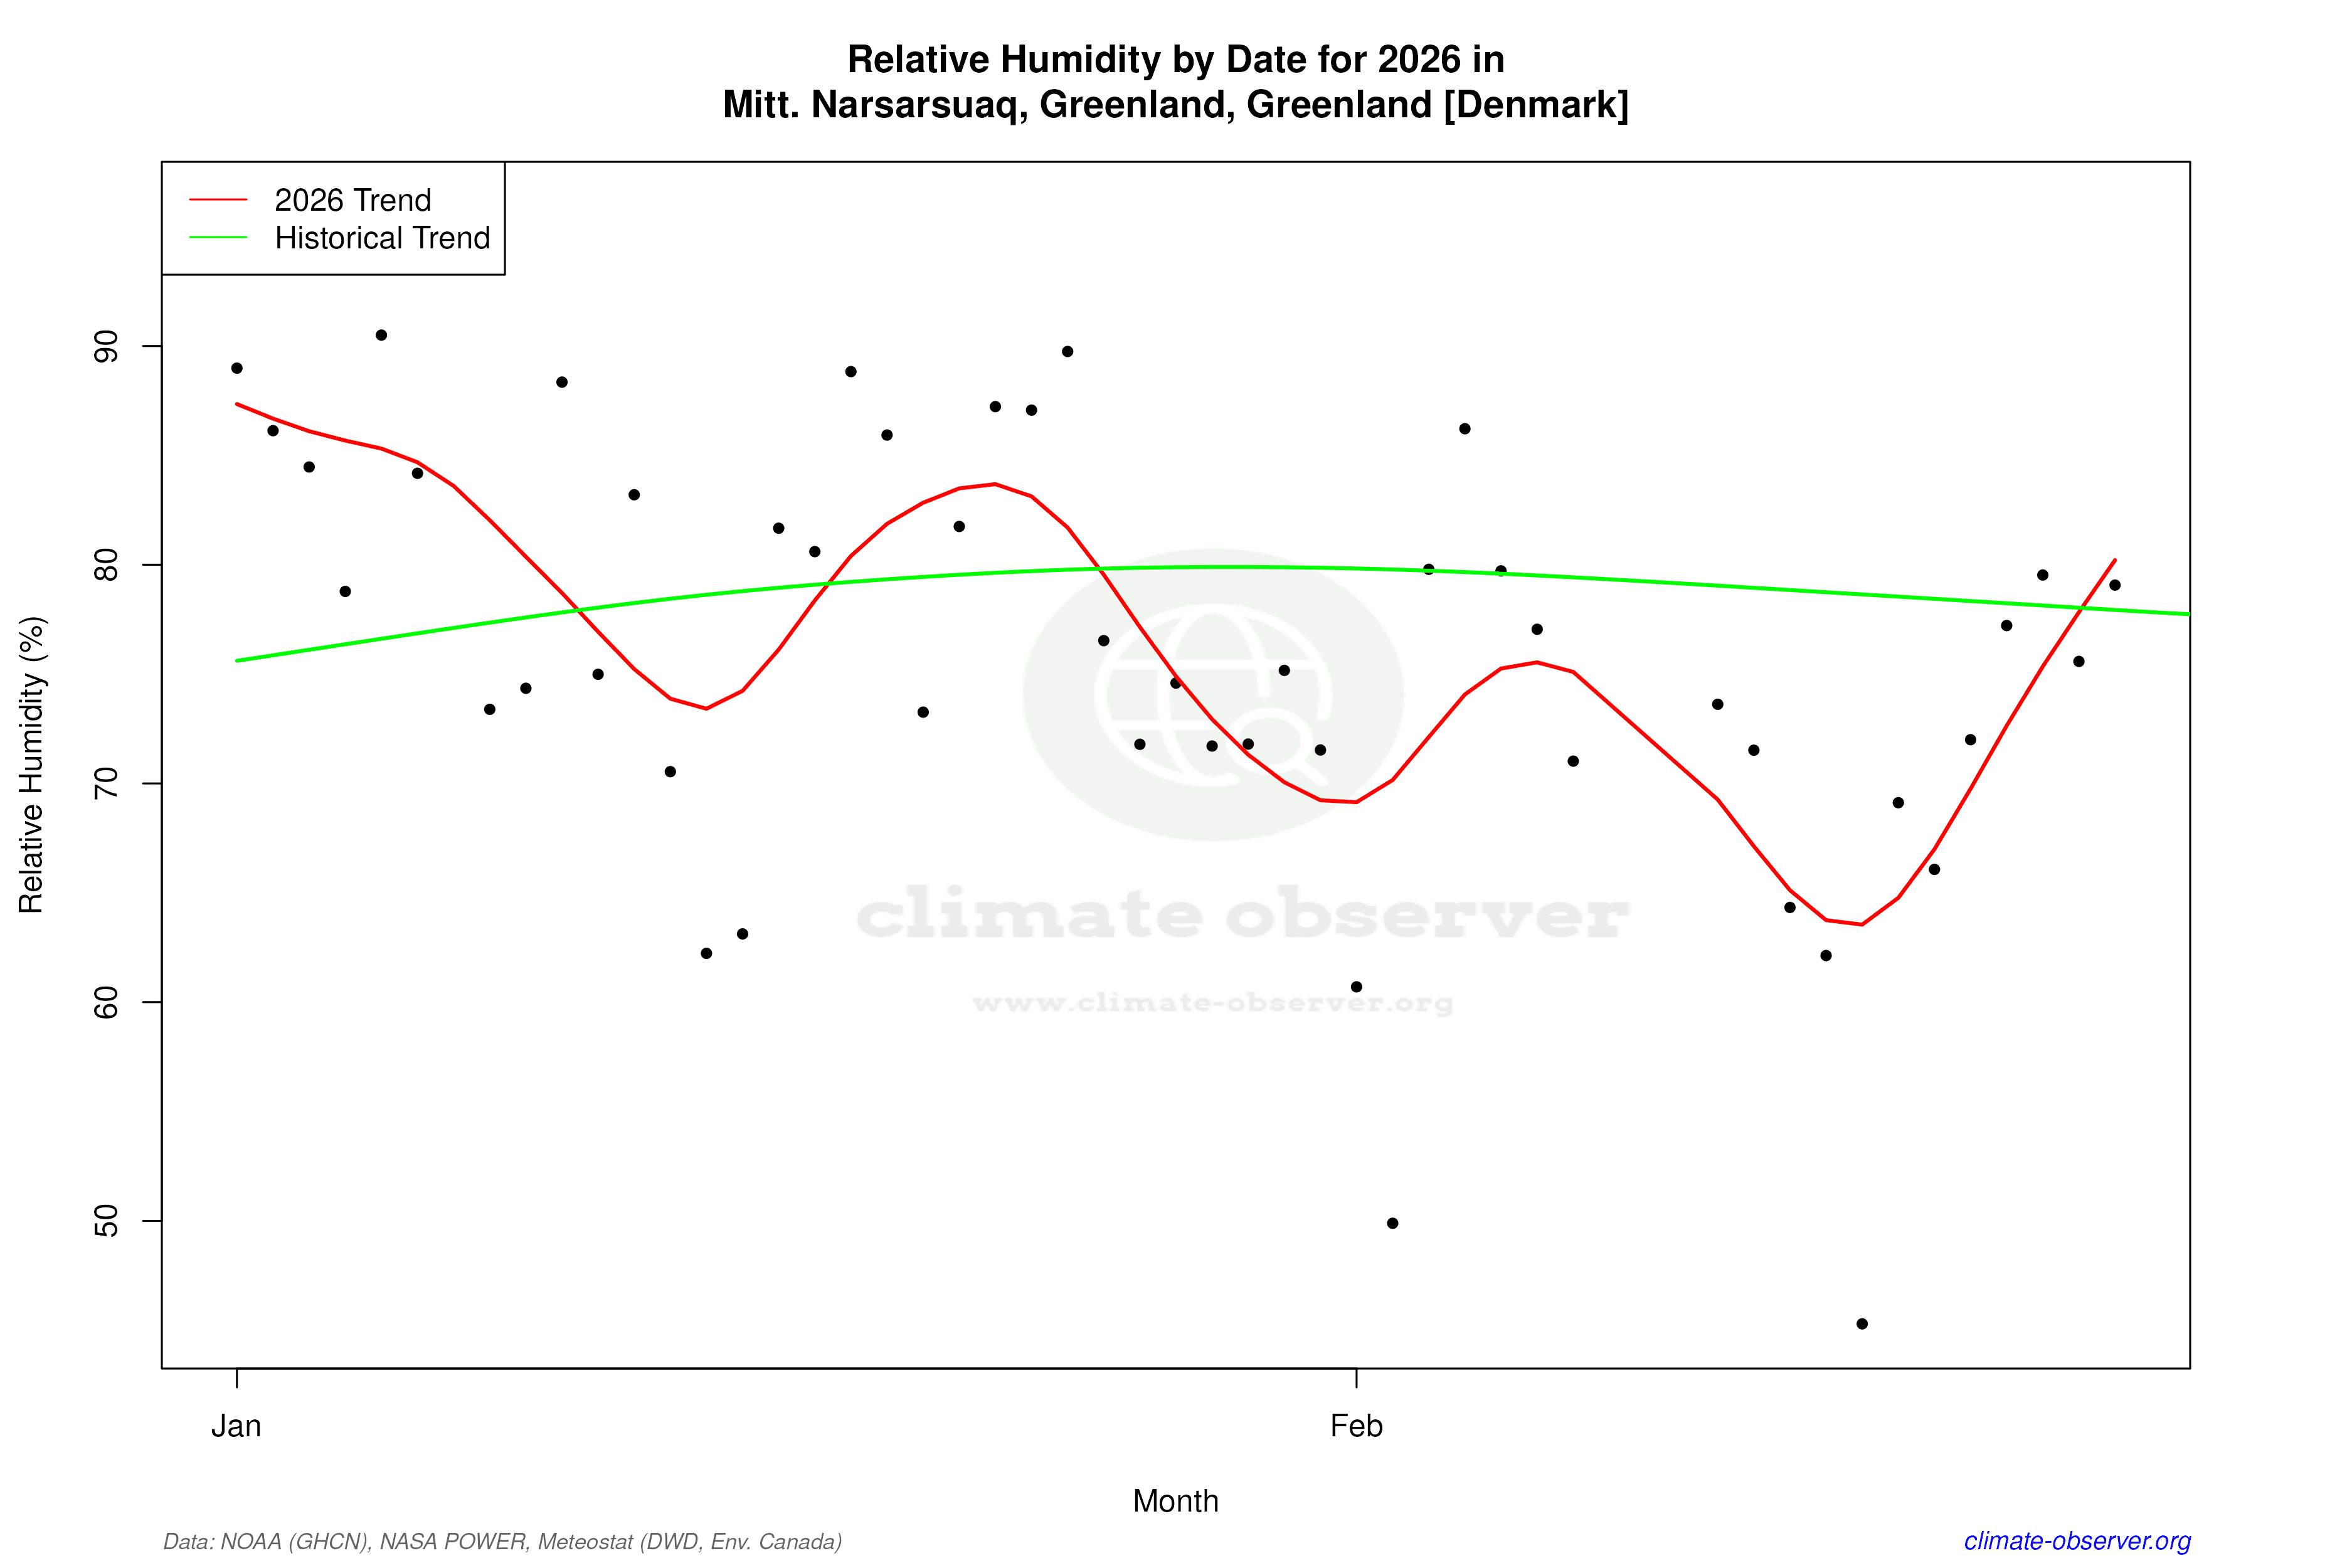

Max Temperature this Year | 1 of 6
Climate 12-Month Moving Averages


Max Temperature 12-Month MA | 1 of 6
Daily Data Points and Averages Throughout the Year

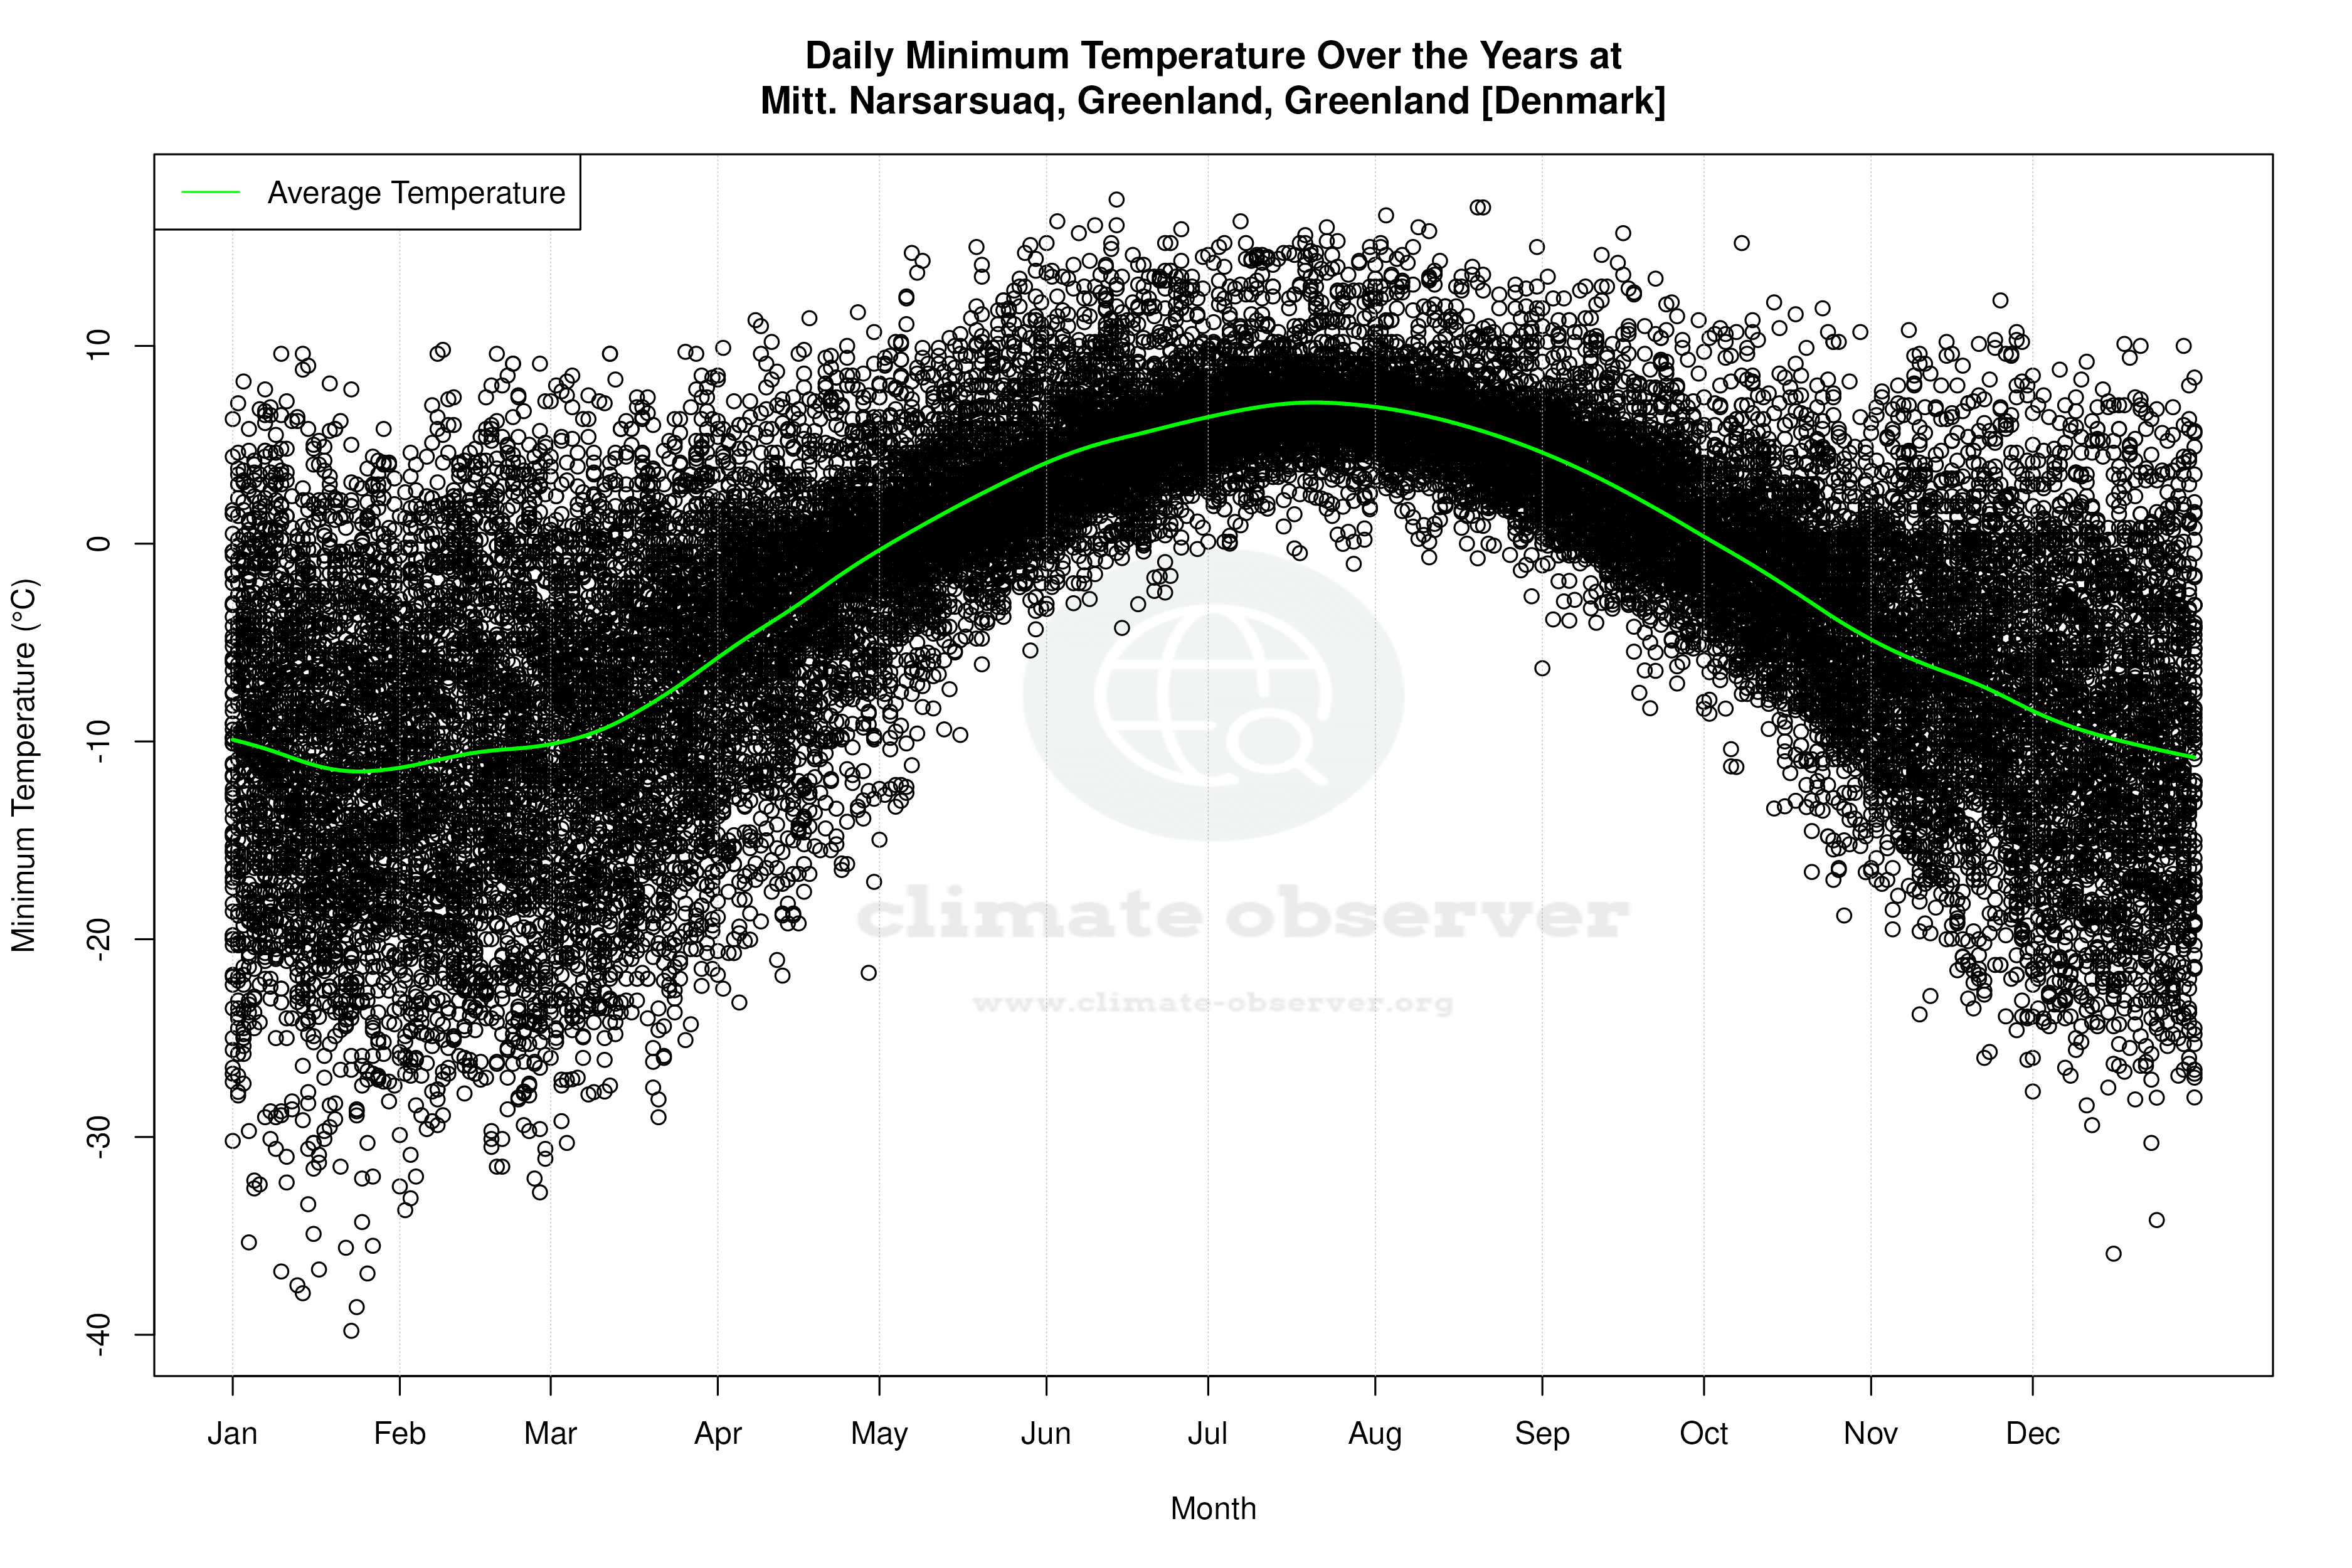

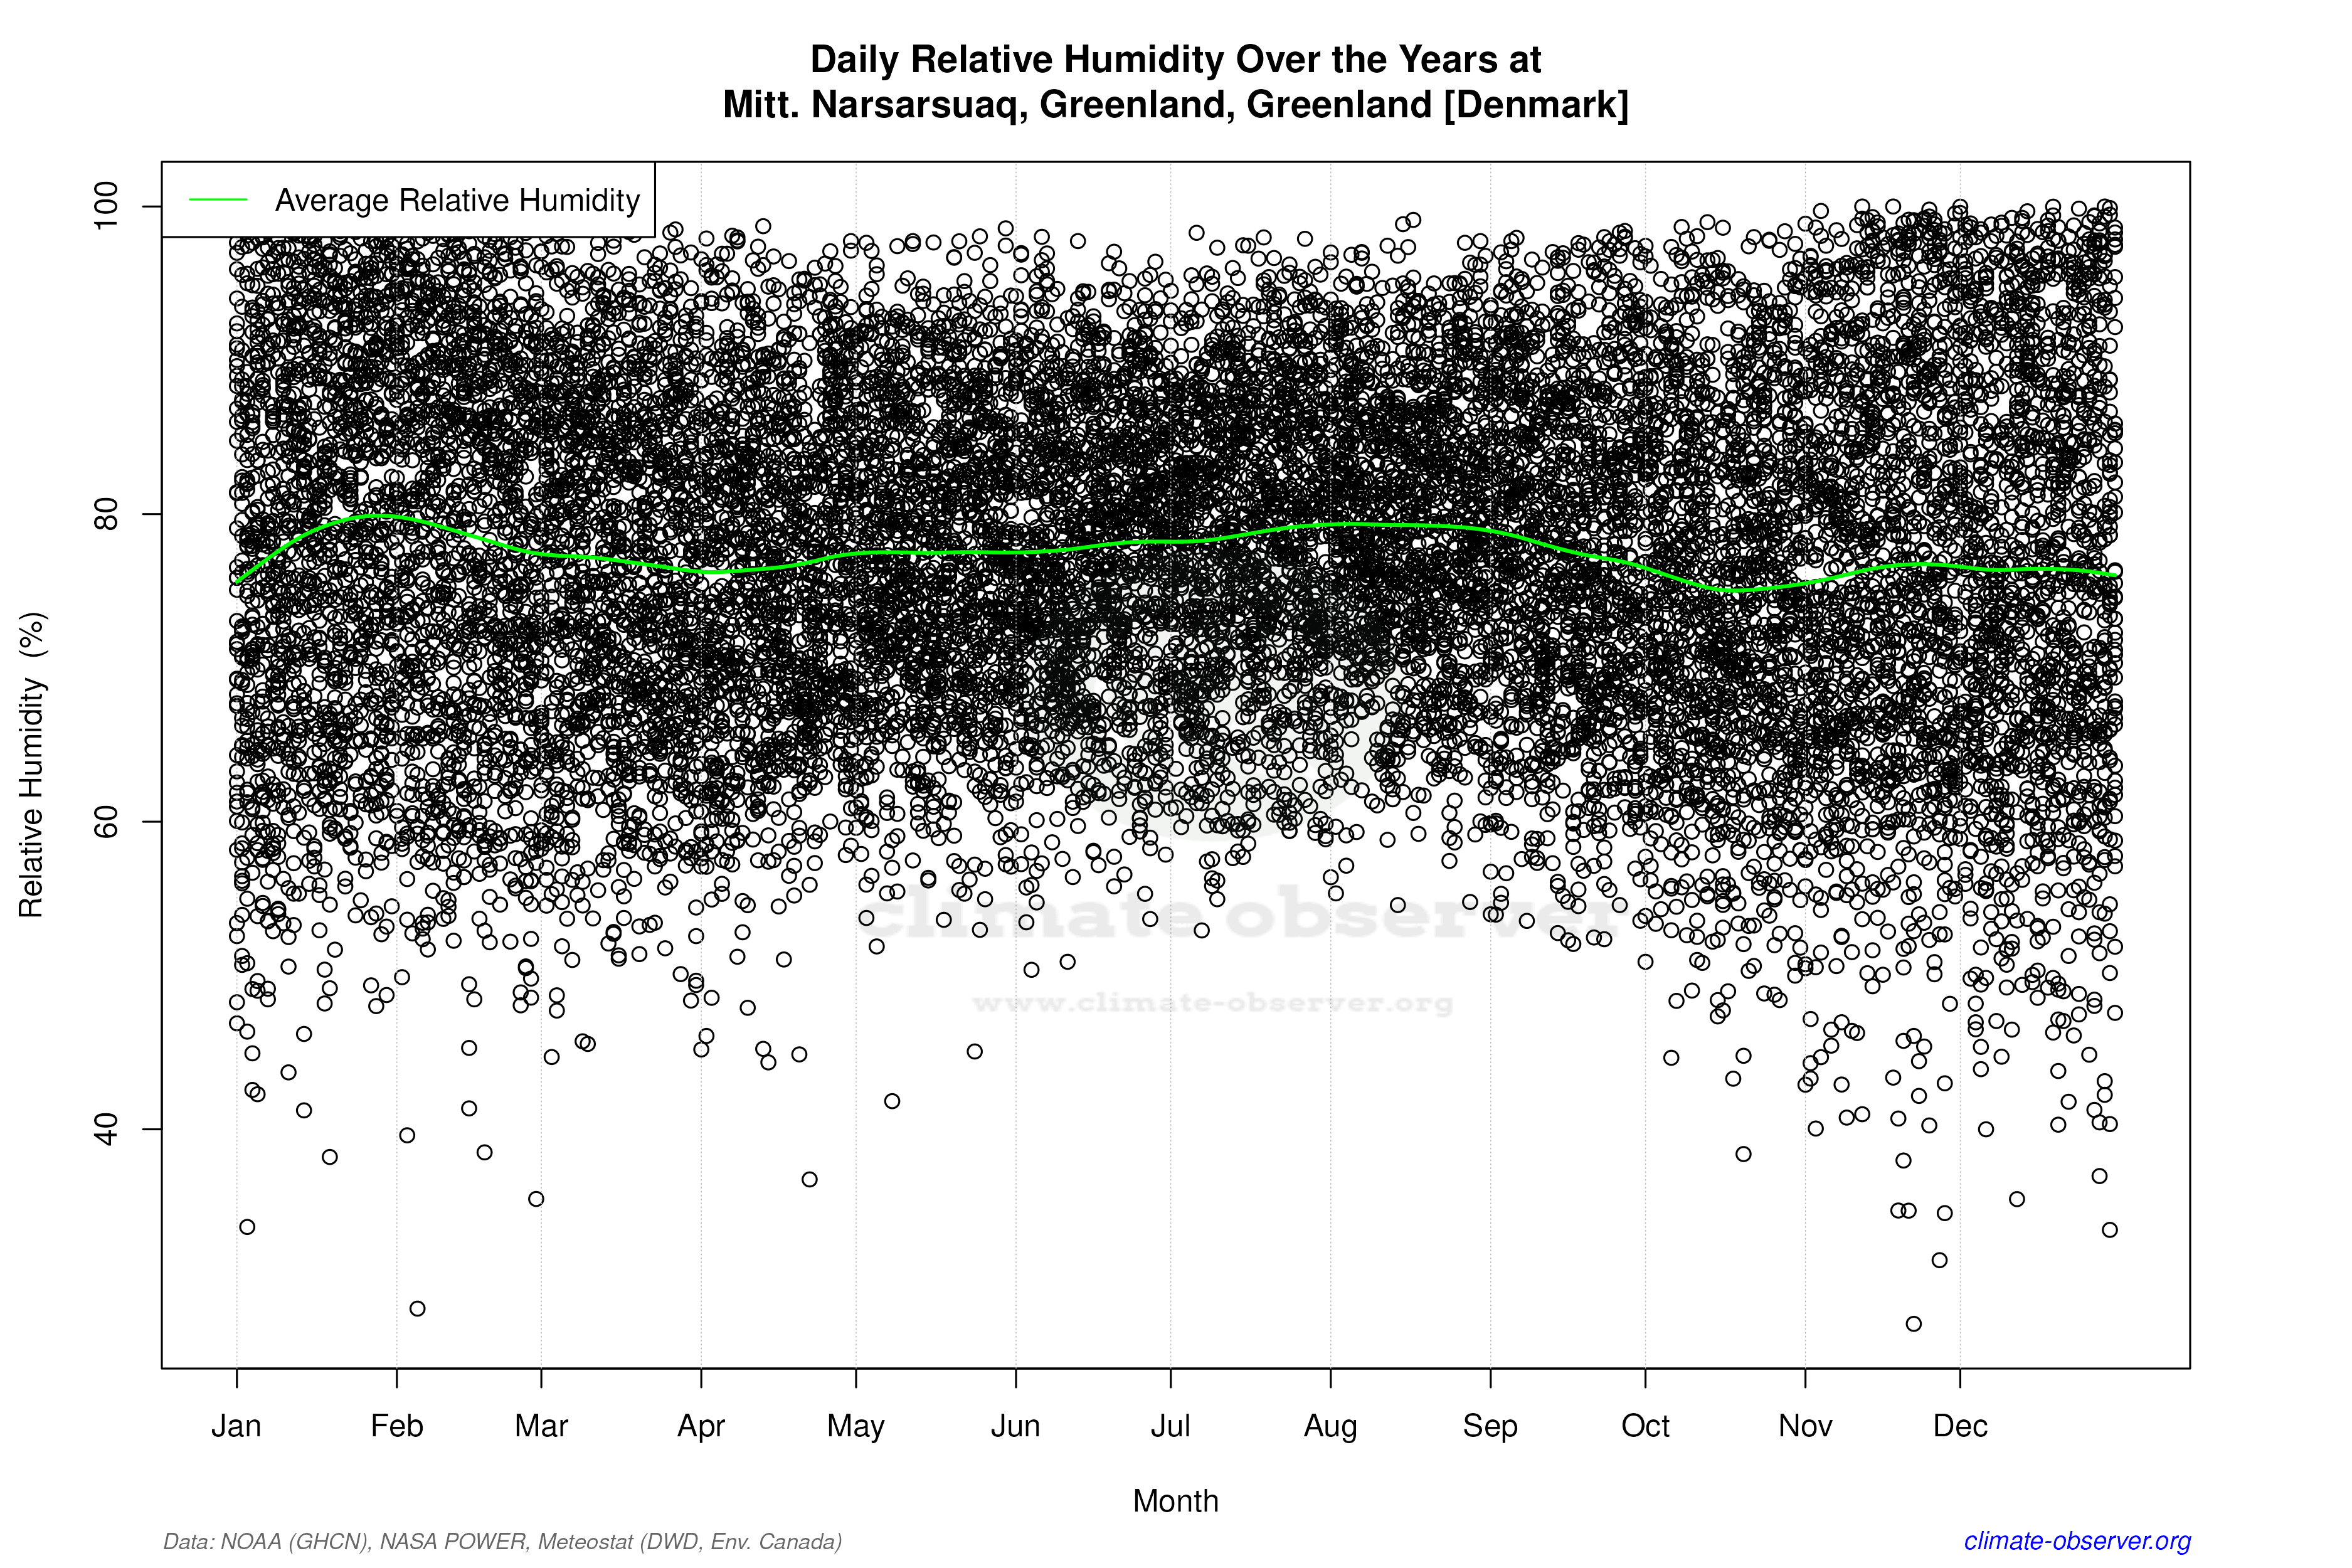

Average Max Temperature Throughout Year | 1 of 5
