Climate for Station: Altastenberg, North Rhine–Westphalia, Germany
Loading live weather...
Climate Analysis & Overview
Altastenberg's climate is experiencing a noticeable warming trend over the past decade, with both high and low temperatures rising by nearly 0.88°C (1.58°F). Despite this recent increase, the all-time trends indicate a more modest warming. The Precipitation Concentration Index (PCI) has decreased, suggesting a shift towards more evenly distributed rainfall.
Mountainous Climate Dynamics
Altastenberg, located in the Hochsauerland region of North Rhine-Westphalia, is characterised by its mountainous terrain, contributing to its Dfb Köppen climate classification—humid continental with warm summers and cold winters. The elevation and topography play a significant role in shaping local weather patterns, often resulting in cooler temperatures compared to surrounding lowlands.
Warming Trends and Temperature Records
The past decade has seen a warming trend, with high and low temperatures both increasing by approximately 0.88°C (1.58°F). This recent rise is more pronounced than the all-time trends, which show a modest warming of 0.06°C (0.11°F) for highs and 0.12°C (0.22°F) for lows. These changes suggest a shift in the local climate, potentially impacting local ecosystems and winter sports tourism. The recorded temperature extremes in Altastenberg include a maximum of 31.9°C (89.4°F) and a minimum of -26.0°C (-14.8°F), illustrating the region's significant thermal variability.
Precipitation Patterns: A Shift Towards Even Distribution
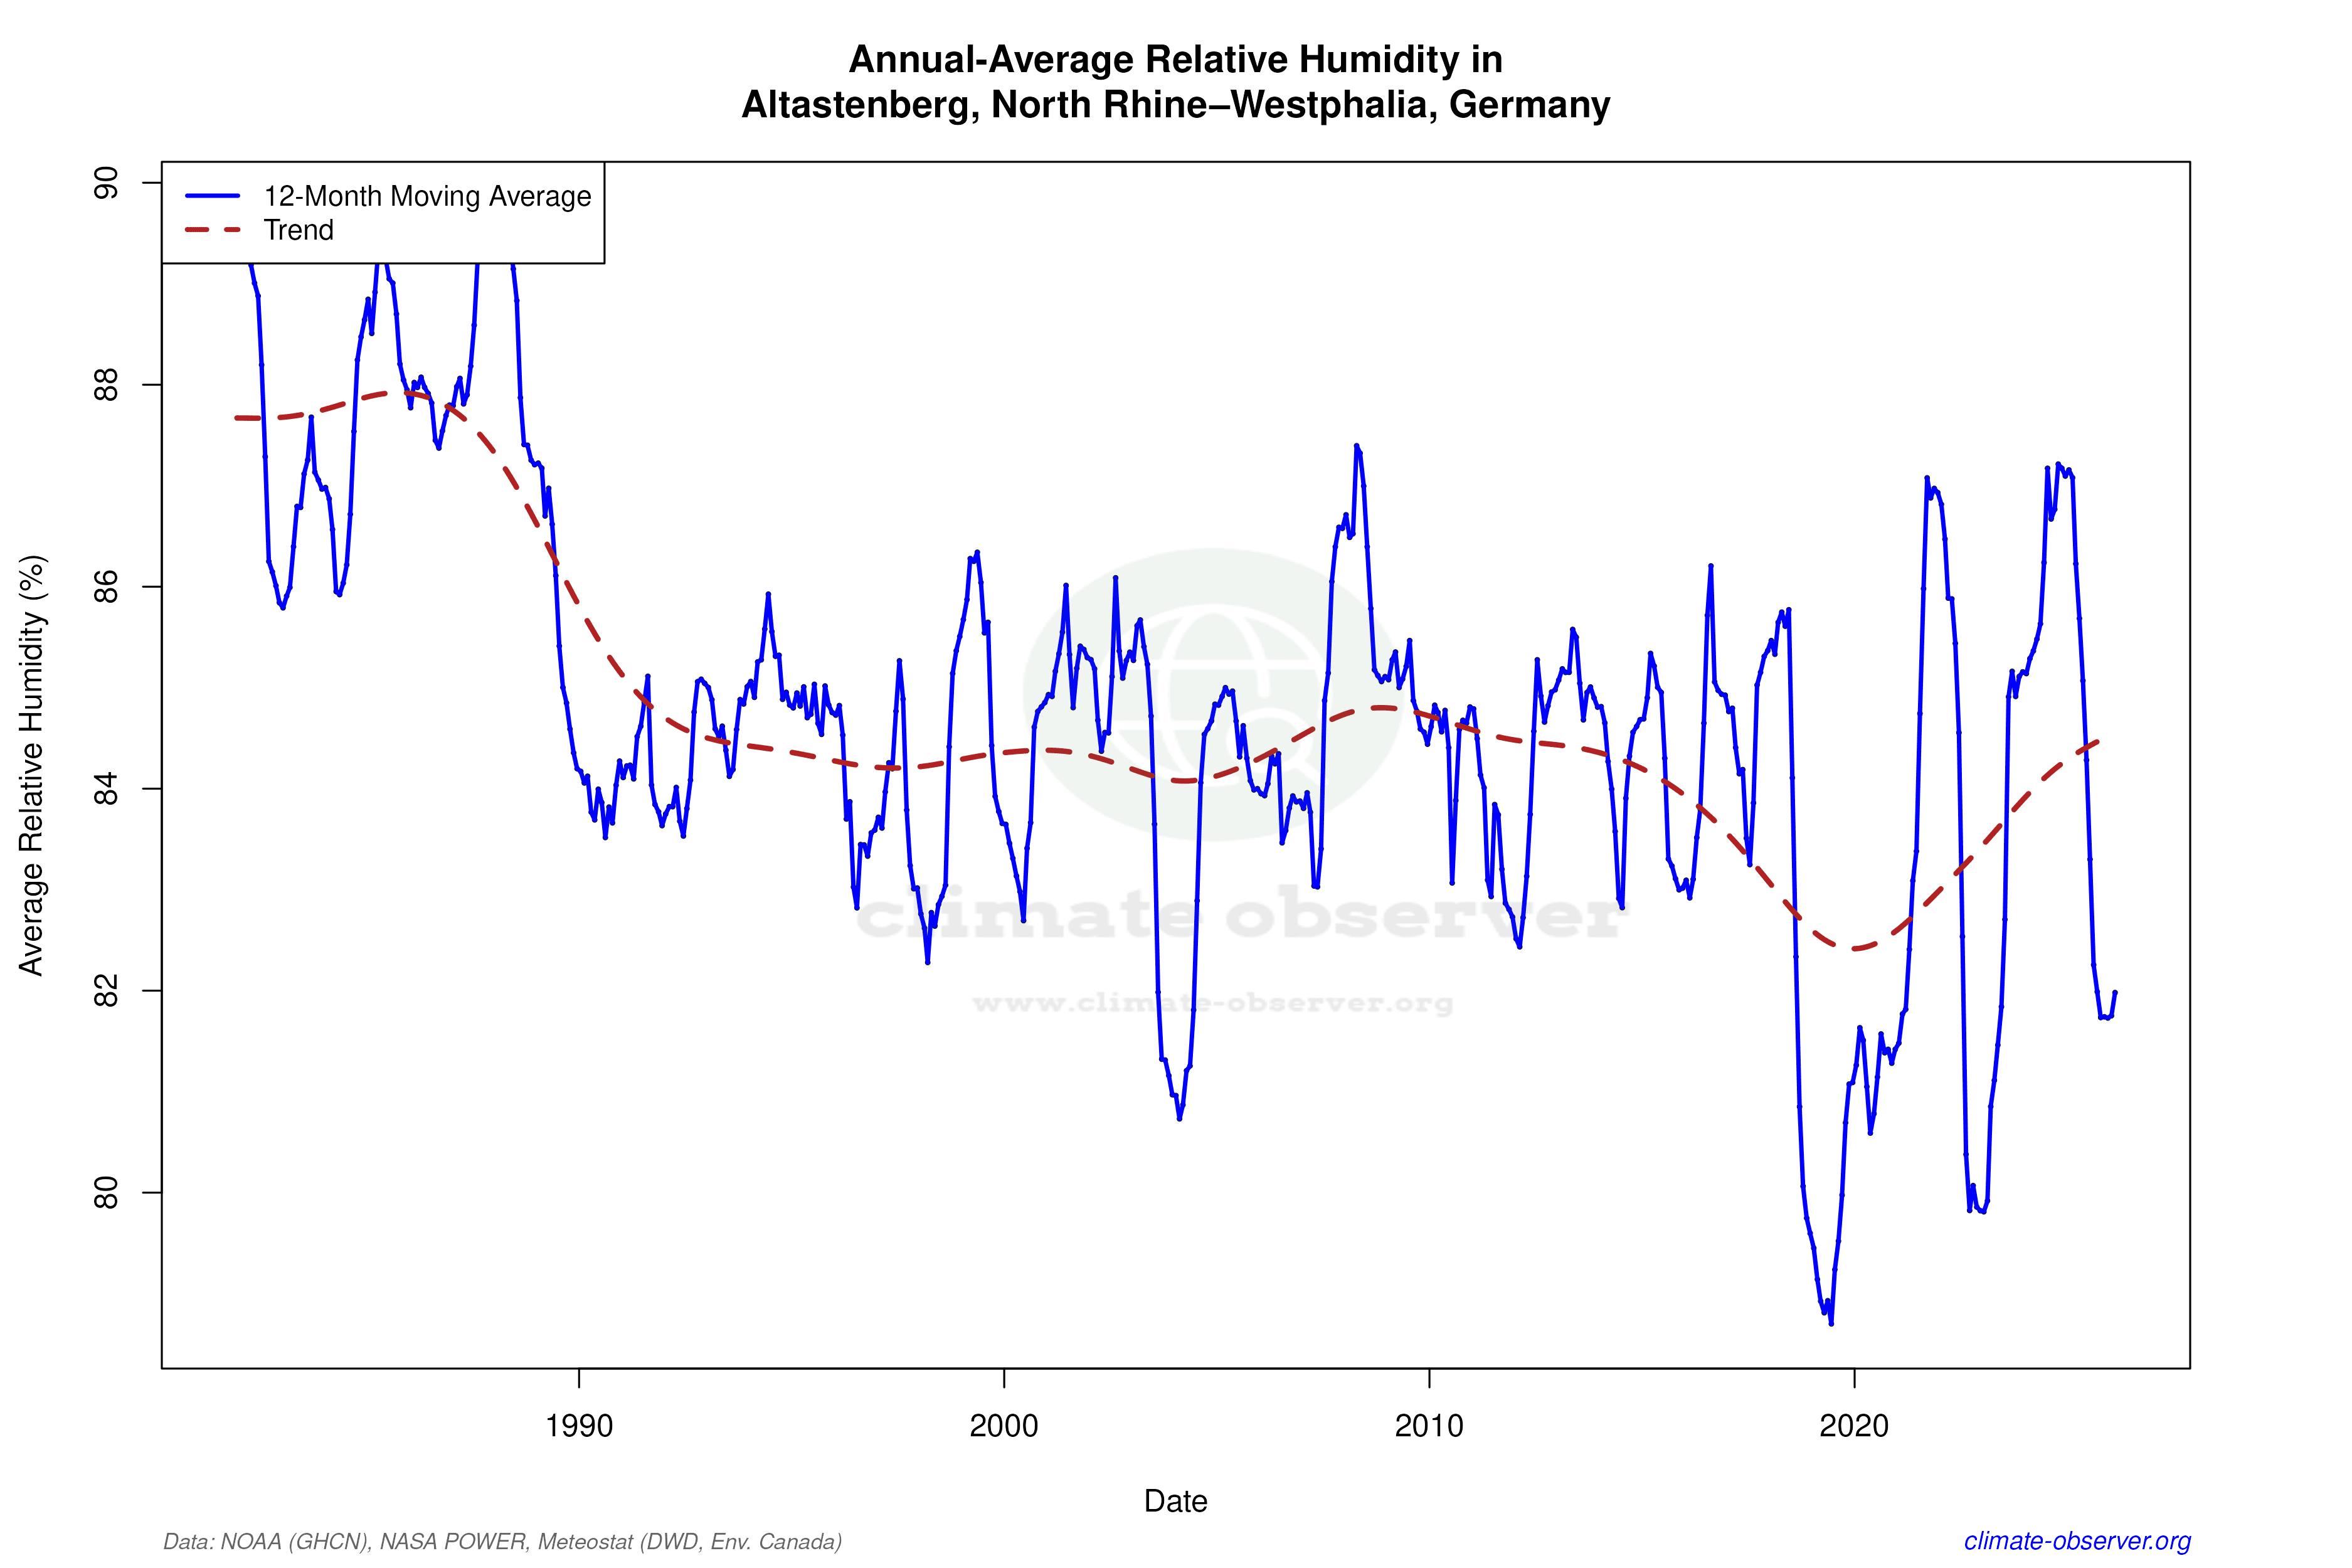
The Precipitation Concentration Index (PCI) has decreased from a baseline of 10.75 to a current value of 9.25. This change indicates a more even distribution of rainfall events throughout the year. A lower PCI suggests that precipitation is less concentrated in intense events, which could reduce the risk of flooding and soil erosion, benefiting agriculture and water management in the region.
Contextualising the Climate Data
These climatic shifts occur within the broader context of Germany's commitment to reducing greenhouse gas emissions and adapting to climate change. The observed warming trends in Altastenberg align with national and global patterns, highlighting the importance of localised climate monitoring. Recent weather events, such as heatwaves and heavy rainfall, underscore the need for adaptive strategies to mitigate potential impacts on infrastructure and natural resources.
Implications for Regional Climate Goals
Germany's regional climate goals focus on sustainability and resilience. The warming trends and changes in precipitation patterns in Altastenberg offer insights into the challenges and opportunities for achieving these objectives. By understanding local climate dynamics, policymakers can better plan for future scenarios, ensuring that the region remains vibrant and resilient in the face of climate change.
Station Statistics
10-Year Trend
High: +1.61 °F/decade
Low: +1.49 °F/decade
Rain: +0.022 in/decade
25-Year Trend
High: +1.16 °F/decade
Low: +1.14 °F/decade
Rain: -0.014 in/decade
50-Year Trend
High: +0.78 °F/decade
Low: +0.84 °F/decade
Rain: -0.015 in/decade
All-Time Trend
High: +0.12 °F/decade
Low: +0.22 °F/decade
Rain: +0.001 in/decade
Percentage Above-Average Days
Last 12 Months: 59.7%
This Year: 70.5%
Precipitation Concentration Index (PCI) ℹ️
Last 12 Months: 10.3
Historical Average: 10.7
Percentile Rank of Last 12 Months ℹ️
High: 95th percentile
Low: 96th percentile
Rain: 4th percentile
Change in Variance ℹ️
High: -3.3%
Low: -7.0%
Intraday: -8.1%
Data Coverage
89.4%
First Year of Data
1887
Station Location
Historical Weather Records
| Max High | Avg High | Min High | Max Avg | Avg Avg | Min Avg | Max Low | Avg Low | Min Low | Max Precipitation | Avg Precipitation | Max Snow | Avg Snow | |
|---|---|---|---|---|---|---|---|---|---|---|---|---|---|
| Record | 89.42 °F | — | -4.72 °F | 82.58 °F | — | -10.12 °F | 75.74 °F | — | -14.80 °F | 4.19 in | — | — | — |
| January | 55.76 °F | 31.45 °F | -3.28 °F | 49.82 °F | 27.55 °F | -5.08 °F | 44.78 °F | 23.80 °F | -11.38 °F | 4.19 in | 0.16 in | — | — |
| February | 61.88 °F | 32.56 °F | -4.72 °F | 52.52 °F | 28.29 °F | -10.12 °F | 48.56 °F | 24.06 °F | -14.80 °F | 2.57 in | 0.13 in | — | — |
| March | 69.44 °F | 38.78 °F | 11.12 °F | 55.94 °F | 33.70 °F | 7.16 °F | 53.24 °F | 28.37 °F | 2.12 °F | 1.98 in | 0.12 in | — | — |
| April | 76.10 °F | 46.75 °F | 22.28 °F | 65.84 °F | 40.47 °F | 16.70 °F | 58.10 °F | 33.77 °F | 9.32 °F | 2.31 in | 0.11 in | — | — |
| May | 87.08 °F | 55.87 °F | 31.64 °F | 72.32 °F | 48.49 °F | 15.80 °F | 64.58 °F | 41.23 °F | 18.68 °F | 2.07 in | 0.11 in | — | — |
| June | 86.18 °F | 61.20 °F | 39.74 °F | 76.28 °F | 54.25 °F | 35.24 °F | 68.36 °F | 46.49 °F | 29.48 °F | 2.60 in | 0.13 in | — | — |
| July | 89.42 °F | 63.98 °F | 41.72 °F | 82.58 °F | 57.20 °F | 39.02 °F | 75.74 °F | 49.94 °F | 36.14 °F | 3.20 in | 0.15 in | — | — |
| August | 88.34 °F | 63.33 °F | 42.98 °F | 78.26 °F | 57.01 °F | 40.28 °F | 73.22 °F | 49.90 °F | 35.78 °F | 2.09 in | 0.13 in | — | — |
| September | 85.46 °F | 57.27 °F | 37.40 °F | 71.96 °F | 51.30 °F | 33.44 °F | 68.36 °F | 45.47 °F | 26.78 °F | 2.06 in | 0.12 in | — | — |
| October | 73.76 °F | 48.31 °F | 26.24 °F | 63.86 °F | 43.68 °F | 21.56 °F | 57.92 °F | 38.70 °F | 16.70 °F | 3.17 in | 0.13 in | — | — |
| November | 65.12 °F | 38.42 °F | 9.32 °F | 56.48 °F | 35.06 °F | 14.54 °F | 51.98 °F | 30.94 °F | 1.04 °F | 3.41 in | 0.14 in | — | — |
| December | 55.04 °F | 33.27 °F | -0.04 °F | 52.34 °F | 29.67 °F | -3.46 °F | 47.12 °F | 25.91 °F | -5.62 °F | 2.67 in | 0.16 in | — | — |
Data Visualisations
Remove WatermarksCurrent Year Climate Trends vs Historical


Max Temperature this Year | 1 of 6
Climate 12-Month Moving Averages


Max Temperature 12-Month MA | 1 of 6
Daily Data Points and Averages Throughout the Year


Average Max Temperature Throughout Year | 1 of 5
