Climate for Station: Freiburg, Baden-Wurttemberg, Germany
Loading live weather...
Climate Analysis & Overview
Freiburg's climate is experiencing a noticeable warming trend, with a significant increase in both high and low temperatures over the past decade. Precipitation patterns have become more evenly distributed, suggesting shifts in local weather dynamics. These changes align with broader regional climate goals aimed at understanding and mitigating climate impacts.
Warming Trends in Freiburg
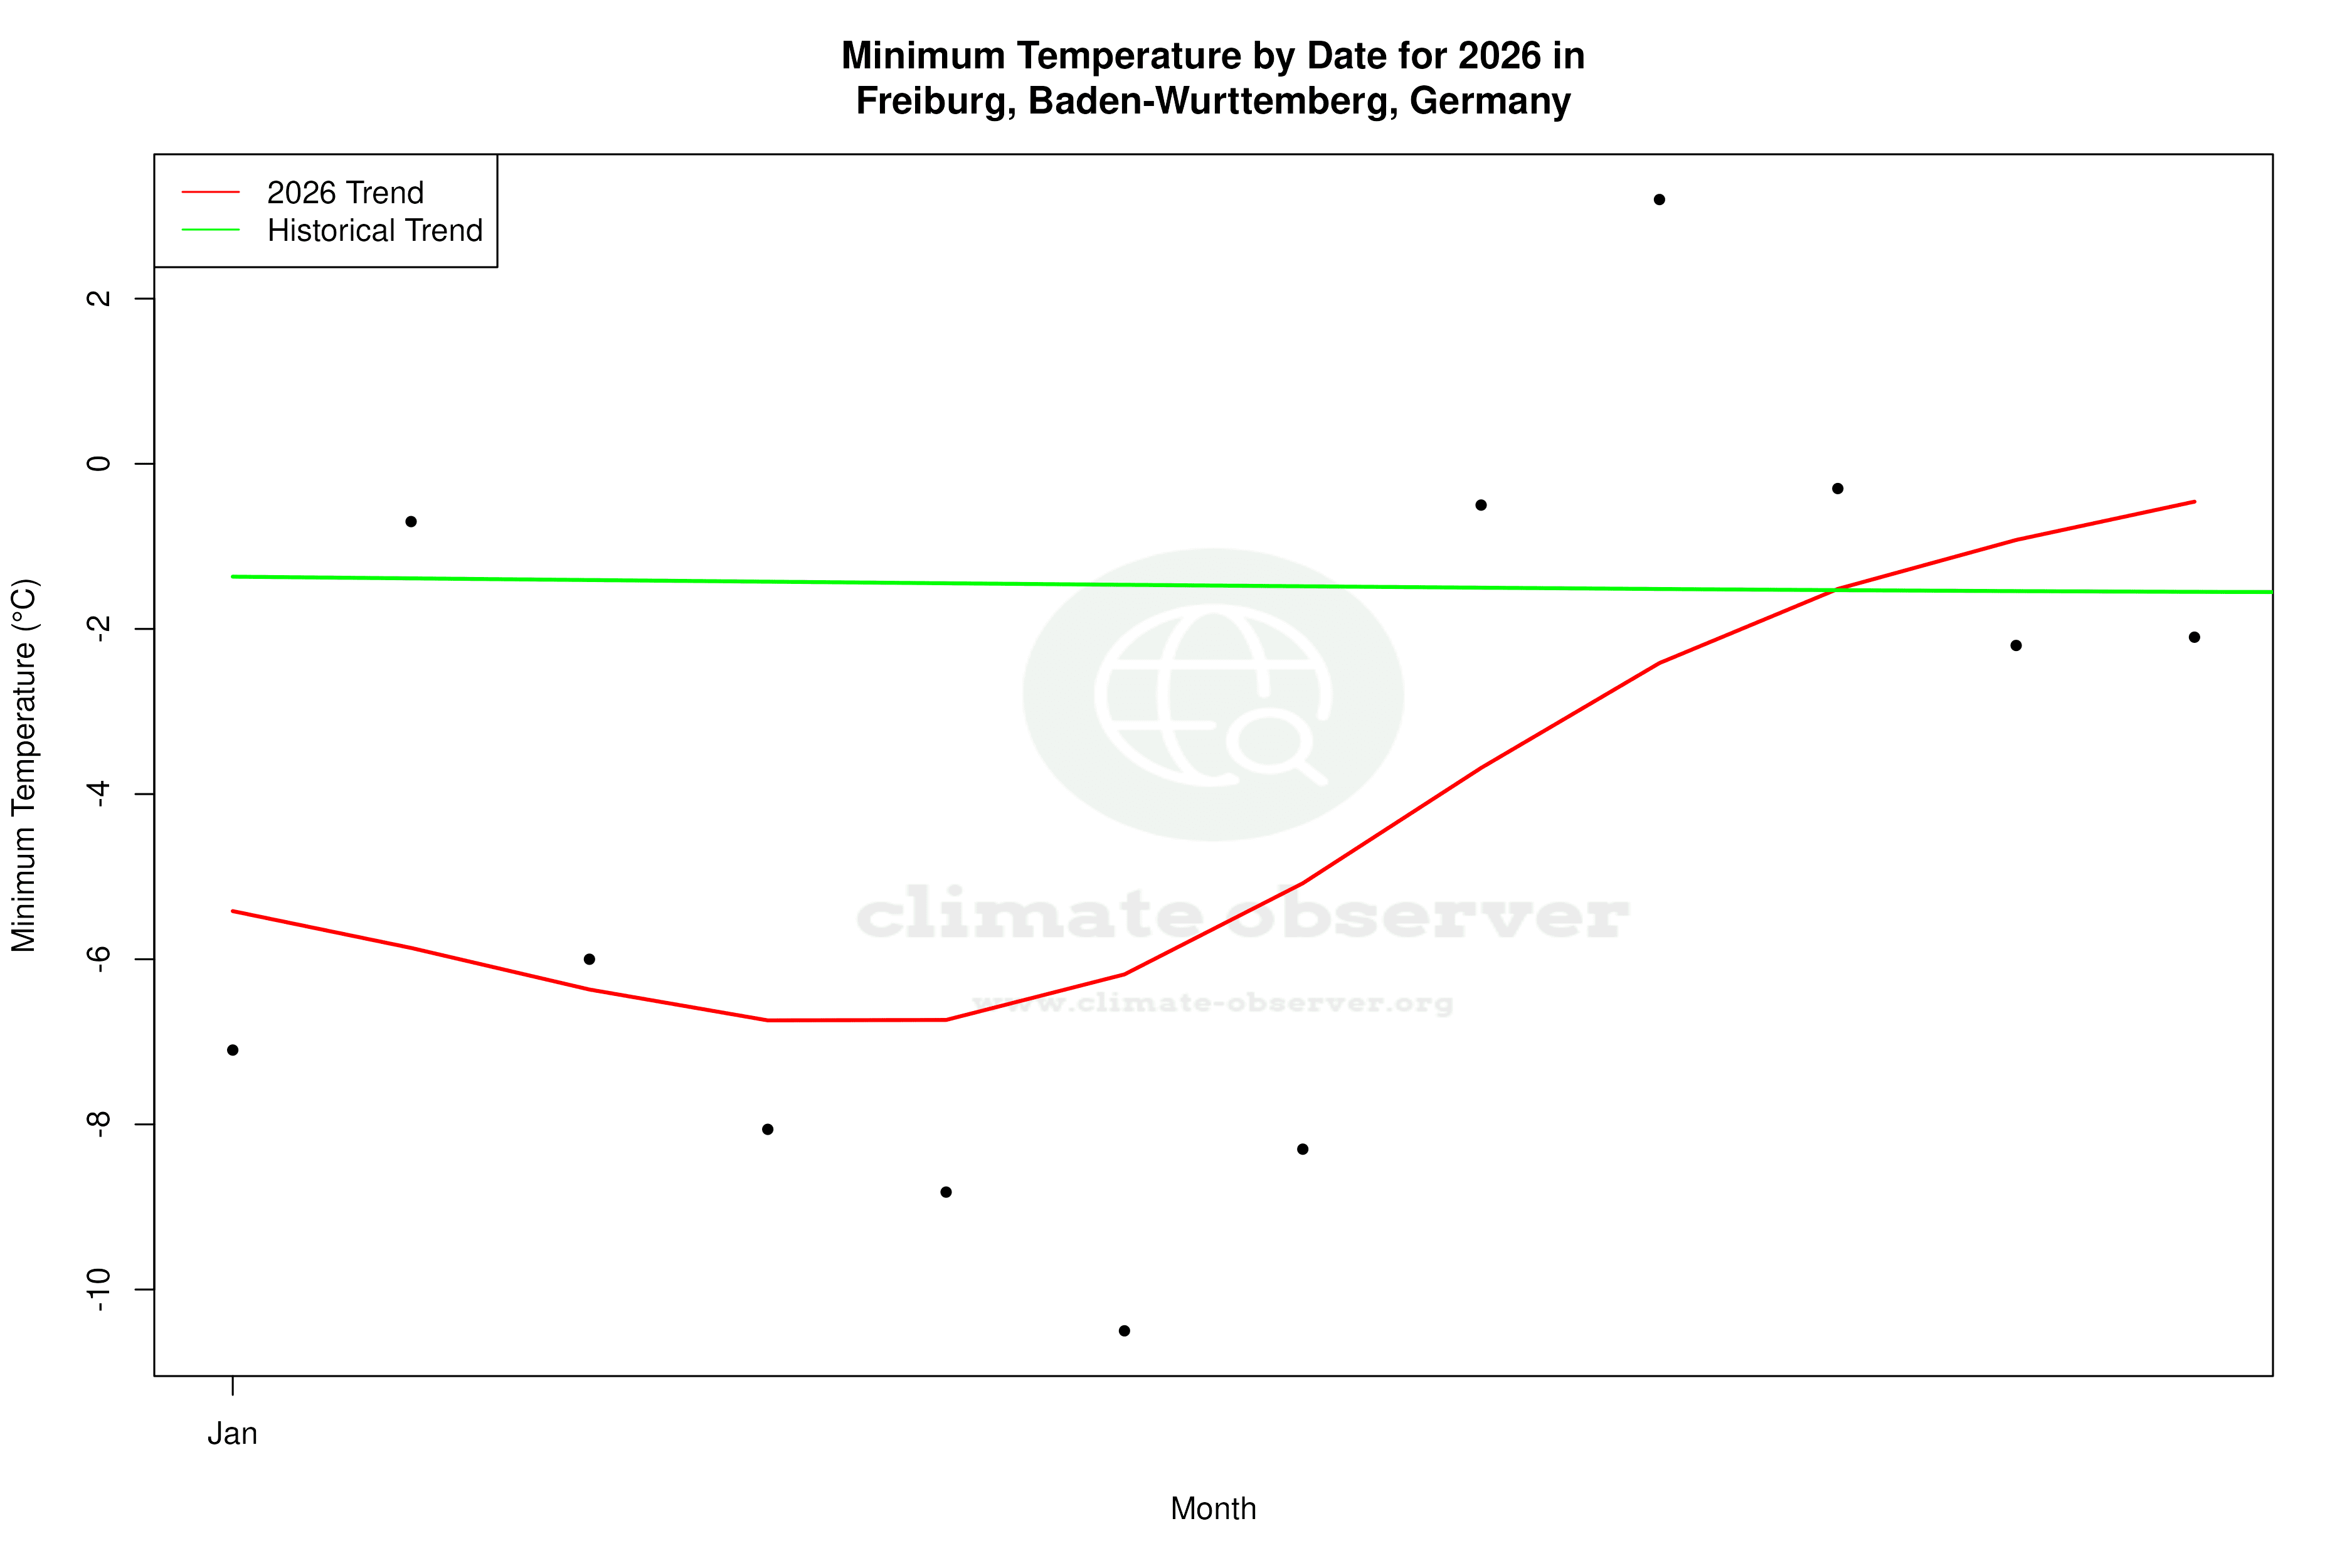
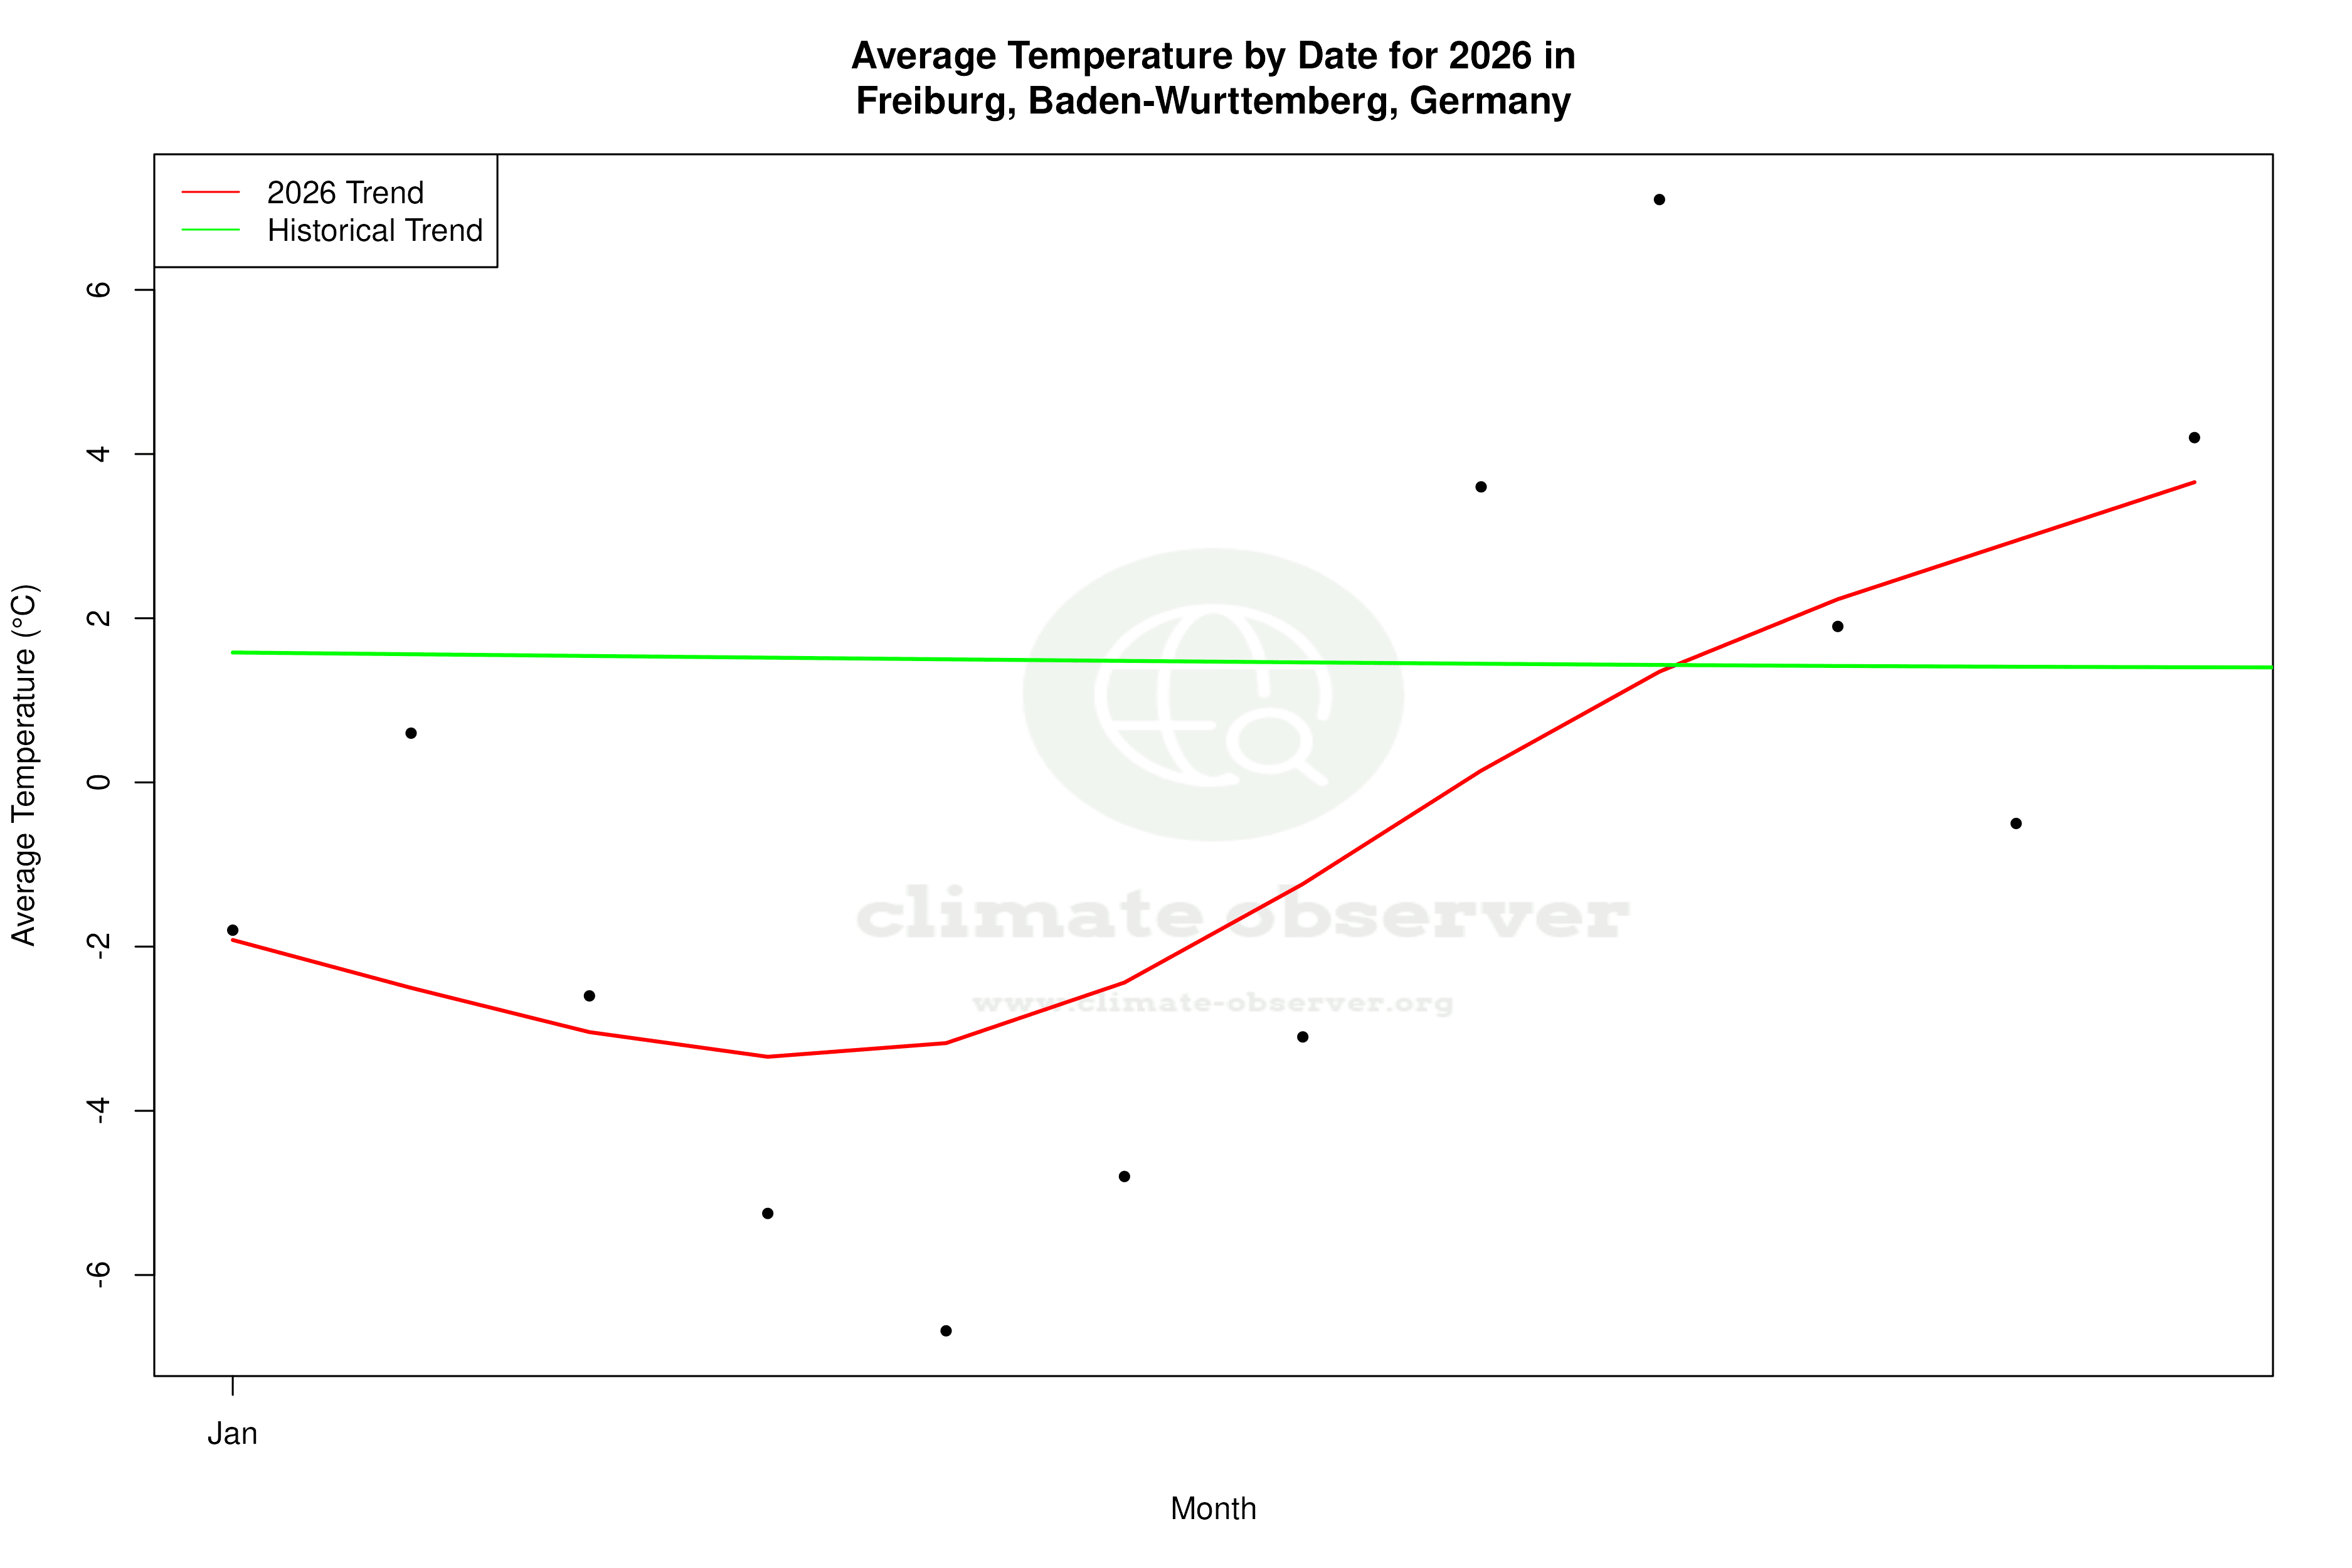
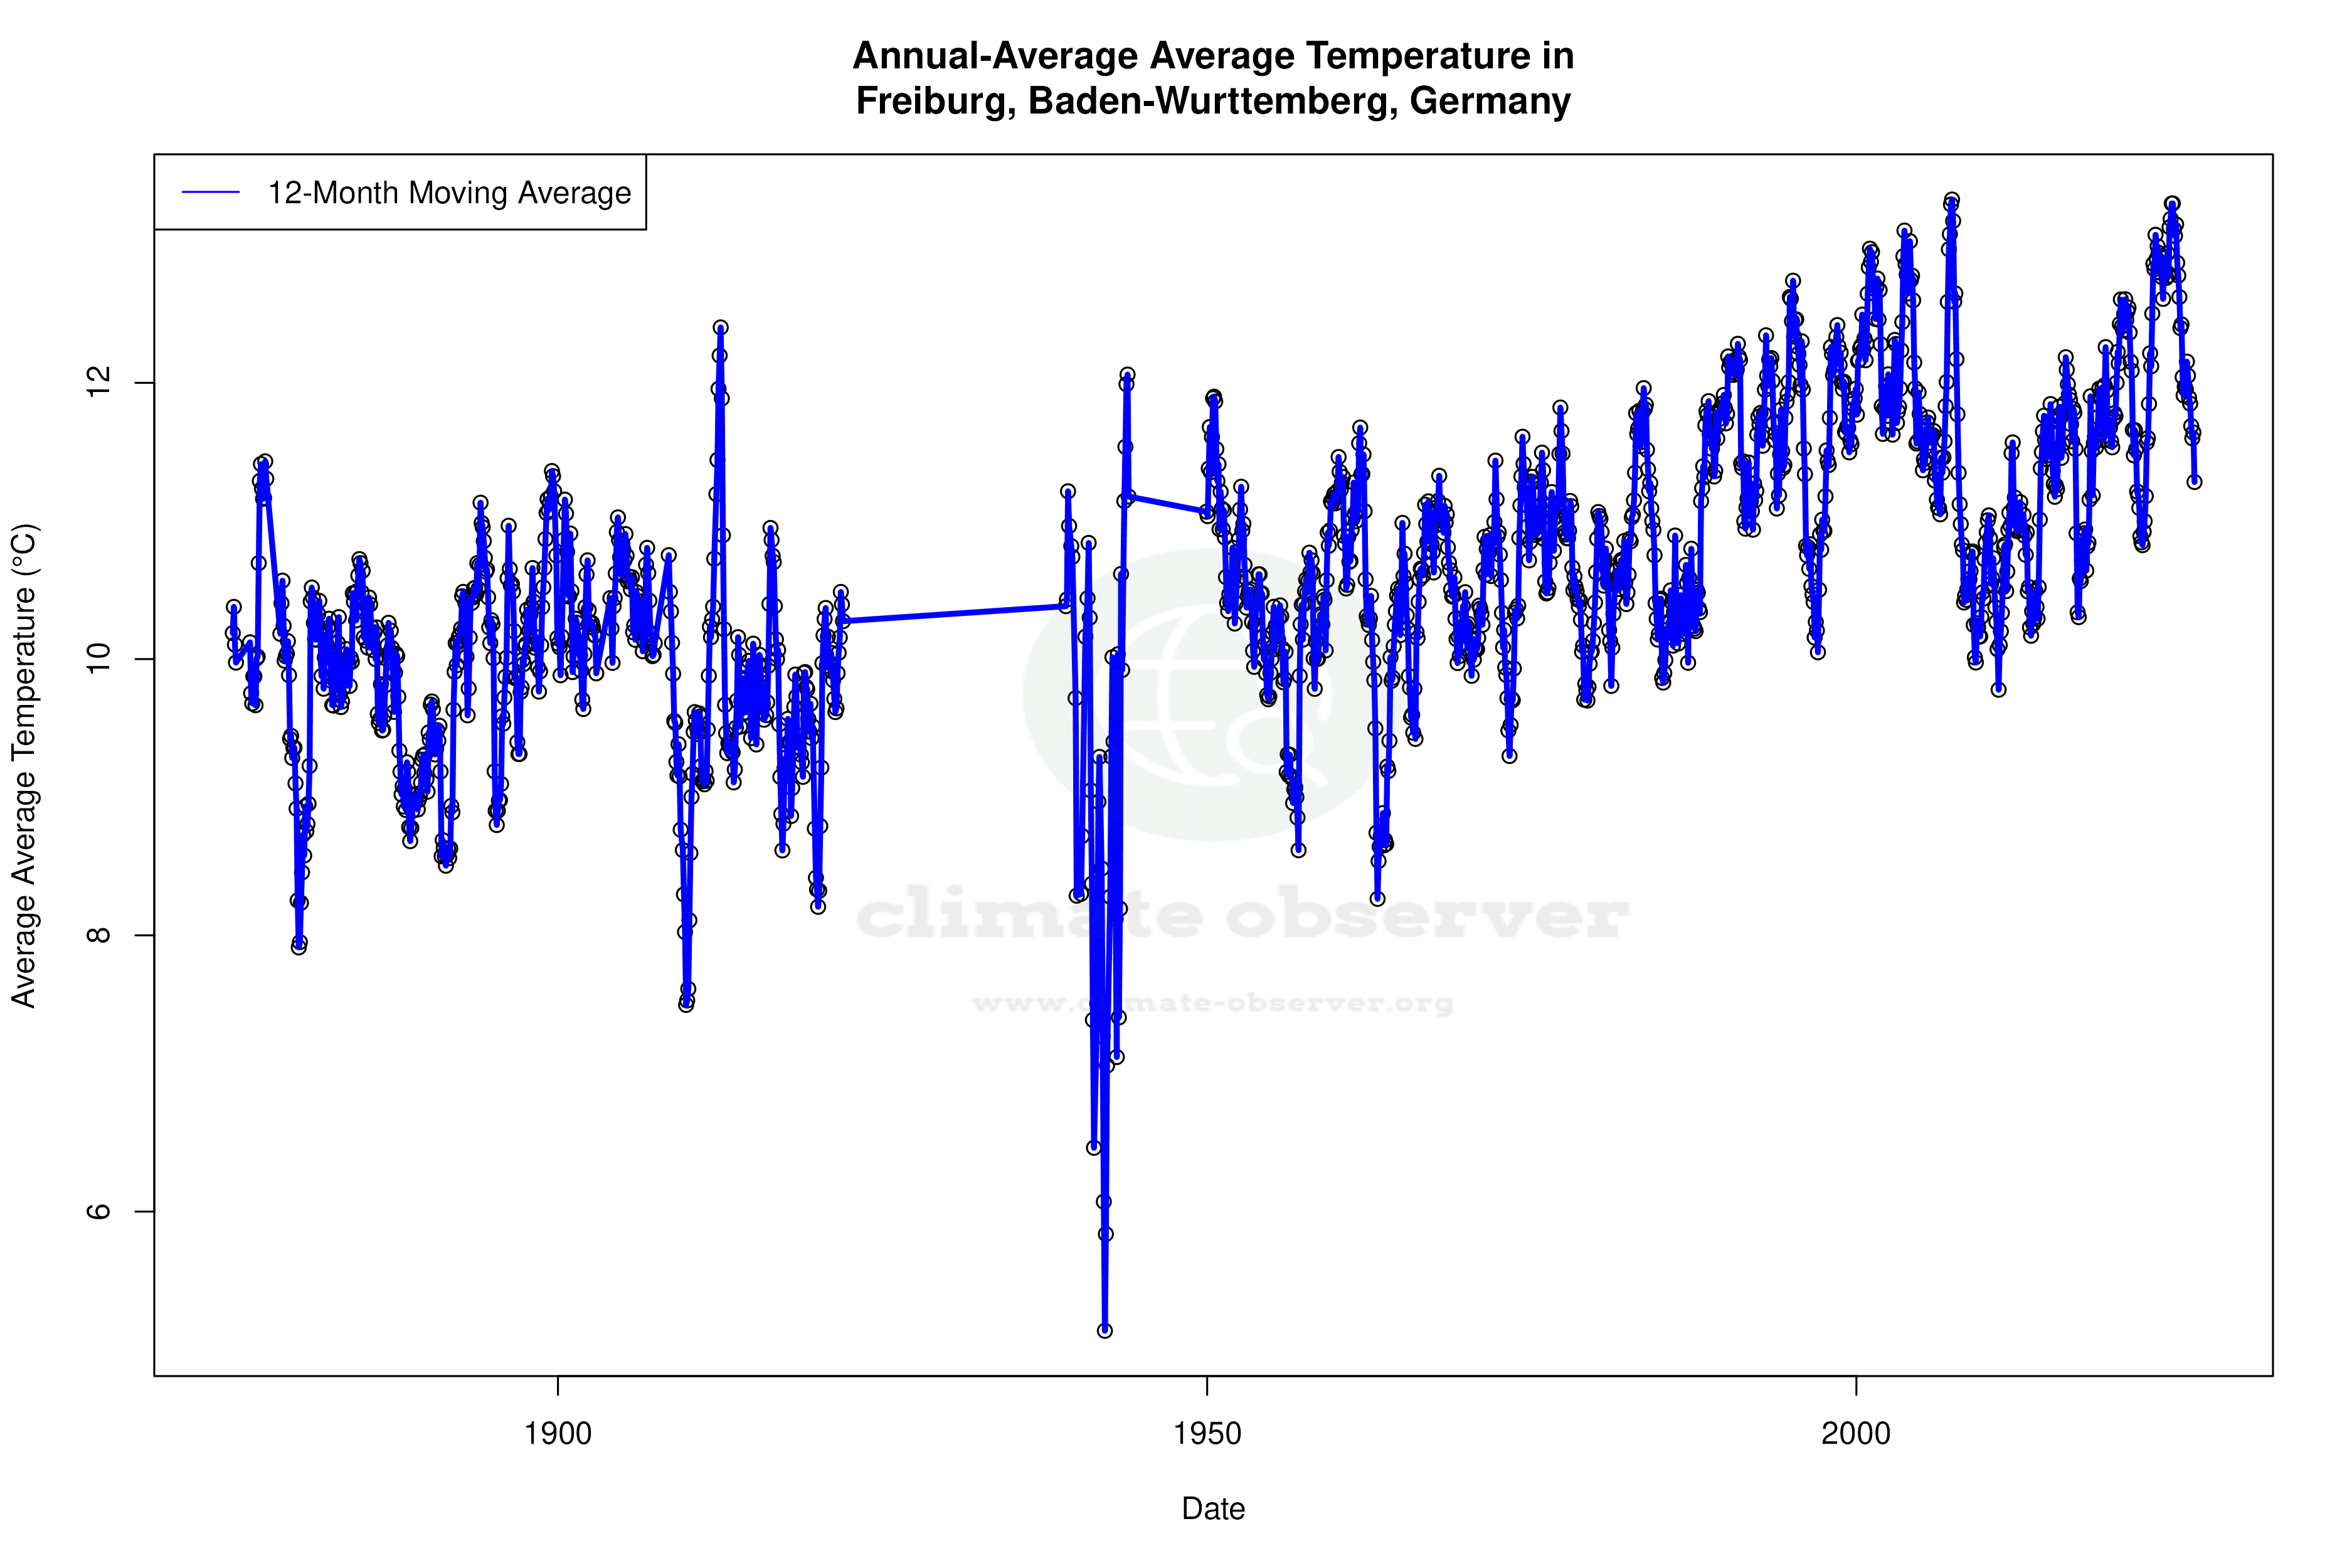
Freiburg, located in the southwestern part of Germany, is classified under the Köppen climate classification as Cfb, indicating a temperate oceanic climate. This region is influenced by its proximity to the Black Forest, which moderates temperatures and affects precipitation patterns. Over the past ten years, Freiburg has experienced a notable warming trend, with high temperatures increasing by 0.89°C (1.60°F) and low temperatures rising by 1.69°C (3.04°F). These changes are more pronounced than the all-time trends, which show a more modest warming of 0.20°C (0.36°F) for highs and 0.11°C (0.20°F) for lows. This suggests that recent years have seen accelerated warming, a crucial point for regional climate policy.
Precipitation Patterns: A Shift Towards Even Distribution
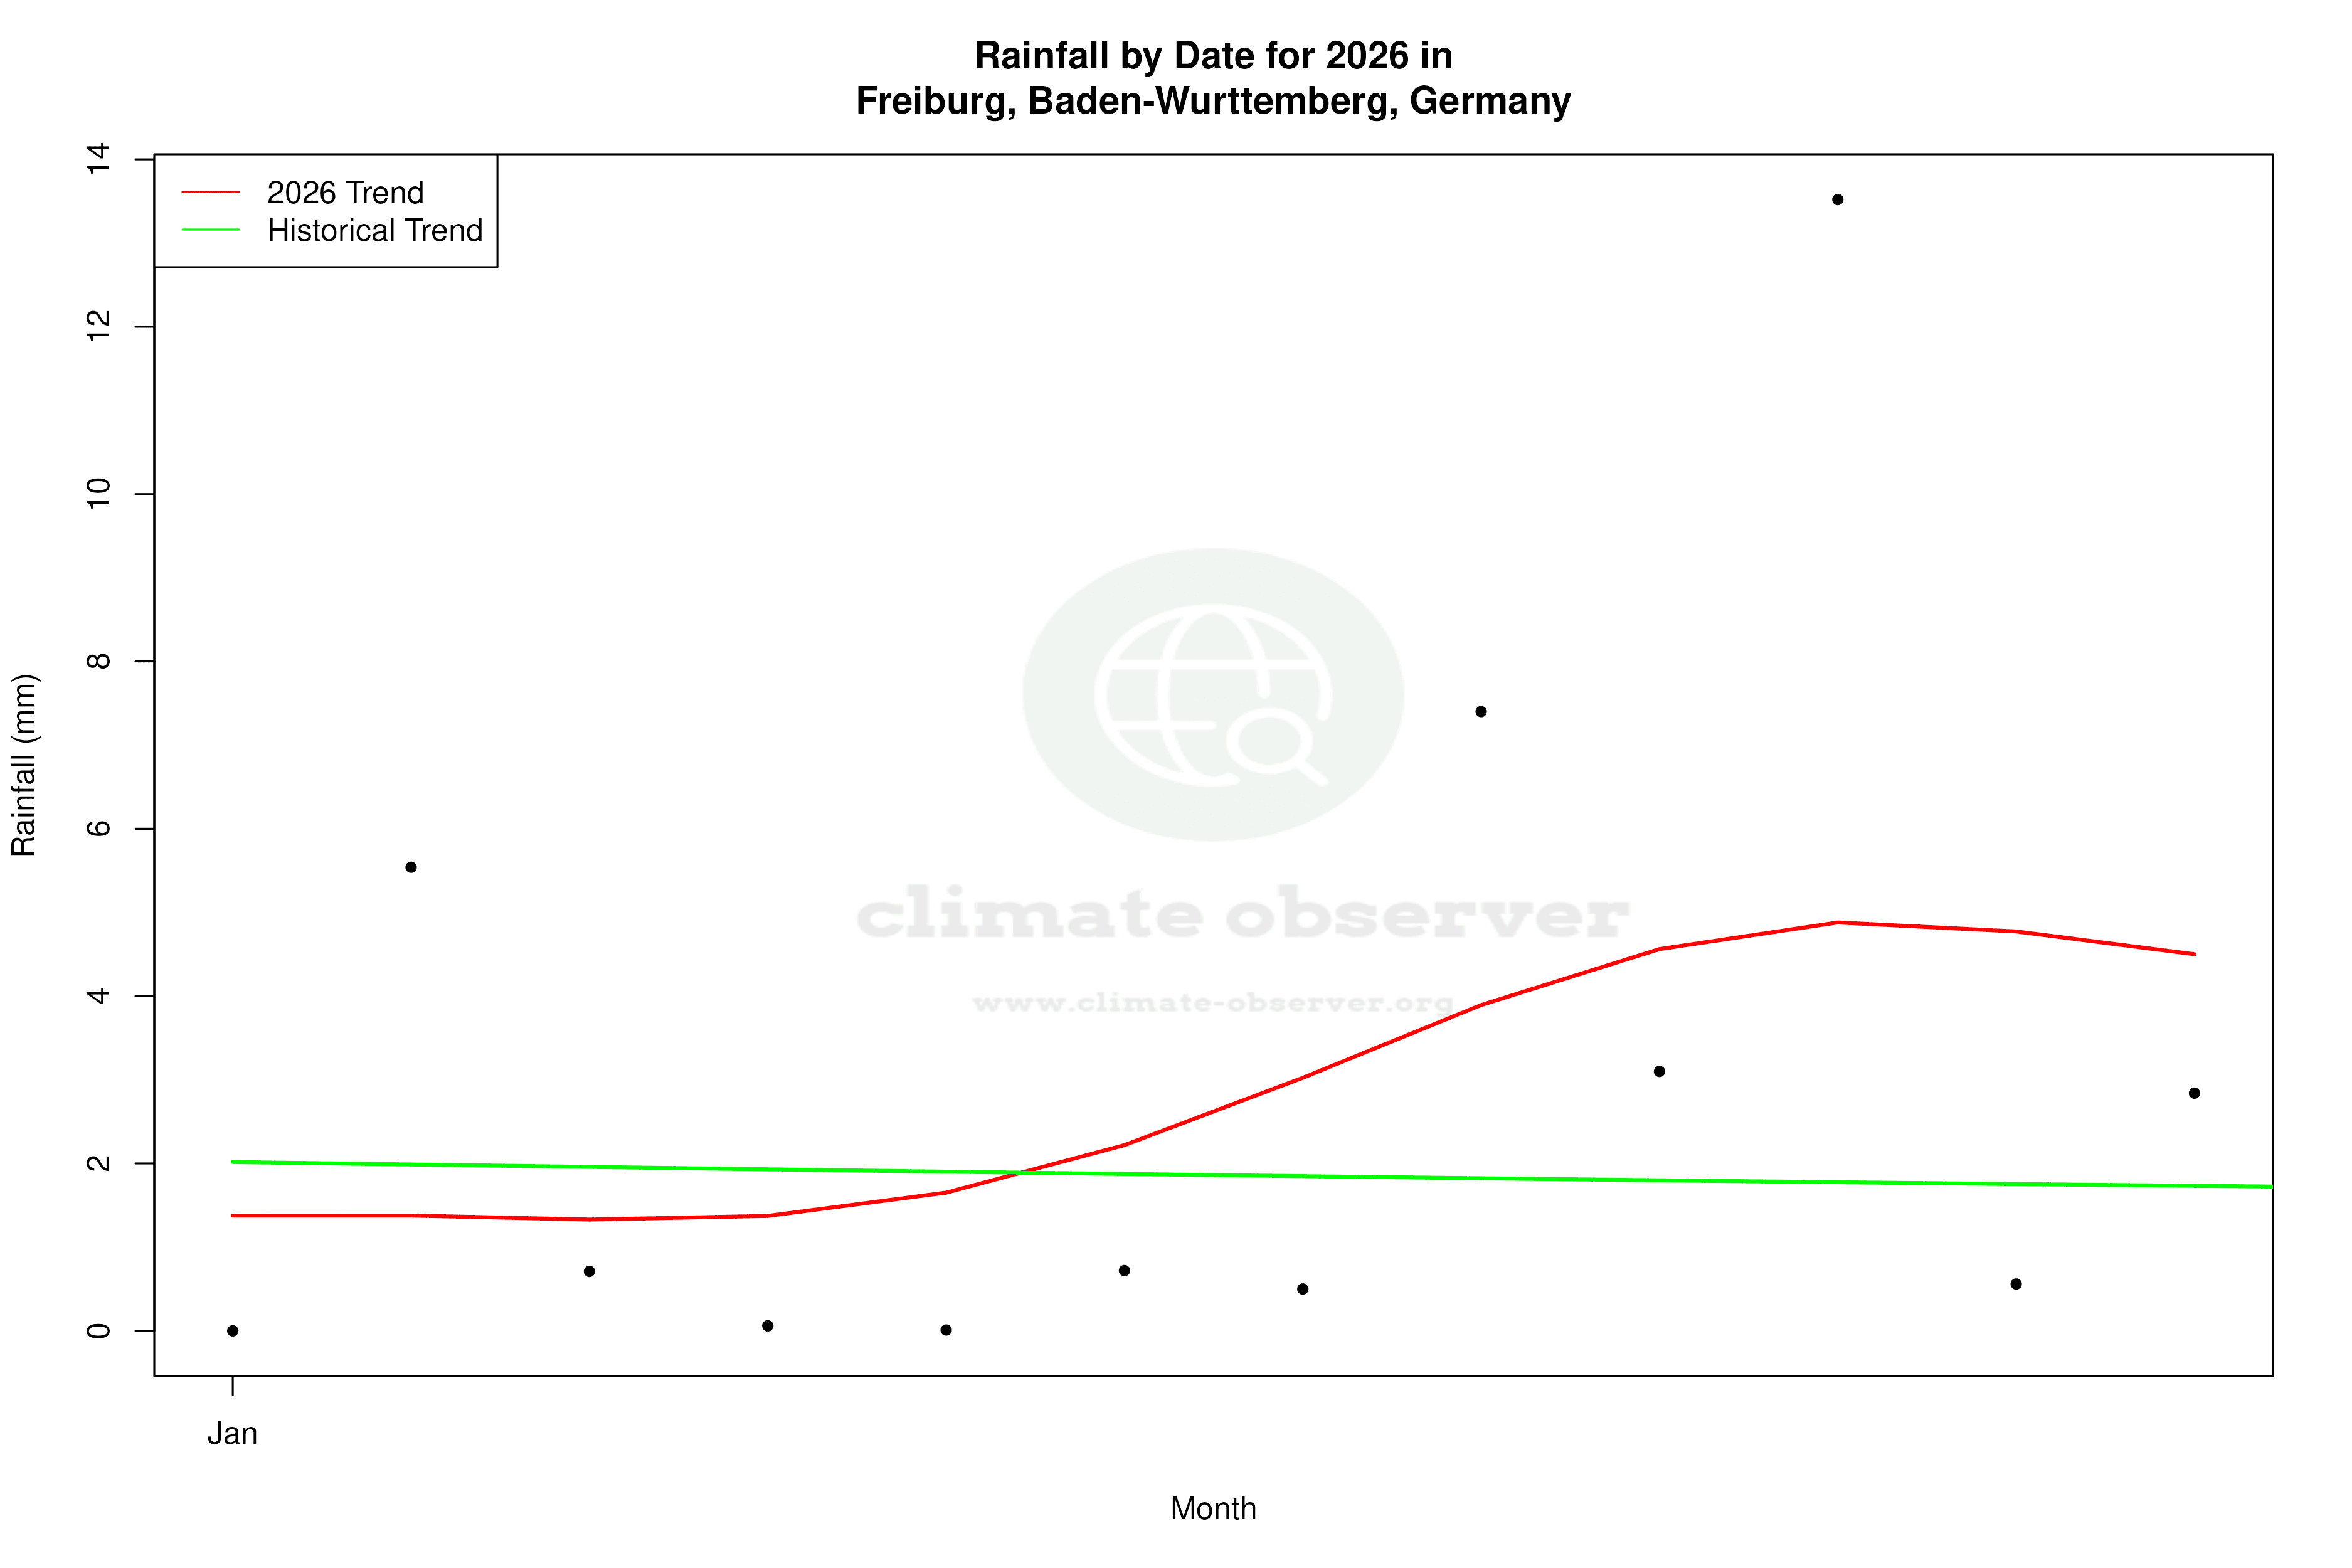
The Precipitation Concentration Index (PCI) is a metric used to assess how rainfall is distributed over time. A decrease in PCI indicates a more even distribution of precipitation events. Freiburg's PCI has decreased from a baseline of 10.85 to a current value of 9.72, reflecting this trend. This marginal change suggests that rainfall is becoming more evenly spread throughout the year, potentially reducing the risk of extreme weather events such as floods or droughts.
Temperature Extremes: A Historical Perspective
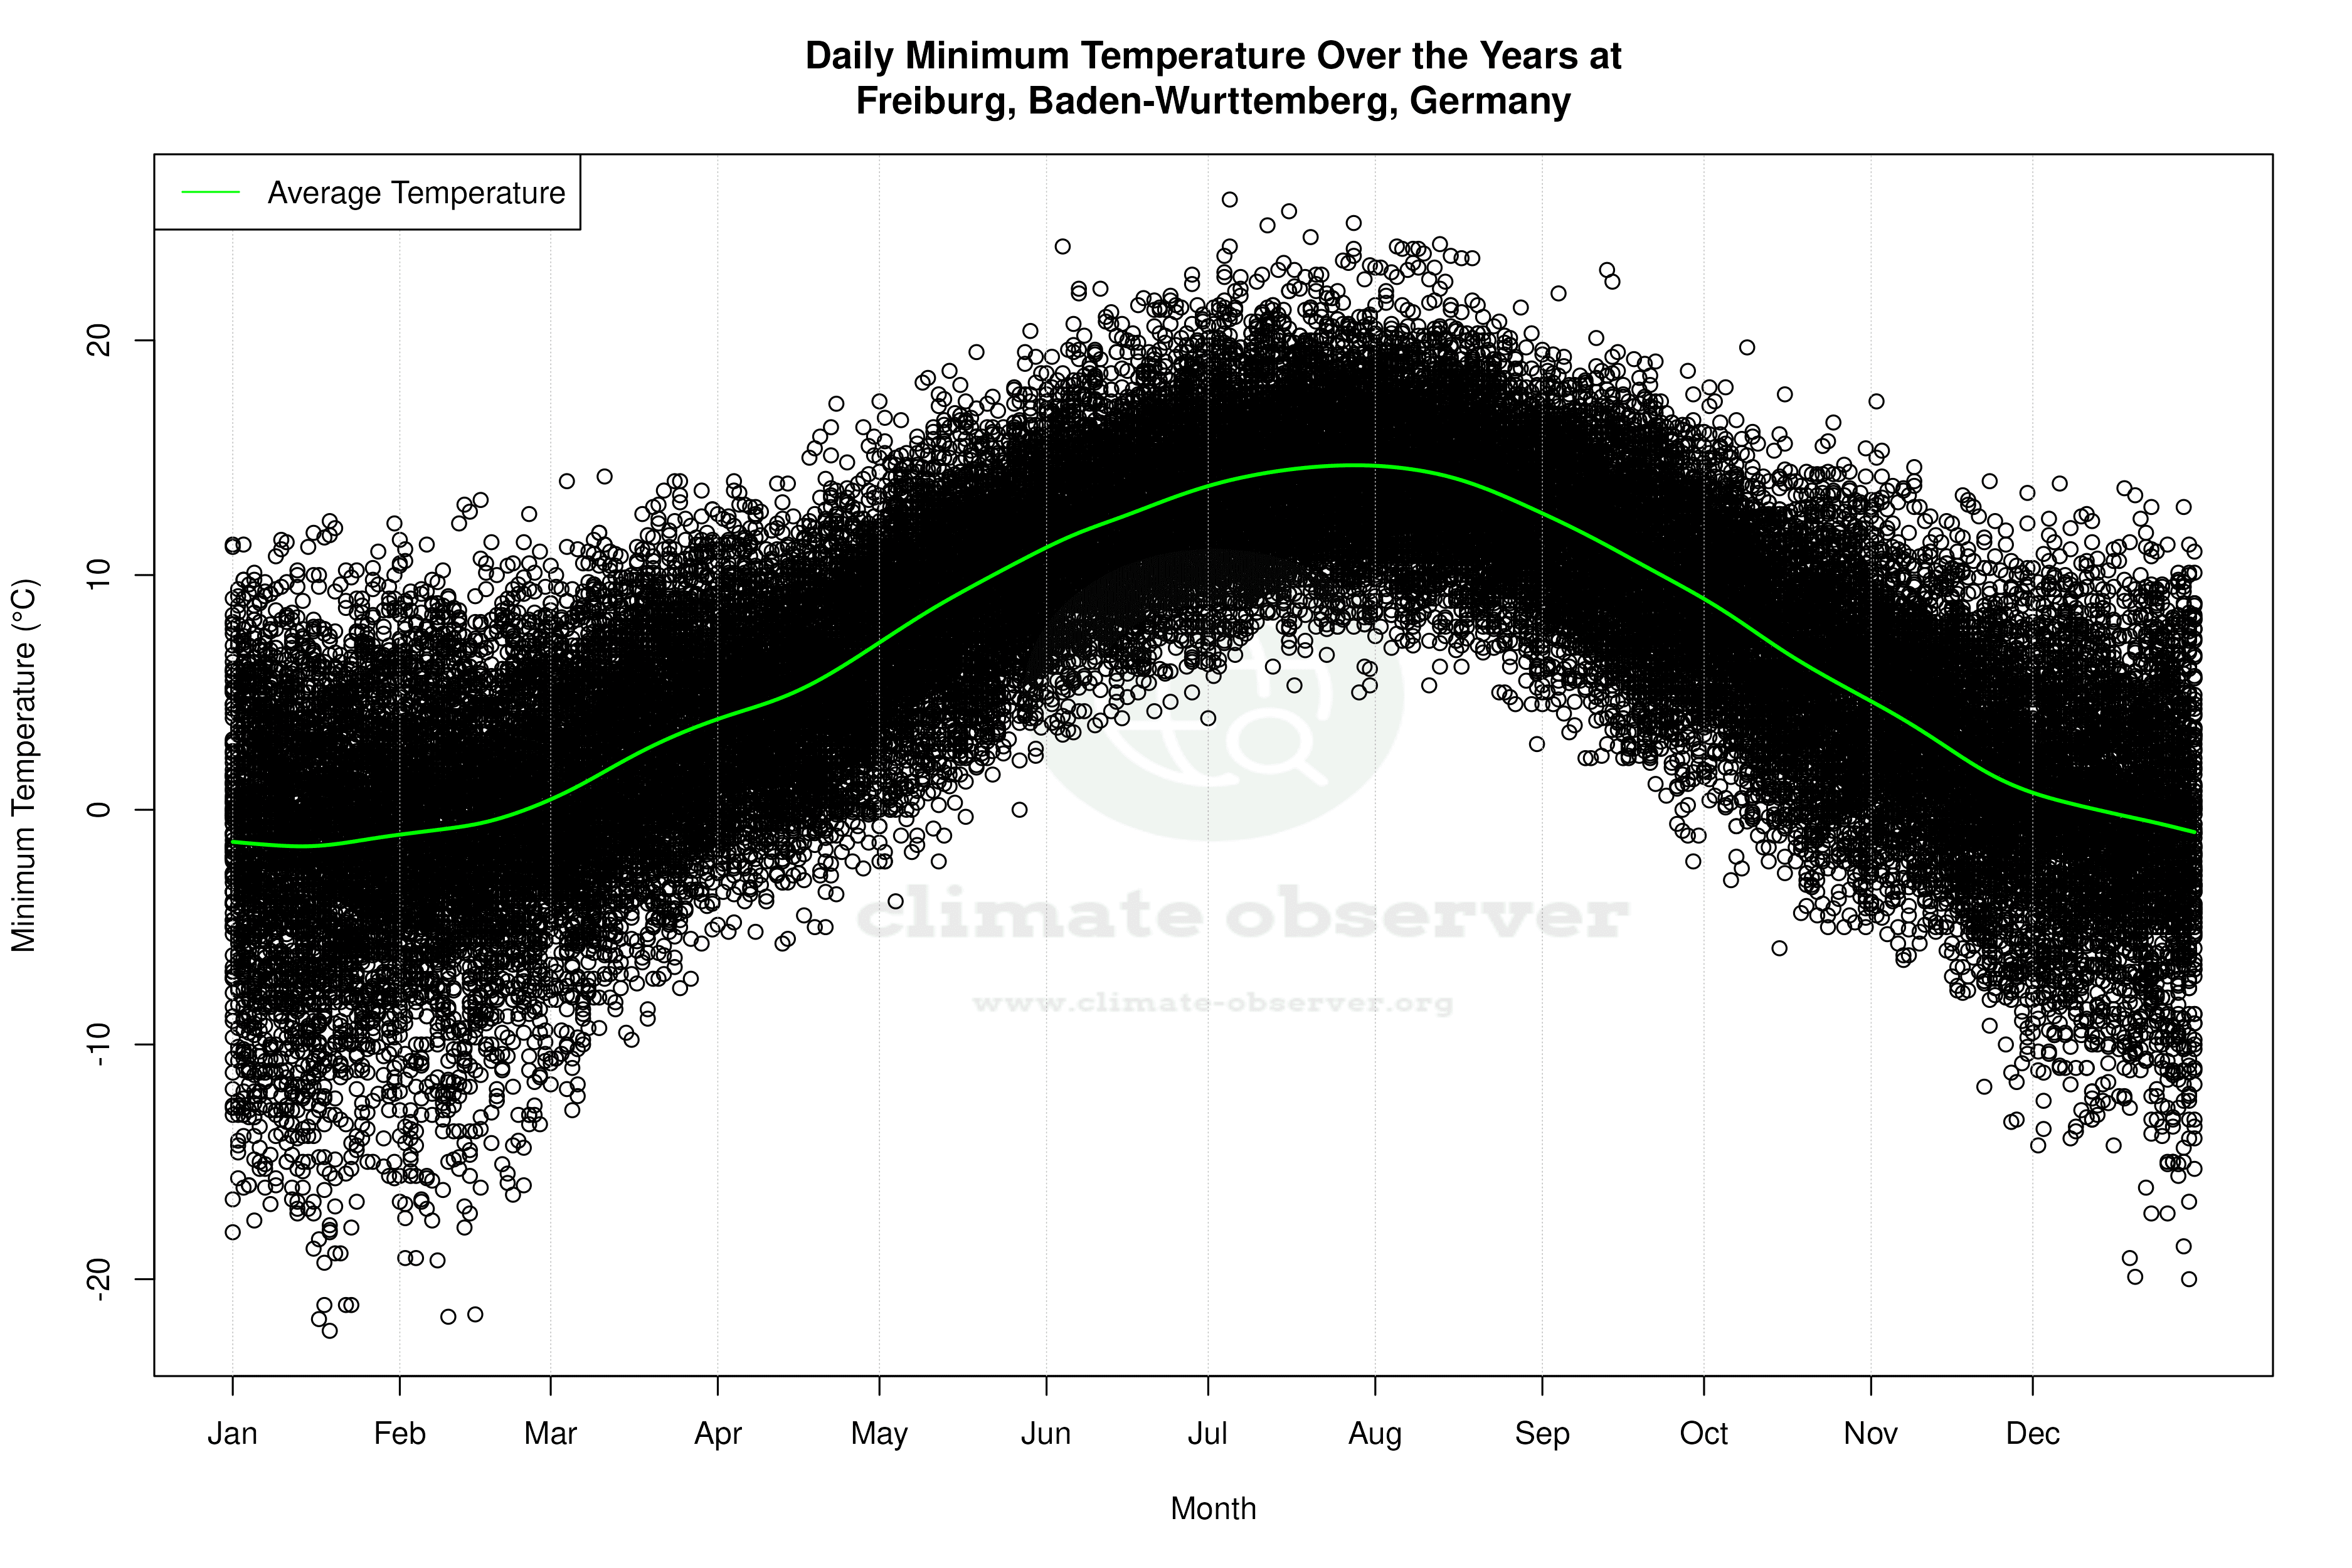
Freiburg has recorded some extreme temperatures, with an all-time high of 40.2°C (104.4°F) and a low of -22.2°C (-7.96°F). These records highlight the city's potential for temperature extremes, which could become more frequent with ongoing climate changes. Such extremes pose challenges to local infrastructure and ecosystems, necessitating adaptive strategies to cope with these conditions.
Regional Climate Context
Germany has set ambitious climate goals, including reducing greenhouse gas emissions and increasing renewable energy use. Freiburg's climate data provides valuable insights into how localised changes fit into these broader objectives. The city's warming trend and shifting precipitation patterns are consistent with national efforts to monitor and respond to climate variability. Recent weather events, such as unseasonal heatwaves, underscore the importance of these data in informing policy and preparedness measures.
Implications for the Future
The trends observed in Freiburg are indicative of broader climatic shifts that could have significant implications for agriculture, energy consumption, and urban planning. As Freiburg continues to warm, stakeholders must consider these changes in their long-term planning to ensure resilience and sustainability. The city's evolving climate profile serves as a microcosm of the challenges and opportunities faced by regions across Germany and beyond.
Station Statistics
10-Year Trend
High: +1.13 °F/decade
Low: +2.79 °F/decade
Rain: +0.027 in/decade
25-Year Trend
High: +1.01 °F/decade
Low: -0.91 °F/decade
Rain: -0.003 in/decade
50-Year Trend
High: +0.94 °F/decade
Low: -0.52 °F/decade
Rain: +0.001 in/decade
All-Time Trend
High: +0.36 °F/decade
Low: +0.20 °F/decade
Rain: -0.001 in/decade
Percentage Above-Average Days
Last 12 Months: 54.0%
This Year: 56.1%
Precipitation Concentration Index (PCI) ℹ️
Last 12 Months: 11.3
Historical Average: 11.0
Percentile Rank of Last 12 Months ℹ️
High: 87th percentile
Low: 50th percentile
Rain: 86th percentile
Change in Variance ℹ️
High: -1.3%
Low: -8.4%
Intraday: +38.0%
Data Coverage
84.6%
First Year of Data
1874
Station Location
Historical Weather Records
| Max High | Avg High | Min High | Max Avg | Avg Avg | Min Avg | Max Low | Avg Low | Min Low | Max Precipitation | Avg Precipitation | Max Snow | Avg Snow | |
|---|---|---|---|---|---|---|---|---|---|---|---|---|---|
| Record | 104.36 °F | — | 5.00 °F | 87.44 °F | — | -1.66 °F | 78.80 °F | — | -7.96 °F | 3.16 in | — | — | — |
| January | 67.10 °F | 40.09 °F | 5.00 °F | 61.34 °F | 34.81 °F | -1.66 °F | 54.14 °F | 29.48 °F | -7.96 °F | 1.65 in | 0.07 in | — | — |
| February | 71.42 °F | 43.96 °F | 8.60 °F | 60.80 °F | 37.44 °F | 4.28 °F | 55.76 °F | 31.10 °F | -6.88 °F | 1.56 in | 0.07 in | — | — |
| March | 79.16 °F | 51.80 °F | 21.92 °F | 66.74 °F | 43.74 °F | 17.24 °F | 57.56 °F | 35.97 °F | 8.96 °F | 1.90 in | 0.08 in | — | — |
| April | 85.64 °F | 59.37 °F | 31.82 °F | 73.40 °F | 50.41 °F | 29.12 °F | 63.14 °F | 41.29 °F | 21.74 °F | 2.28 in | 0.10 in | — | — |
| May | 94.10 °F | 67.48 °F | 41.90 °F | 79.52 °F | 57.97 °F | 37.22 °F | 68.72 °F | 48.51 °F | 24.98 °F | 3.16 in | 0.13 in | — | — |
| June | 97.70 °F | 73.78 °F | 48.02 °F | 84.74 °F | 64.30 °F | 42.98 °F | 75.20 °F | 54.62 °F | 37.76 °F | 2.98 in | 0.14 in | — | — |
| July | 102.92 °F | 77.25 °F | 53.60 °F | 87.44 °F | 67.63 °F | 50.36 °F | 78.80 °F | 57.92 °F | 39.02 °F | 2.66 in | 0.13 in | — | — |
| August | 104.36 °F | 76.21 °F | 54.14 °F | 86.90 °F | 66.59 °F | 48.74 °F | 75.38 °F | 57.12 °F | 37.04 °F | 3.07 in | 0.12 in | — | — |
| September | 93.02 °F | 69.12 °F | 46.40 °F | 79.34 °F | 60.14 °F | 40.46 °F | 73.40 °F | 51.62 °F | 28.04 °F | 2.76 in | 0.11 in | — | — |
| October | 87.44 °F | 58.82 °F | 33.80 °F | 73.94 °F | 51.19 °F | 29.66 °F | 67.46 °F | 44.22 °F | 21.38 °F | 2.32 in | 0.10 in | — | — |
| November | 73.76 °F | 47.93 °F | 20.84 °F | 67.64 °F | 42.22 °F | 15.62 °F | 63.32 °F | 36.77 °F | 8.06 °F | 2.54 in | 0.09 in | — | — |
| December | 71.06 °F | 41.97 °F | 12.74 °F | 62.60 °F | 36.77 °F | 2.30 °F | 57.02 °F | 31.75 °F | -4.00 °F | 2.04 in | 0.08 in | — | — |
Data Visualisations
Remove WatermarksCurrent Year Climate Trends vs Historical
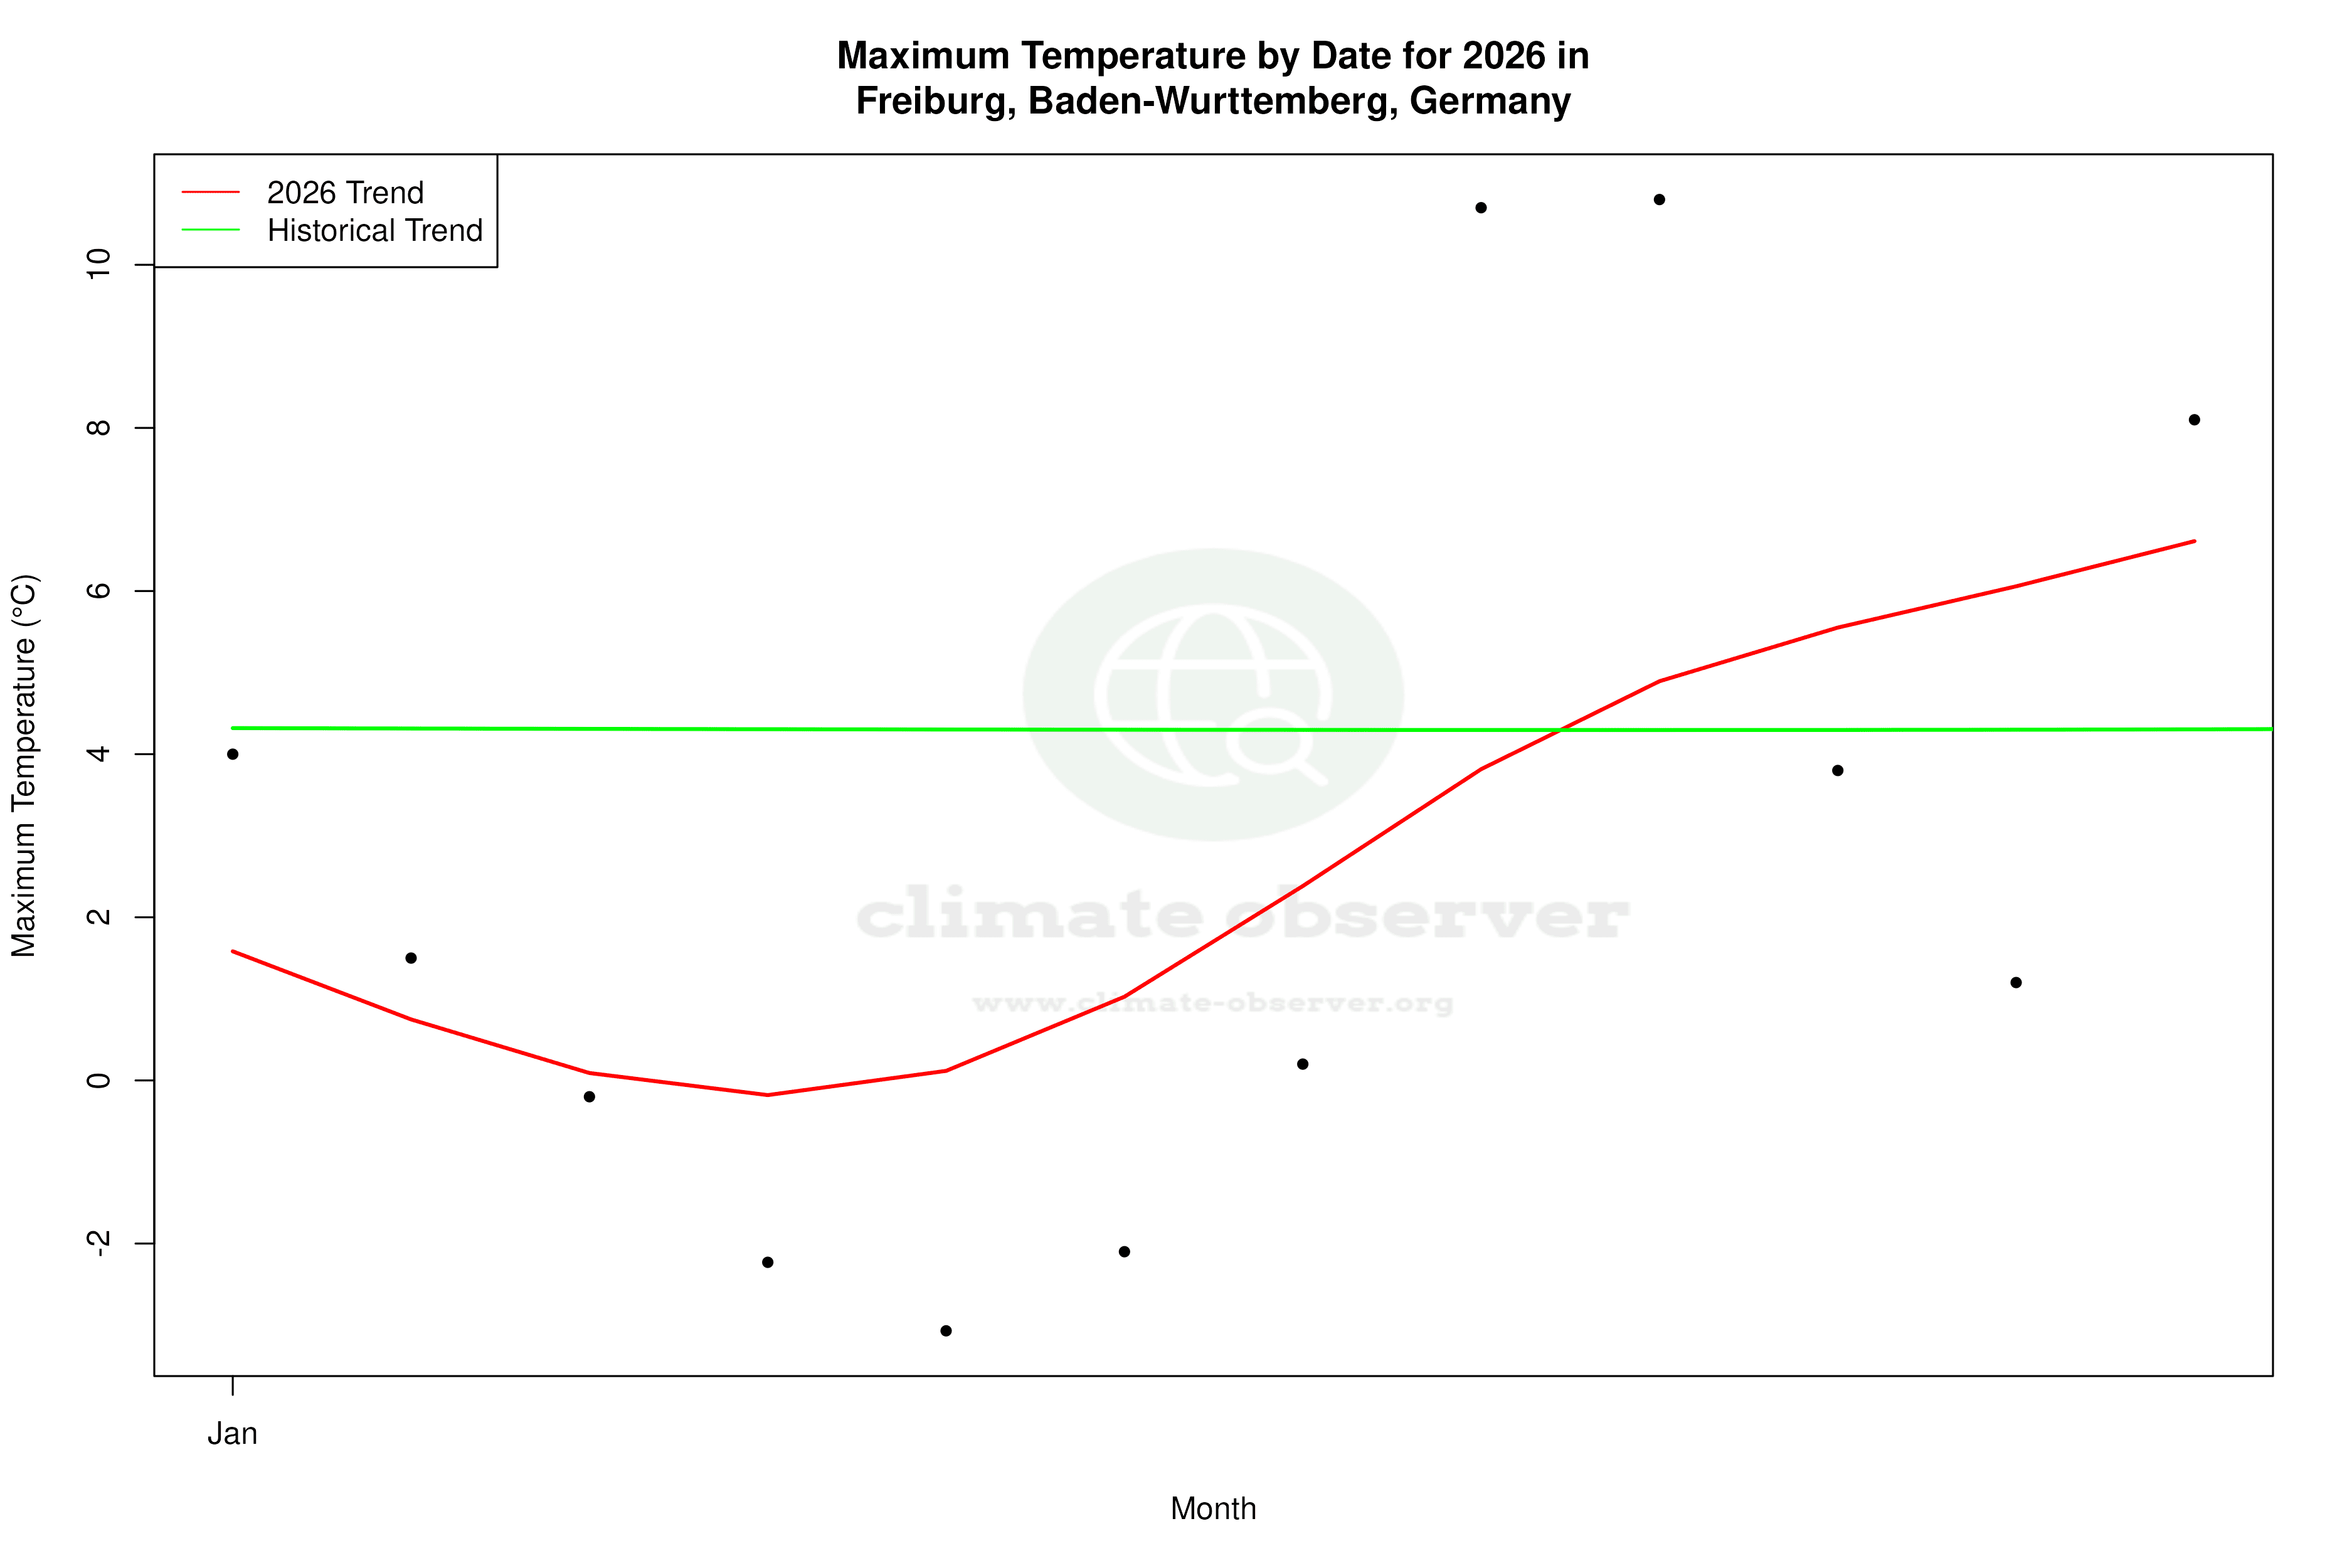


Max Temperature this Year | 1 of 6
Climate 12-Month Moving Averages
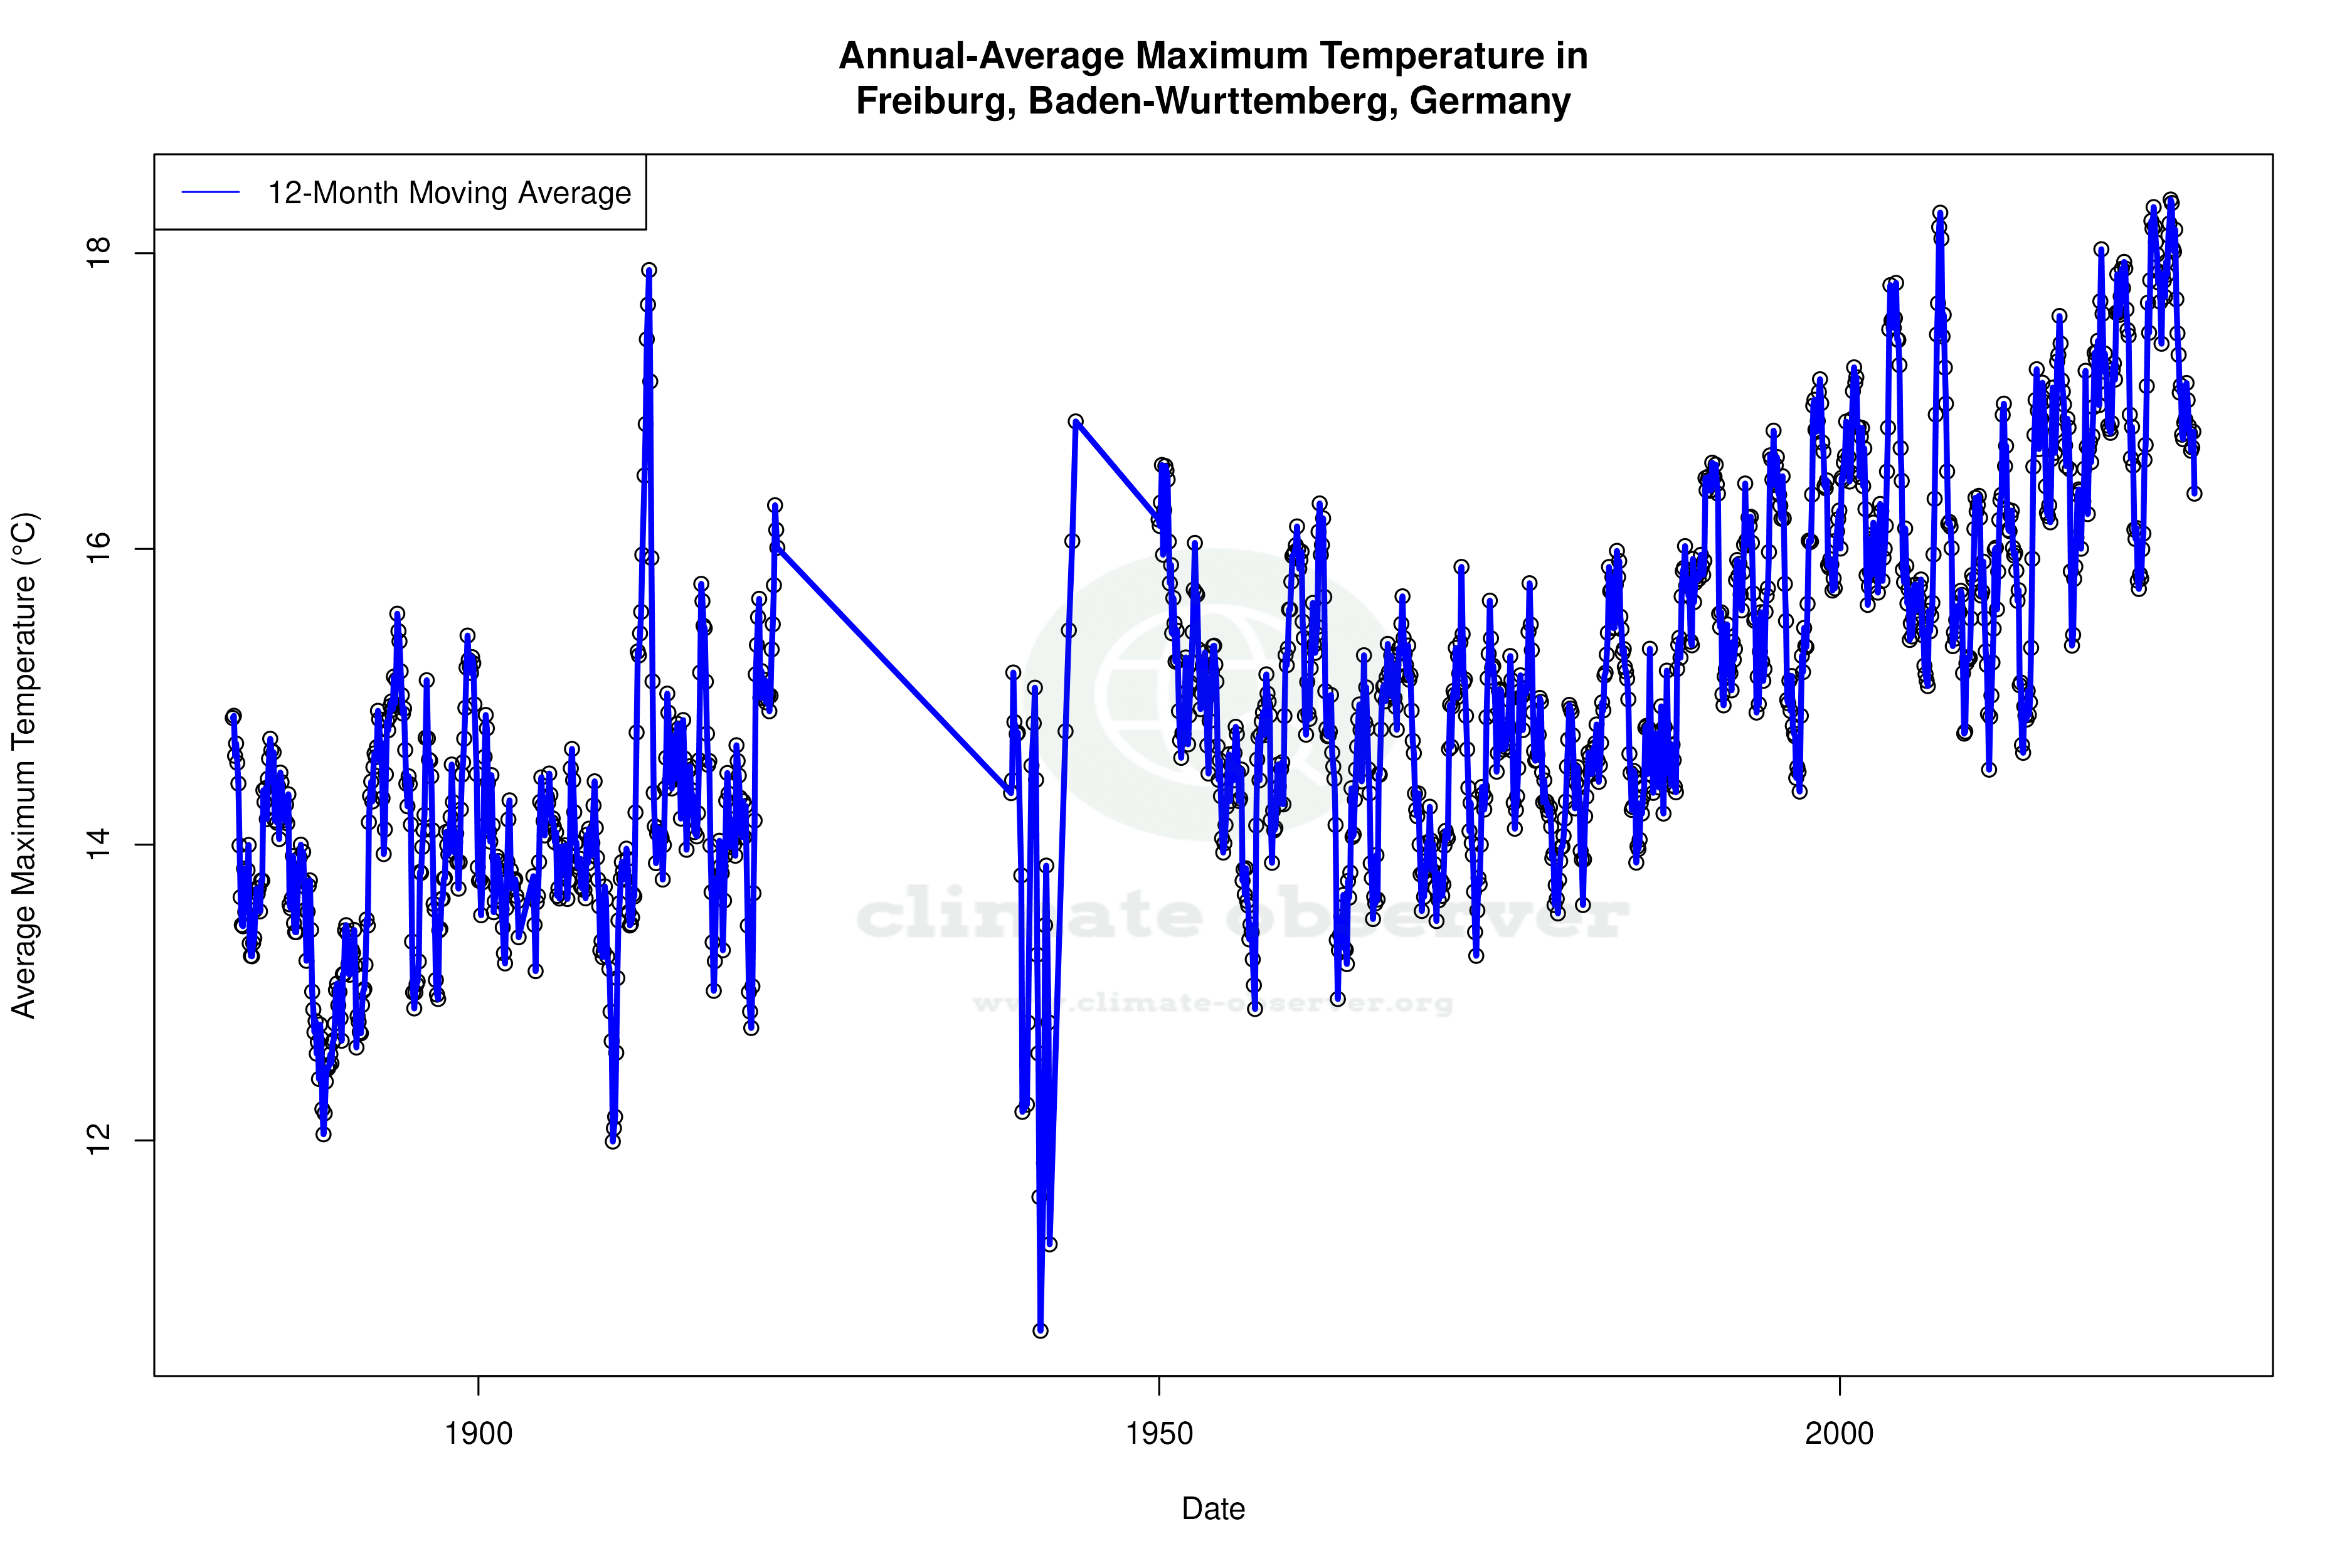


Max Temperature 12-Month MA | 1 of 6
Daily Data Points and Averages Throughout the Year
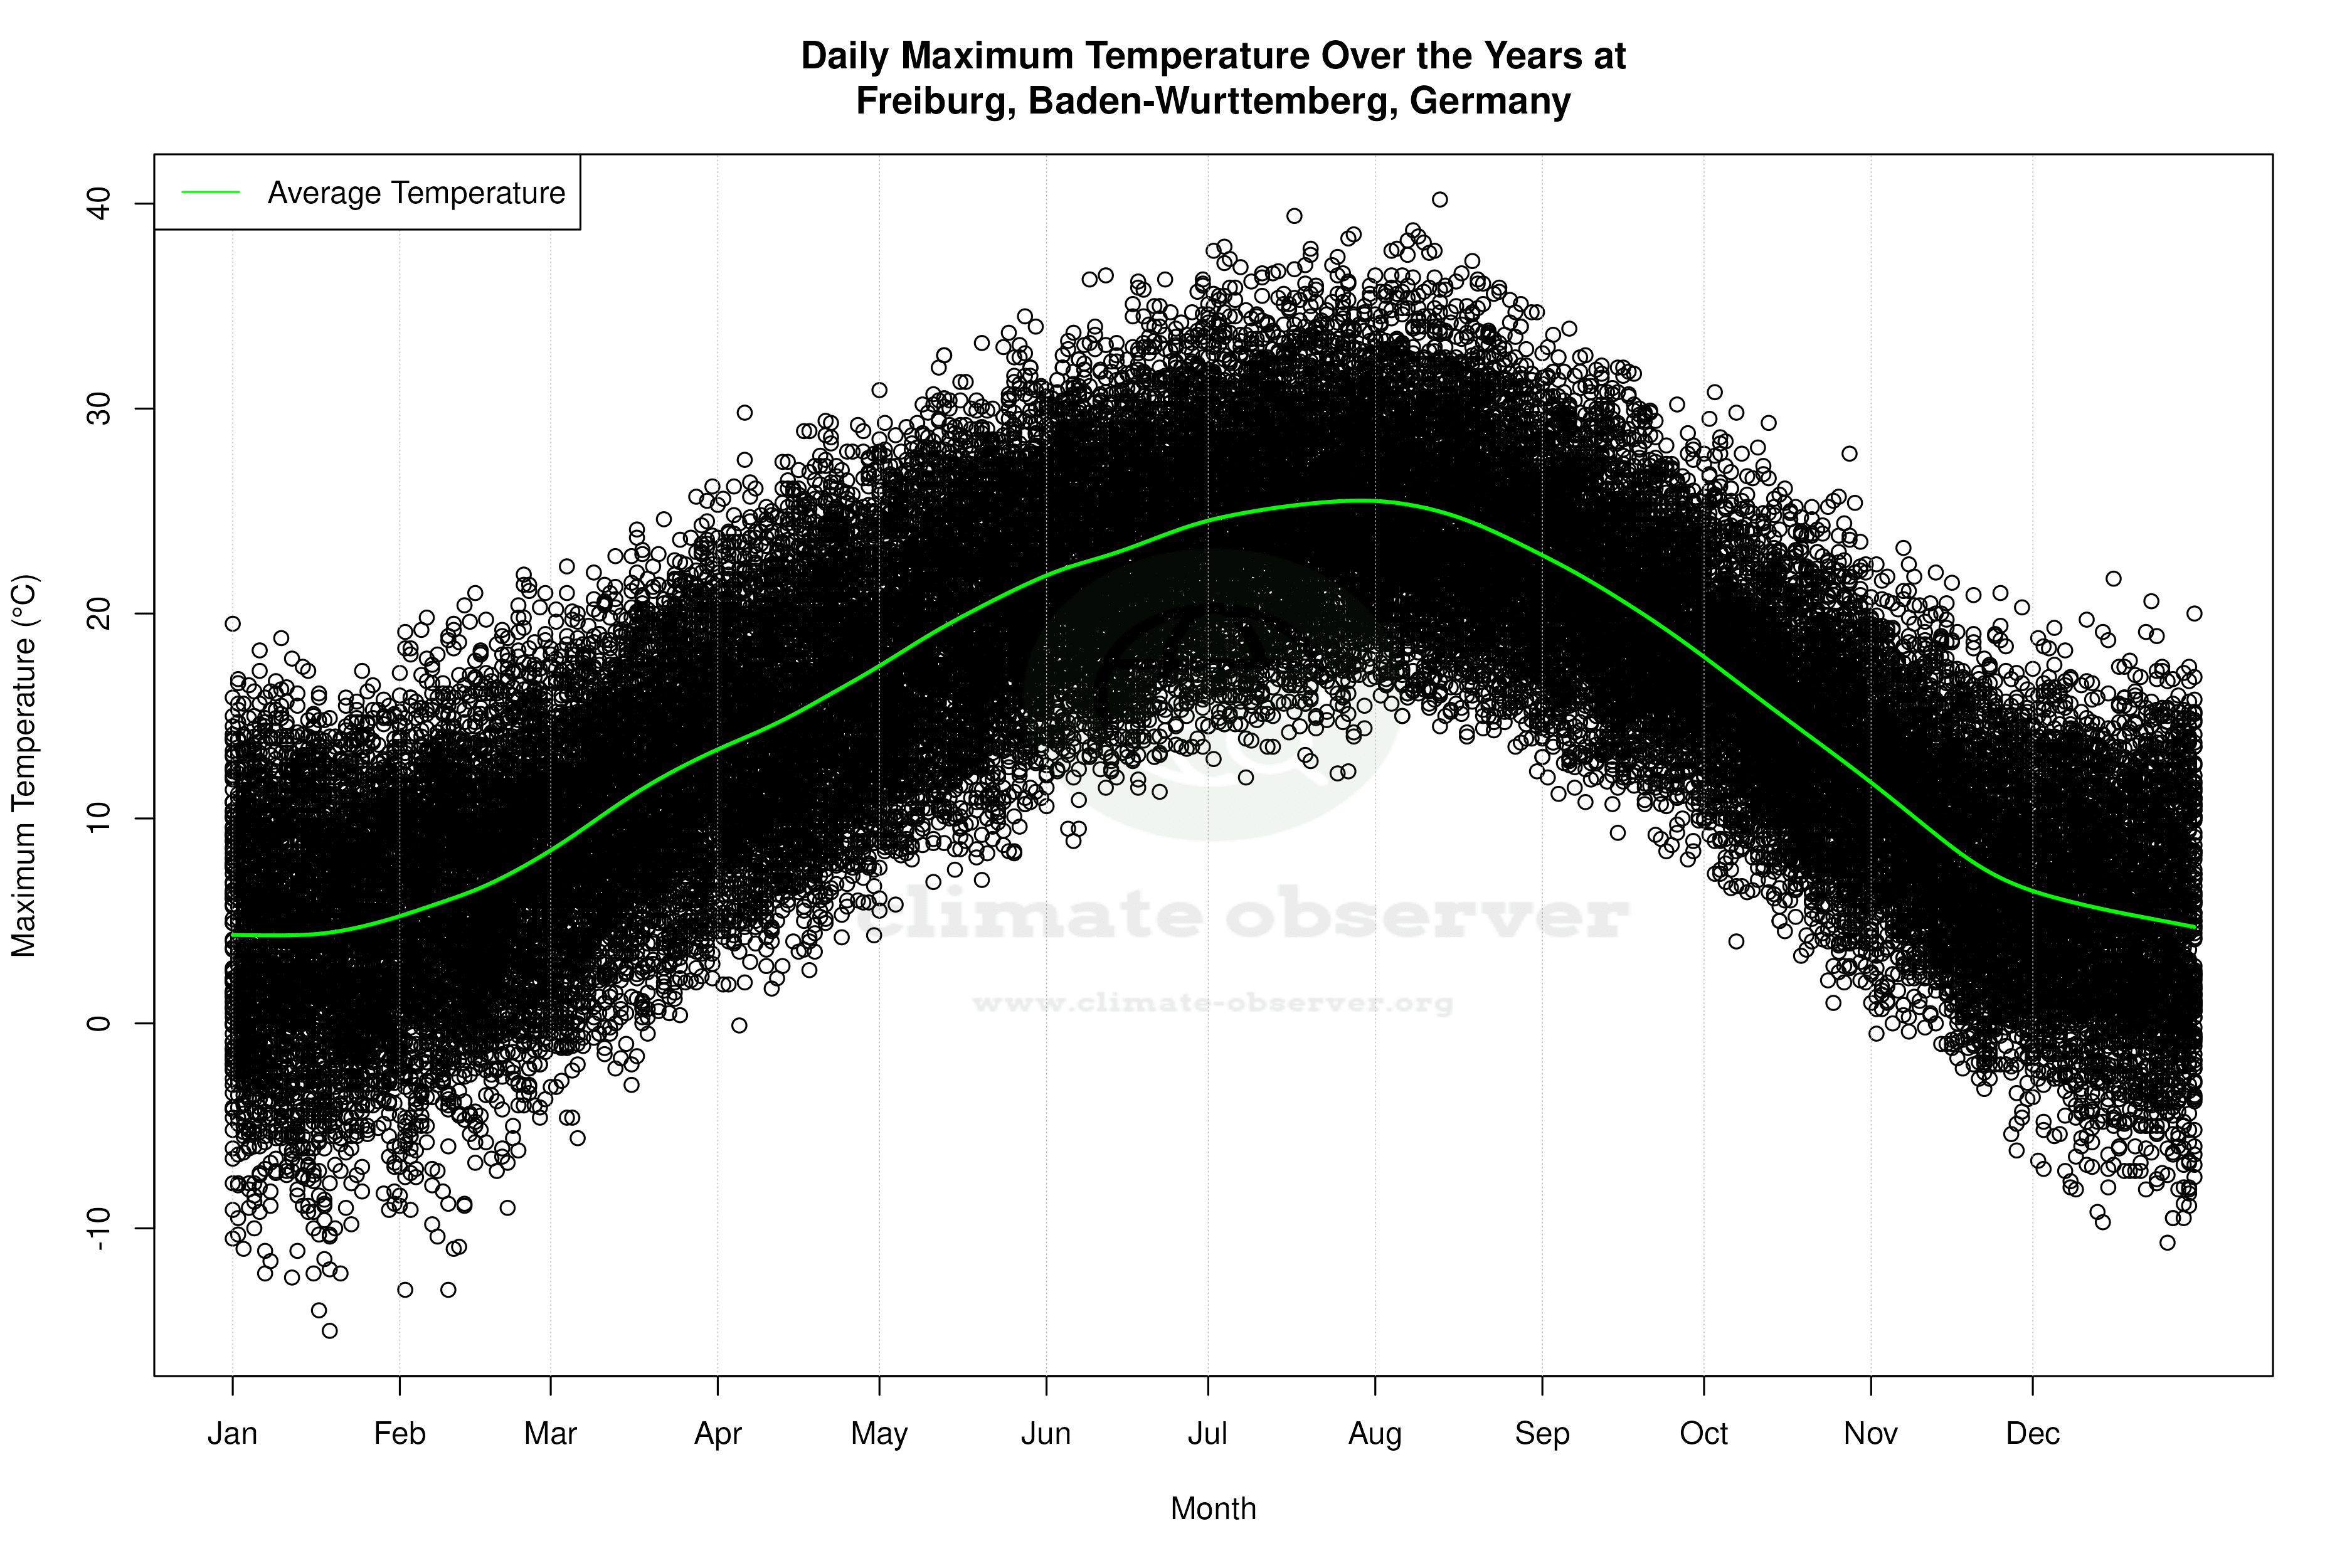
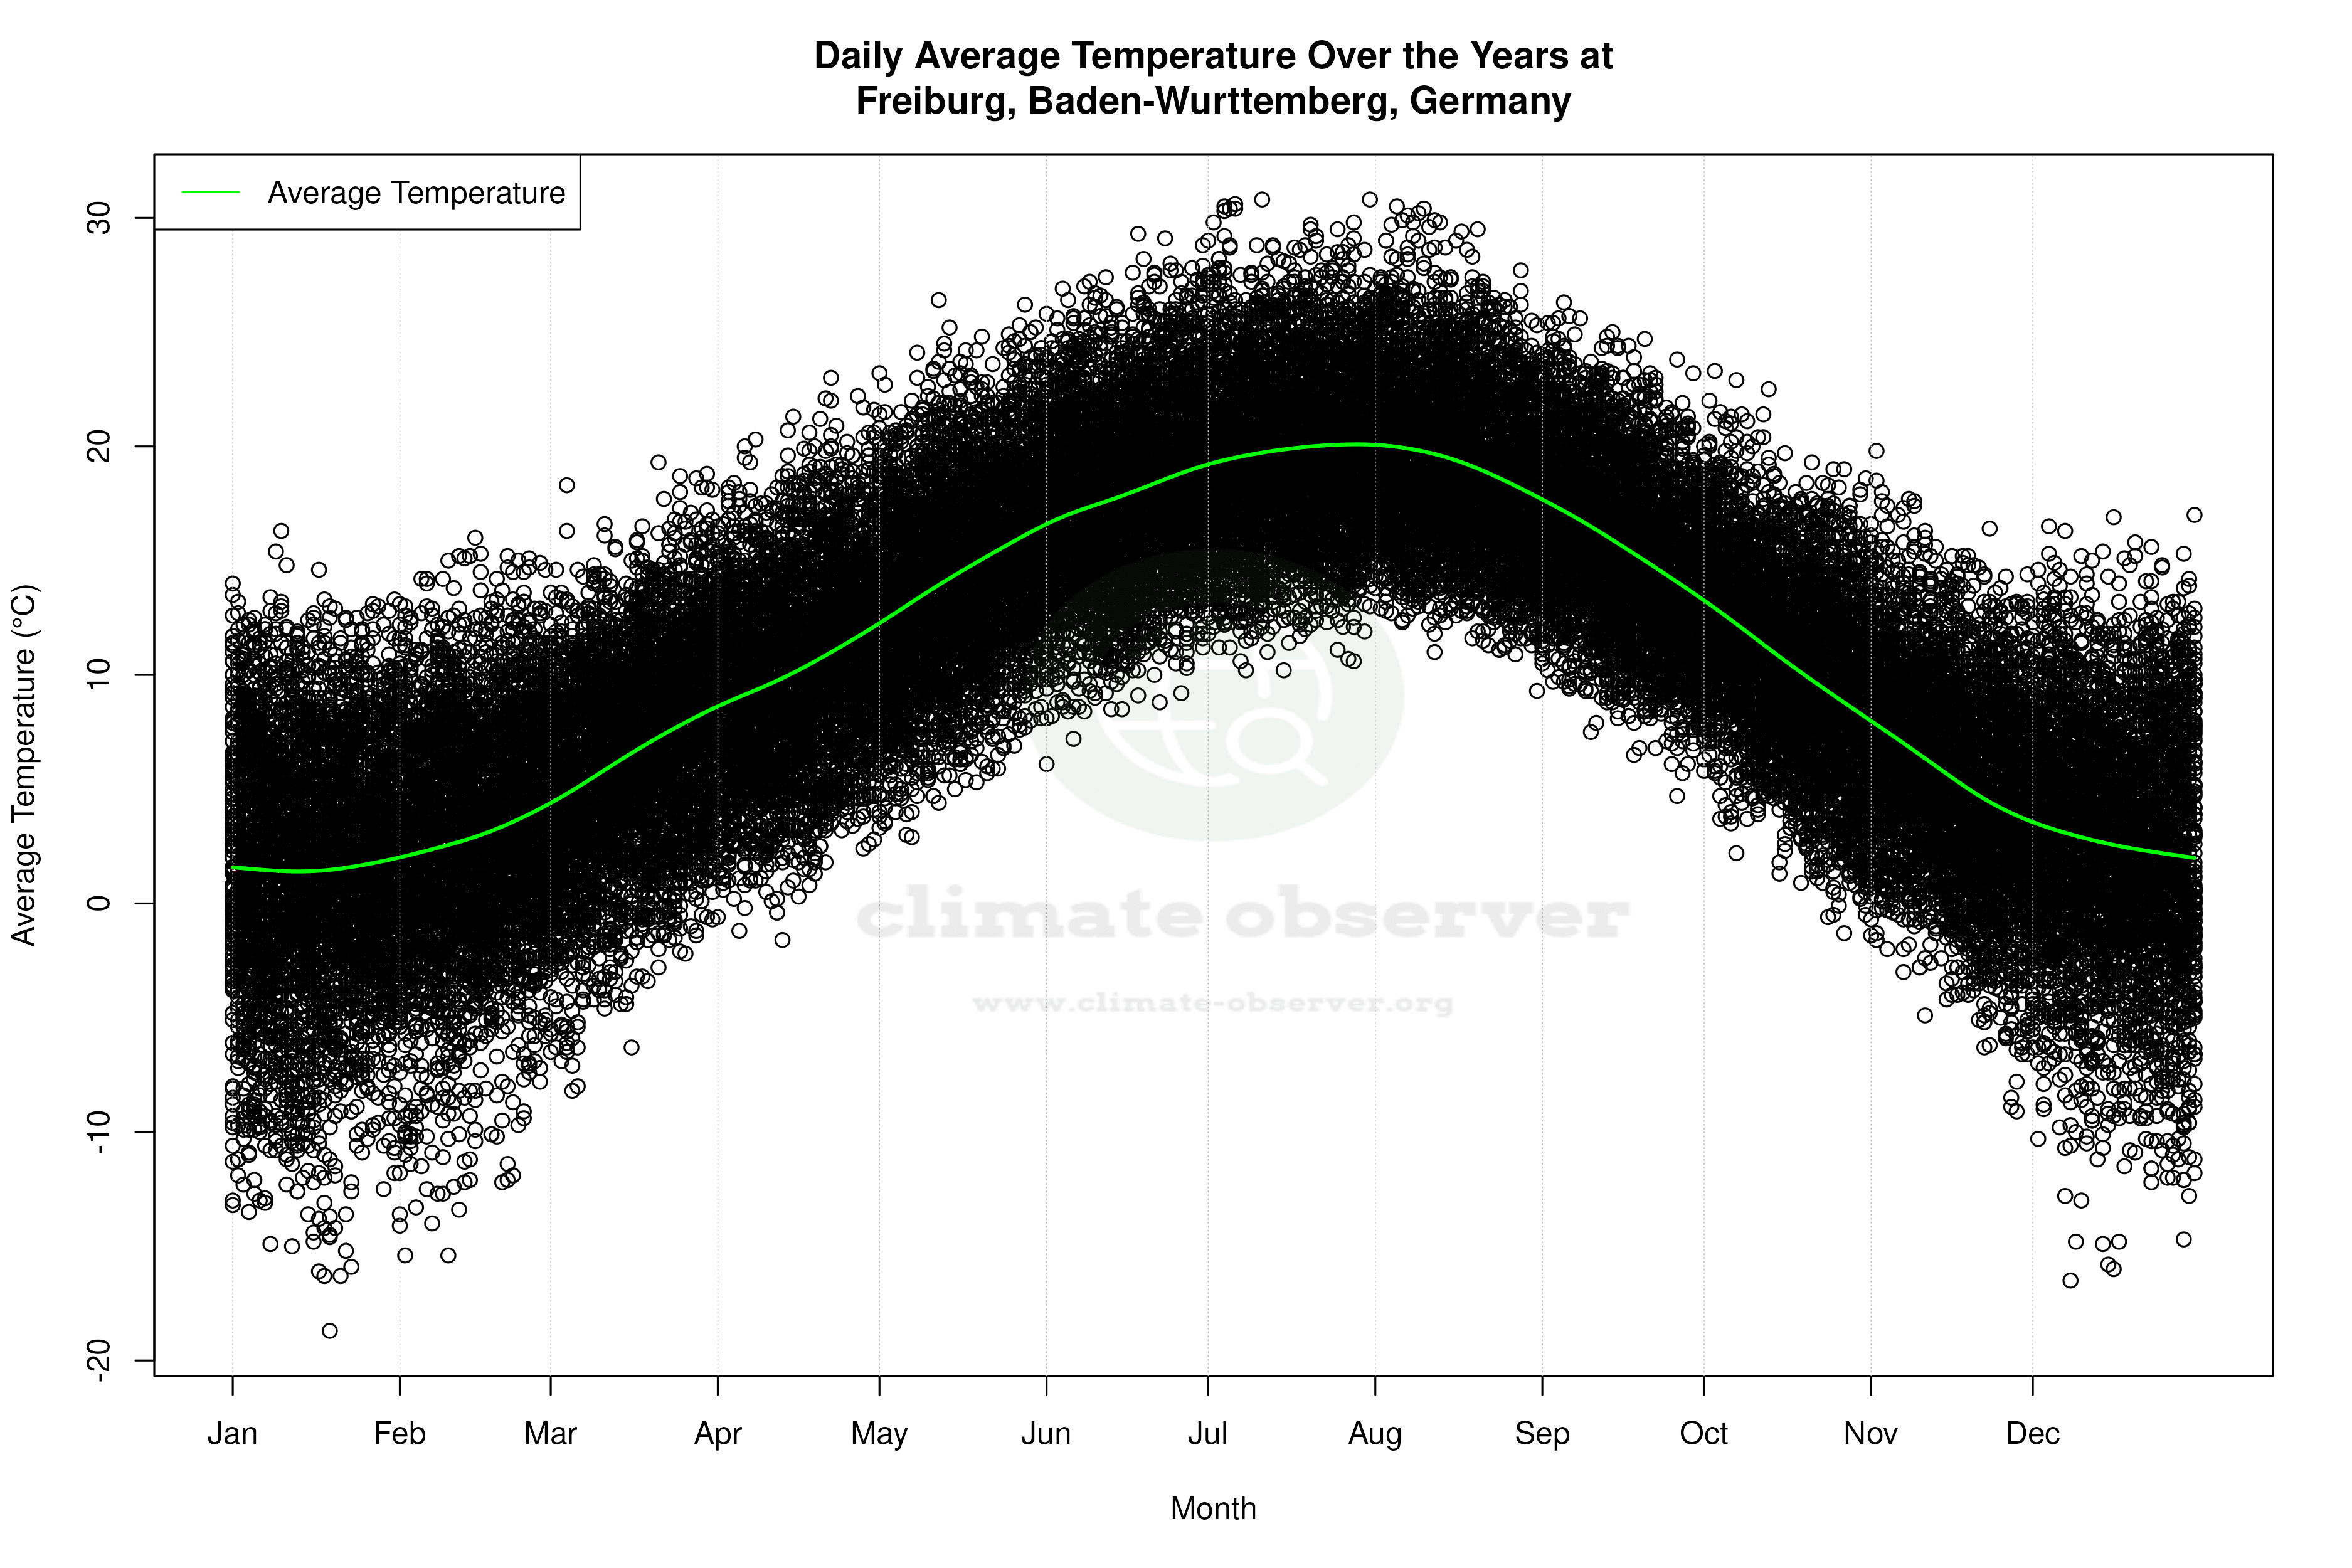


Average Max Temperature Throughout Year | 1 of 5
