Climate for Station: Putbus, Mecklenburg-Vorpommern, Germany
Loading live weather...
Climate Analysis & Overview
Putbus, nestled in the temperate maritime climate of northern Germany, is experiencing a warming trend, with recent decades showing a stronger increase in temperatures compared to historical averages. The region's precipitation is becoming more evenly distributed, reflecting a subtle shift in climate patterns.
Maritime Climate Dynamics
Located in the northeastern part of Germany, Putbus falls under the Cfb classification in the Köppen climate system, which denotes a temperate oceanic climate. This classification is characterised by mild summers and cool winters, influenced by the Baltic Sea's moderating effects. The geographical positioning near the coast ensures that Putbus experiences relatively stable temperatures throughout the year, with the sea acting as a thermal buffer.
Temperature Trends: A Warming Narrative
Over the past decade, Putbus has witnessed a noticeable warming trend. The average high temperatures have increased by 0.88°C (1.58°F), while the lows have risen by 0.43°C (0.77°F). These figures indicate a more pronounced warming compared to the all-time trends, which show a rise of 0.12°C (0.22°F) for highs and 0.09°C (0.16°F) for lows. This discrepancy suggests an acceleration in warming over recent years, aligning with broader regional climate goals aimed at mitigating climate change impacts.
Precipitation Patterns: A Shift Towards Even Distribution
The Precipitation Concentration Index (PCI) for Putbus has shown a slight decrease from a baseline of 11.0 to a current value of 10.8. This marginal change indicates that precipitation events are becoming more evenly distributed throughout the year, rather than being concentrated in fewer, more intense events. Such a trend could lead to reduced risks of flooding and better water resource management, crucial for local agriculture and ecosystems.
Extremes in Historical Context
Putbus has recorded a maximum temperature of 35.8°C (96.4°F) and a minimum of -23.6°C (-10.5°F), highlighting the range of temperature extremes the region can experience. These records are indicative of the potential for both heatwaves and severe cold spells, although the overall warming trend may lead to more frequent occurrences of the former.
Regional Implications and Future Outlook
As Germany continues to pursue its climate objectives, the trends observed in Putbus offer valuable insights into the broader climatic shifts occurring across the country. The warming temperatures and more evenly distributed precipitation align with efforts to adapt to and mitigate the impacts of climate change. Recent weather events, such as heatwaves and unseasonal rainfall, underscore the importance of ongoing monitoring and adaptation strategies to ensure resilience in the face of evolving climatic conditions.
Station Statistics
10-Year Trend
High: +0.97 °F/decade
Low: +0.56 °F/decade
Rain: +0.010 in/decade
25-Year Trend
High: +1.19 °F/decade
Low: +0.74 °F/decade
Rain: -0.001 in/decade
50-Year Trend
High: +1.06 °F/decade
Low: +0.49 °F/decade
Rain: +0.001 in/decade
All-Time Trend
High: +0.21 °F/decade
Low: +0.17 °F/decade
Rain: +0.001 in/decade
Percentage Above-Average Days
Last 12 Months: 49.4%
This Year: 30.9%
Precipitation Concentration Index (PCI) ℹ️
Last 12 Months: 11.6
Historical Average: 11.0
Percentile Rank of Last 12 Months ℹ️
High: 94th percentile
Low: 90th percentile
Rain: 45th percentile
Change in Variance ℹ️
High: -4.7%
Low: -16.8%
Intraday: +23.5%
Data Coverage
96.7%
First Year of Data
1853
Station Location
Historical Weather Records
| Max High | Avg High | Min High | Max Avg | Avg Avg | Min Avg | Max Low | Avg Low | Min Low | Max Precipitation | Avg Precipitation | Max Snow | Avg Snow | |
|---|---|---|---|---|---|---|---|---|---|---|---|---|---|
| Record | 96.44 °F | — | 5.00 °F | 81.32 °F | — | -2.38 °F | 71.42 °F | — | -10.48 °F | 3.86 in | — | — | — |
| January | 57.92 °F | 34.84 °F | 5.00 °F | 53.60 °F | 31.50 °F | -2.38 °F | 47.12 °F | 27.80 °F | -10.48 °F | 1.24 in | 0.06 in | — | — |
| February | 63.50 °F | 36.06 °F | 8.06 °F | 54.50 °F | 32.13 °F | 2.48 °F | 50.72 °F | 28.14 °F | -5.62 °F | 1.10 in | 0.05 in | — | — |
| March | 70.52 °F | 41.73 °F | 17.78 °F | 57.56 °F | 36.32 °F | 12.56 °F | 50.00 °F | 31.72 °F | 4.64 °F | 1.06 in | 0.05 in | — | — |
| April | 80.96 °F | 50.27 °F | 30.02 °F | 68.00 °F | 43.27 °F | 25.52 °F | 56.66 °F | 37.39 °F | 18.86 °F | 1.20 in | 0.05 in | — | — |
| May | 91.40 °F | 59.55 °F | 37.04 °F | 77.00 °F | 51.77 °F | 33.98 °F | 64.40 °F | 44.67 °F | 26.42 °F | 1.93 in | 0.06 in | — | — |
| June | 96.44 °F | 66.58 °F | 46.94 °F | 79.88 °F | 58.82 °F | 41.54 °F | 70.70 °F | 51.33 °F | 32.00 °F | 1.85 in | 0.07 in | — | — |
| July | 94.46 °F | 70.03 °F | 47.84 °F | 81.32 °F | 62.47 °F | 46.76 °F | 71.42 °F | 55.61 °F | 33.80 °F | 3.03 in | 0.09 in | — | — |
| August | 94.46 °F | 69.40 °F | 50.36 °F | 79.88 °F | 61.80 °F | 48.38 °F | 70.16 °F | 55.34 °F | 32.00 °F | 3.00 in | 0.09 in | — | — |
| September | 87.80 °F | 63.02 °F | 44.42 °F | 75.56 °F | 56.25 °F | 40.64 °F | 68.18 °F | 50.59 °F | 24.08 °F | 3.86 in | 0.07 in | — | — |
| October | 77.54 °F | 53.37 °F | 30.20 °F | 65.66 °F | 48.19 °F | 29.48 °F | 59.36 °F | 43.59 °F | 24.80 °F | 1.23 in | 0.07 in | — | — |
| November | 67.64 °F | 43.16 °F | 20.30 °F | 60.08 °F | 39.58 °F | 17.42 °F | 55.04 °F | 35.97 °F | 12.20 °F | 1.51 in | 0.06 in | — | — |
| December | 57.20 °F | 37.25 °F | 6.80 °F | 51.62 °F | 34.11 °F | 5.36 °F | 49.46 °F | 30.64 °F | 0.50 °F | 1.33 in | 0.06 in | — | — |
Data Visualisations
Remove WatermarksCurrent Year Climate Trends vs Historical


Max Temperature this Year | 1 of 6
Climate 12-Month Moving Averages


Max Temperature 12-Month MA | 1 of 6
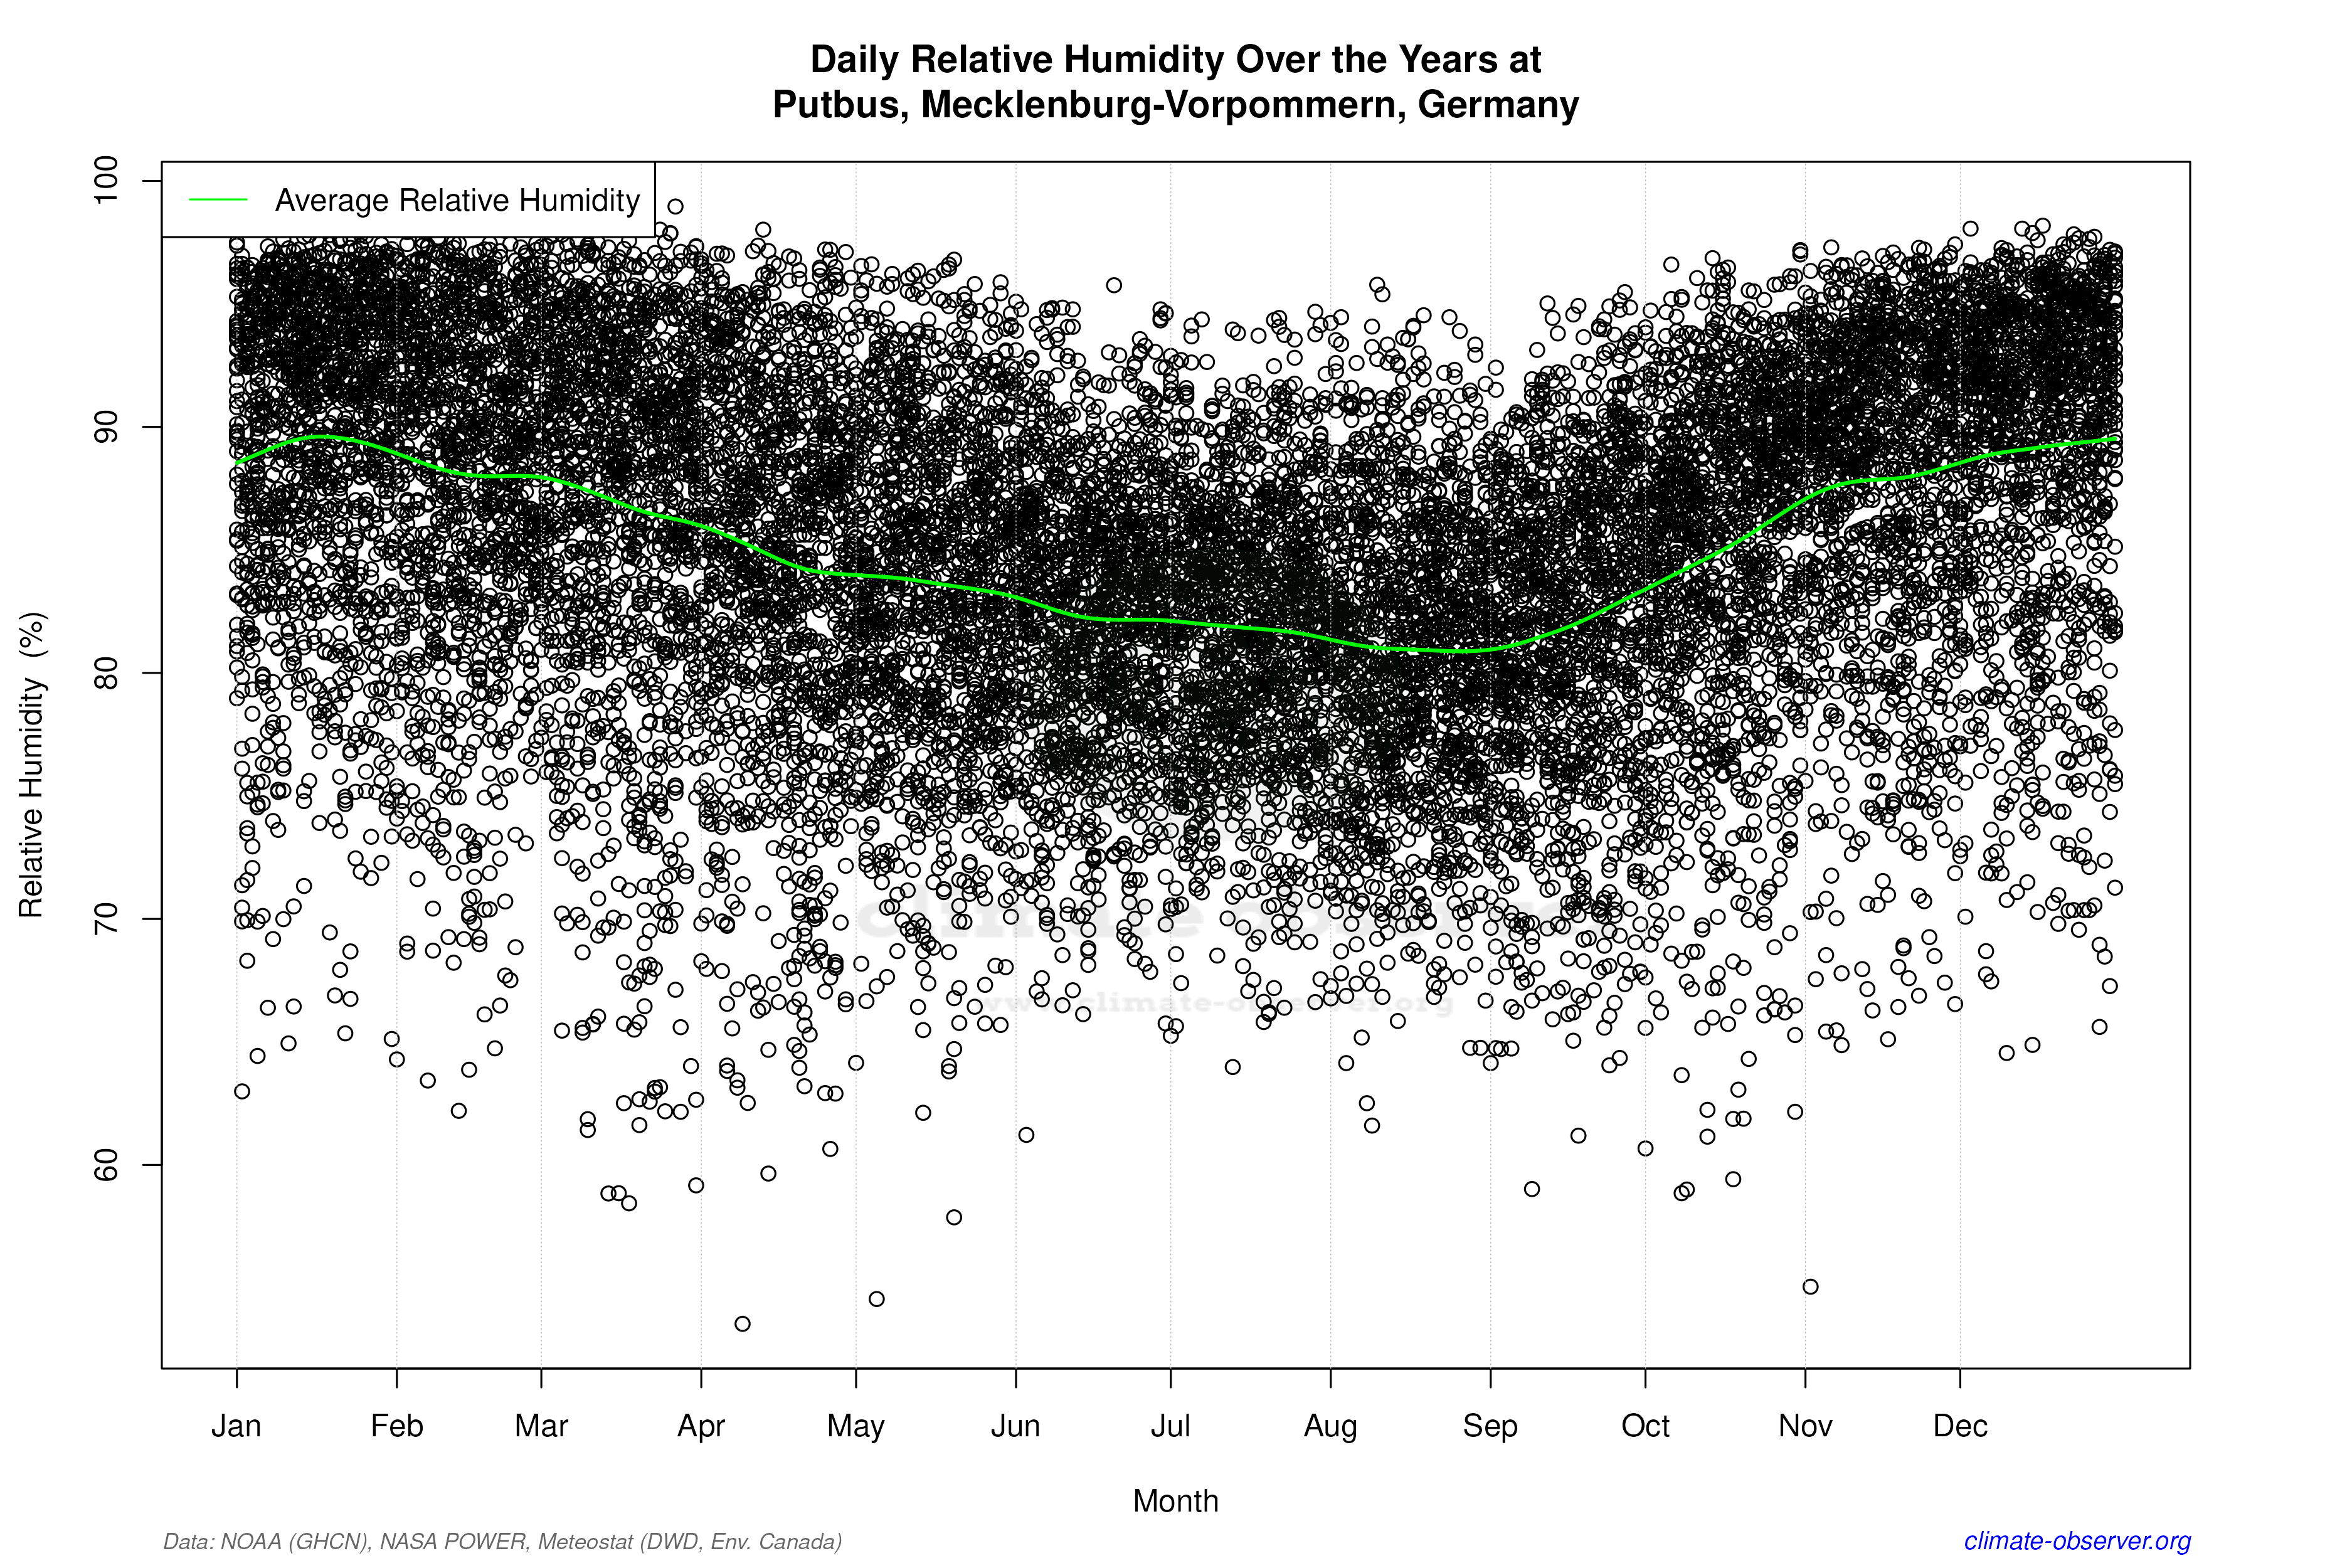
Daily Data Points and Averages Throughout the Year


Average Max Temperature Throughout Year | 1 of 5
