Climate for Station: Begumpet Obsy, Telangana, India
Loading live weather...
Climate Analysis & Overview
Begumpet Obsy reveals a mixed climate narrative with a slight all-time warming trend in temperatures, juxtaposed against a recent cooling in high temperatures over the past decade. The precipitation pattern has become more evenly distributed, reflecting a shift in rainfall dynamics.
Köppen Climate and Local Geography
Begumpet Airport, located in Hyderabad, Telangana, falls under the Köppen climate classification of 'Aw', indicating a tropical savanna climate with a distinct wet and dry season. The region's climate is heavily influenced by the monsoon winds, which bring significant rainfall during the summer months. Hyderabad's location, away from the coast and surrounded by the Deccan Plateau, contributes to its relatively stable temperature variations and precipitation patterns.
Temperature Dynamics: A Tale of Two Trends
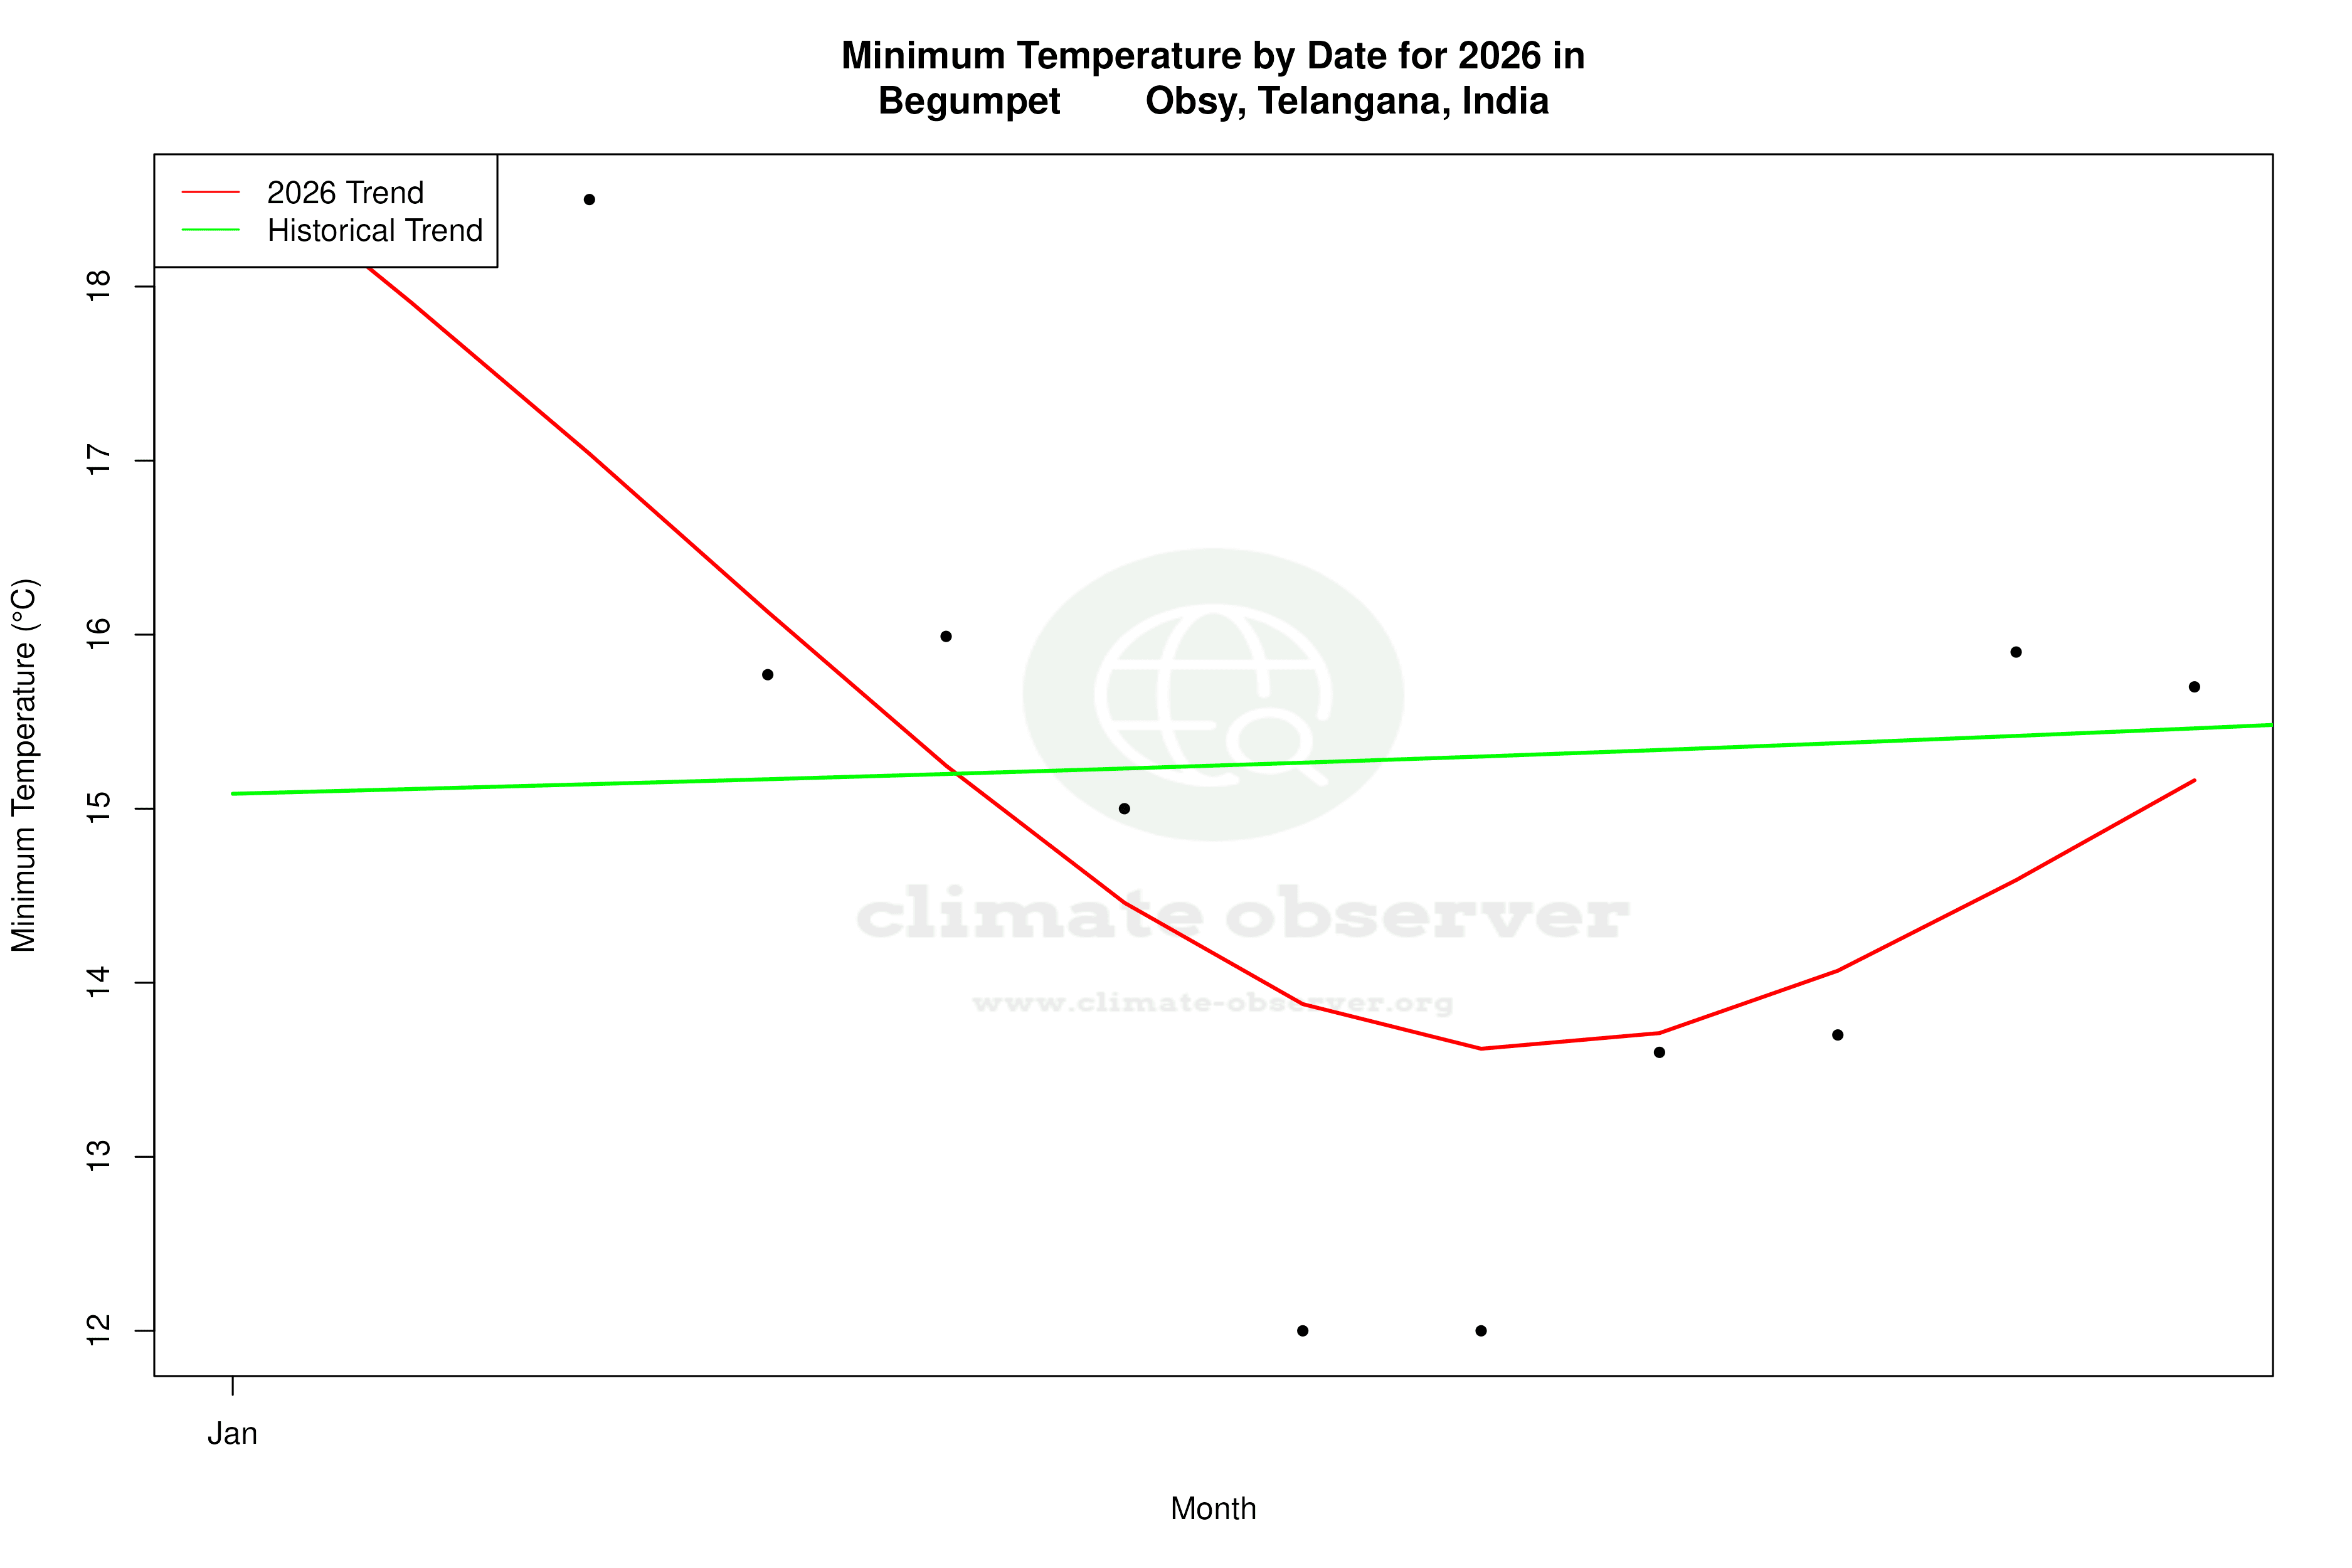
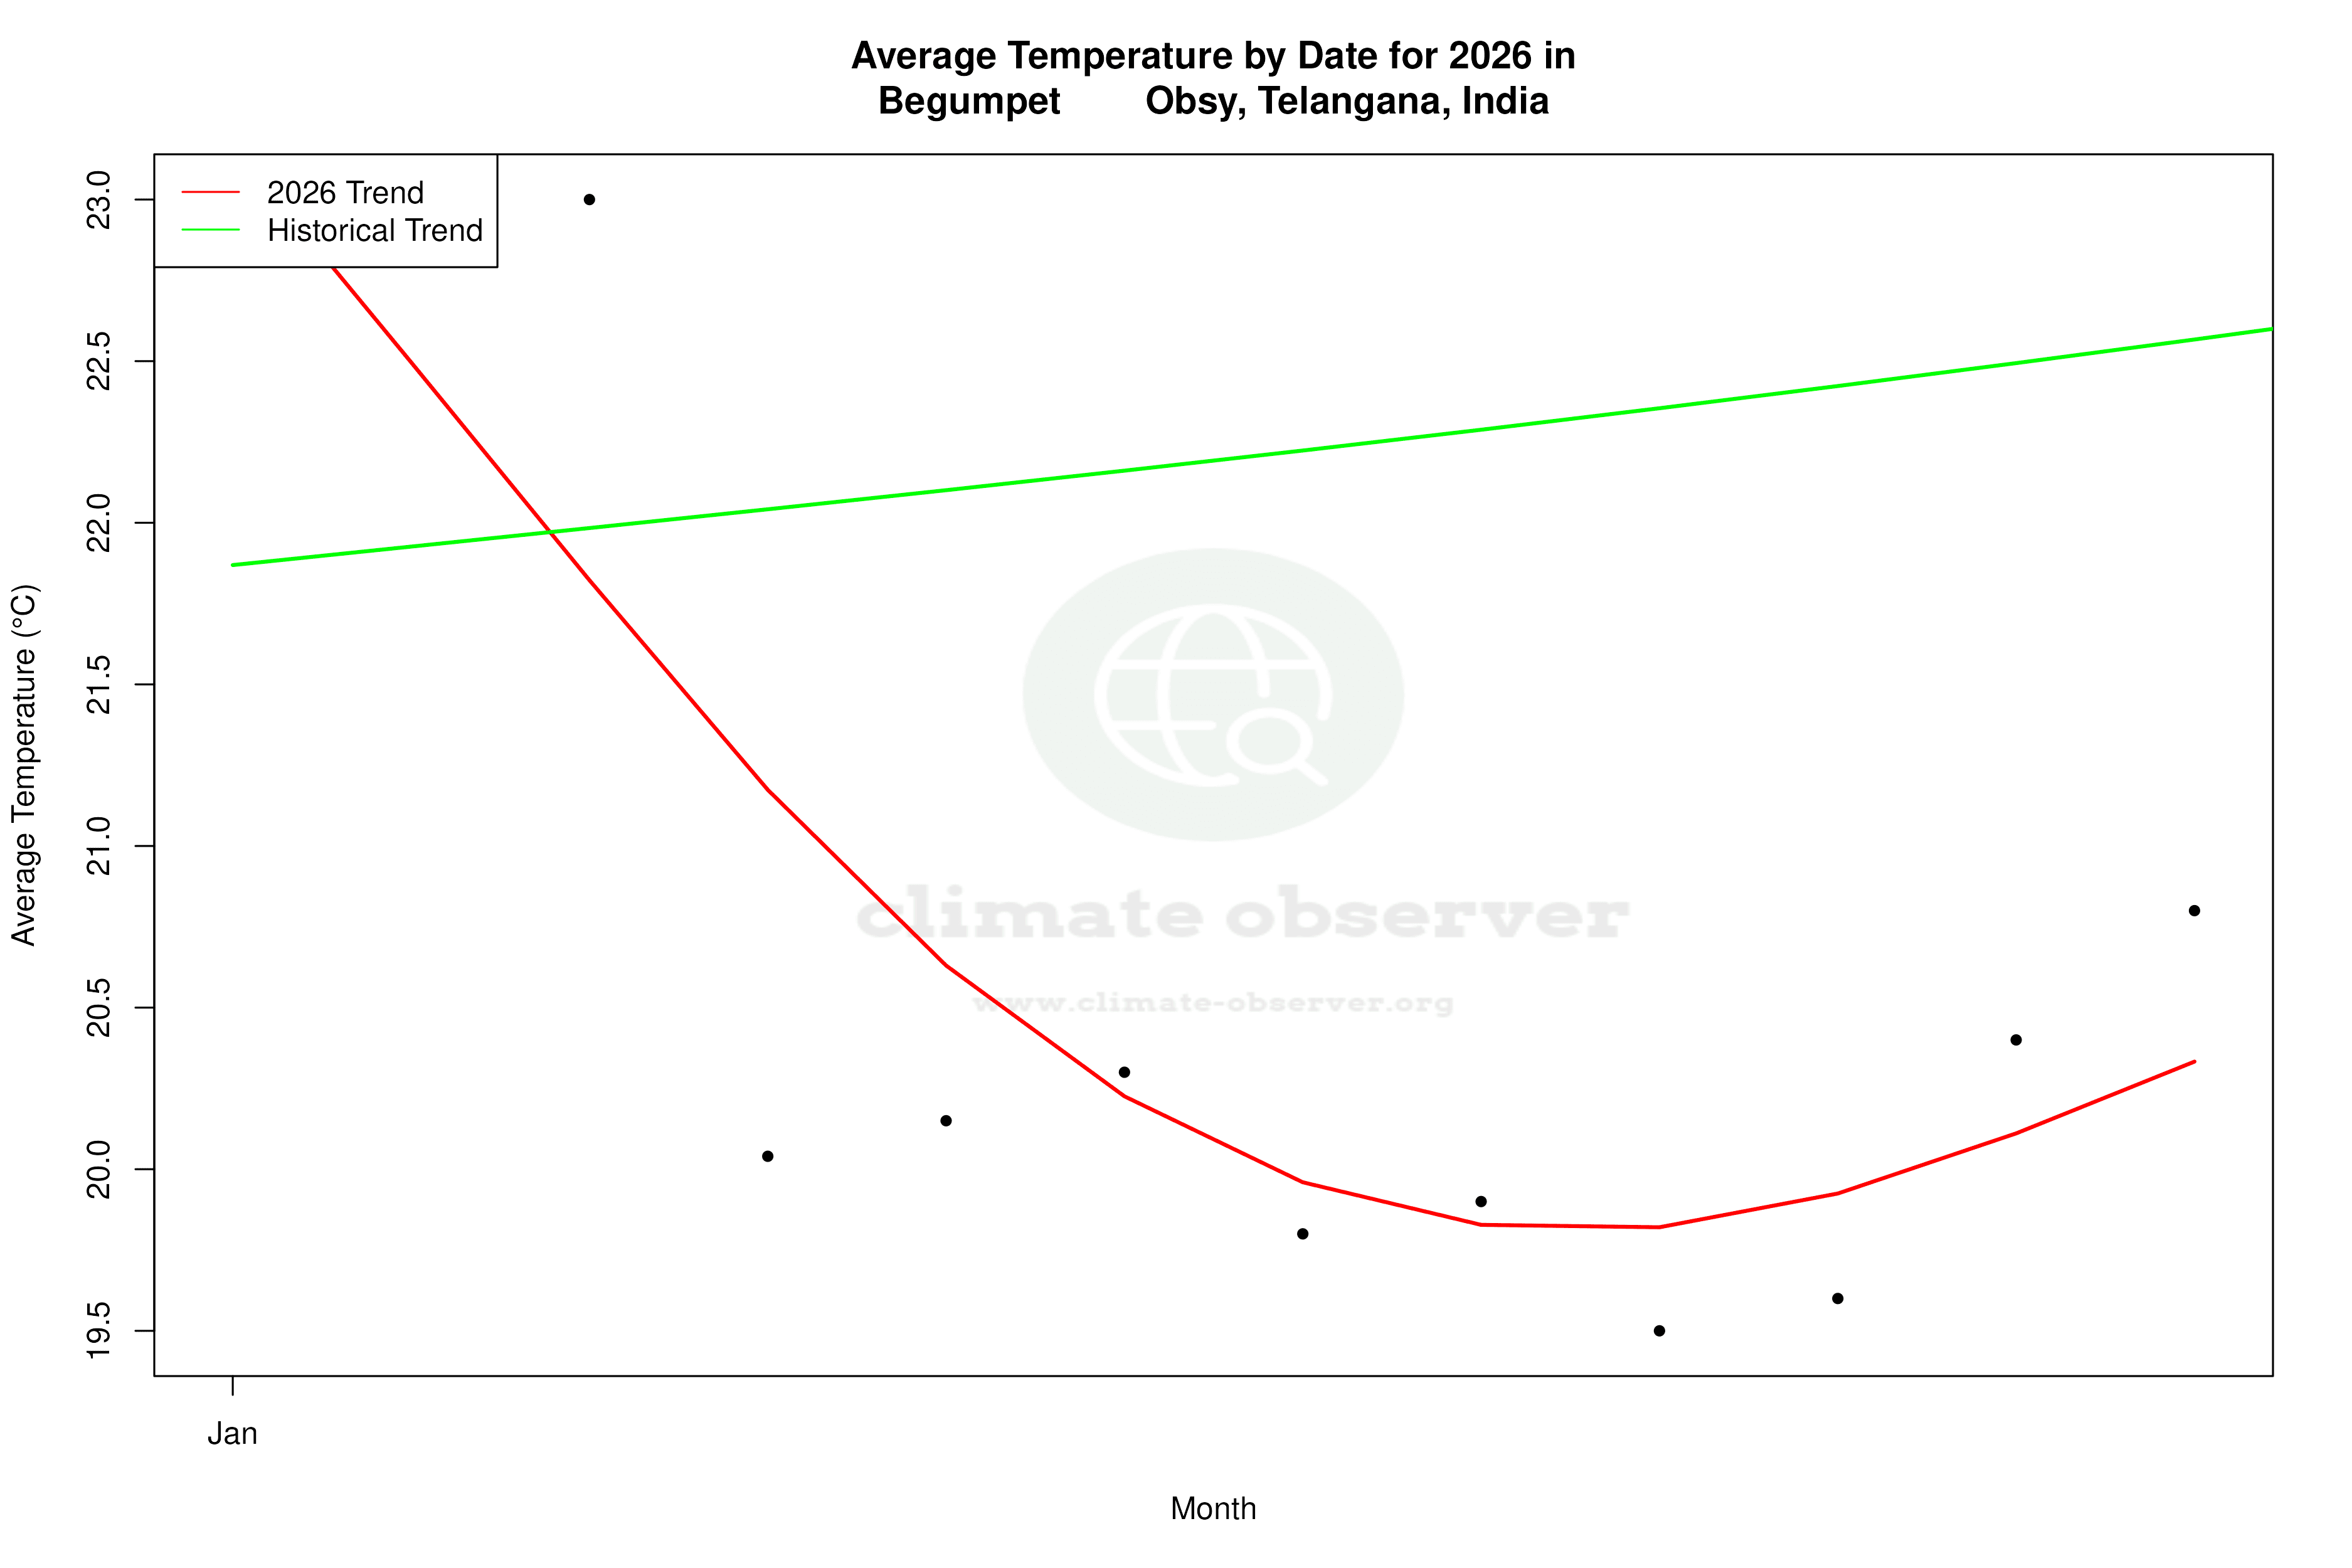
The all-time temperature trends at Begumpet Obsy suggest a gradual warming. High temperatures have risen by 0.24°C (0.43°F), while low temperatures have increased by 0.11°C (0.20°F). However, the past decade tells a different story. High temperatures have experienced a cooling trend, decreasing by 1.64°C (2.96°F), whereas low temperatures have warmed by 0.38°C (0.68°F). This divergence highlights the complexity of climate dynamics in the region, where short-term fluctuations can contrast with long-term trends.
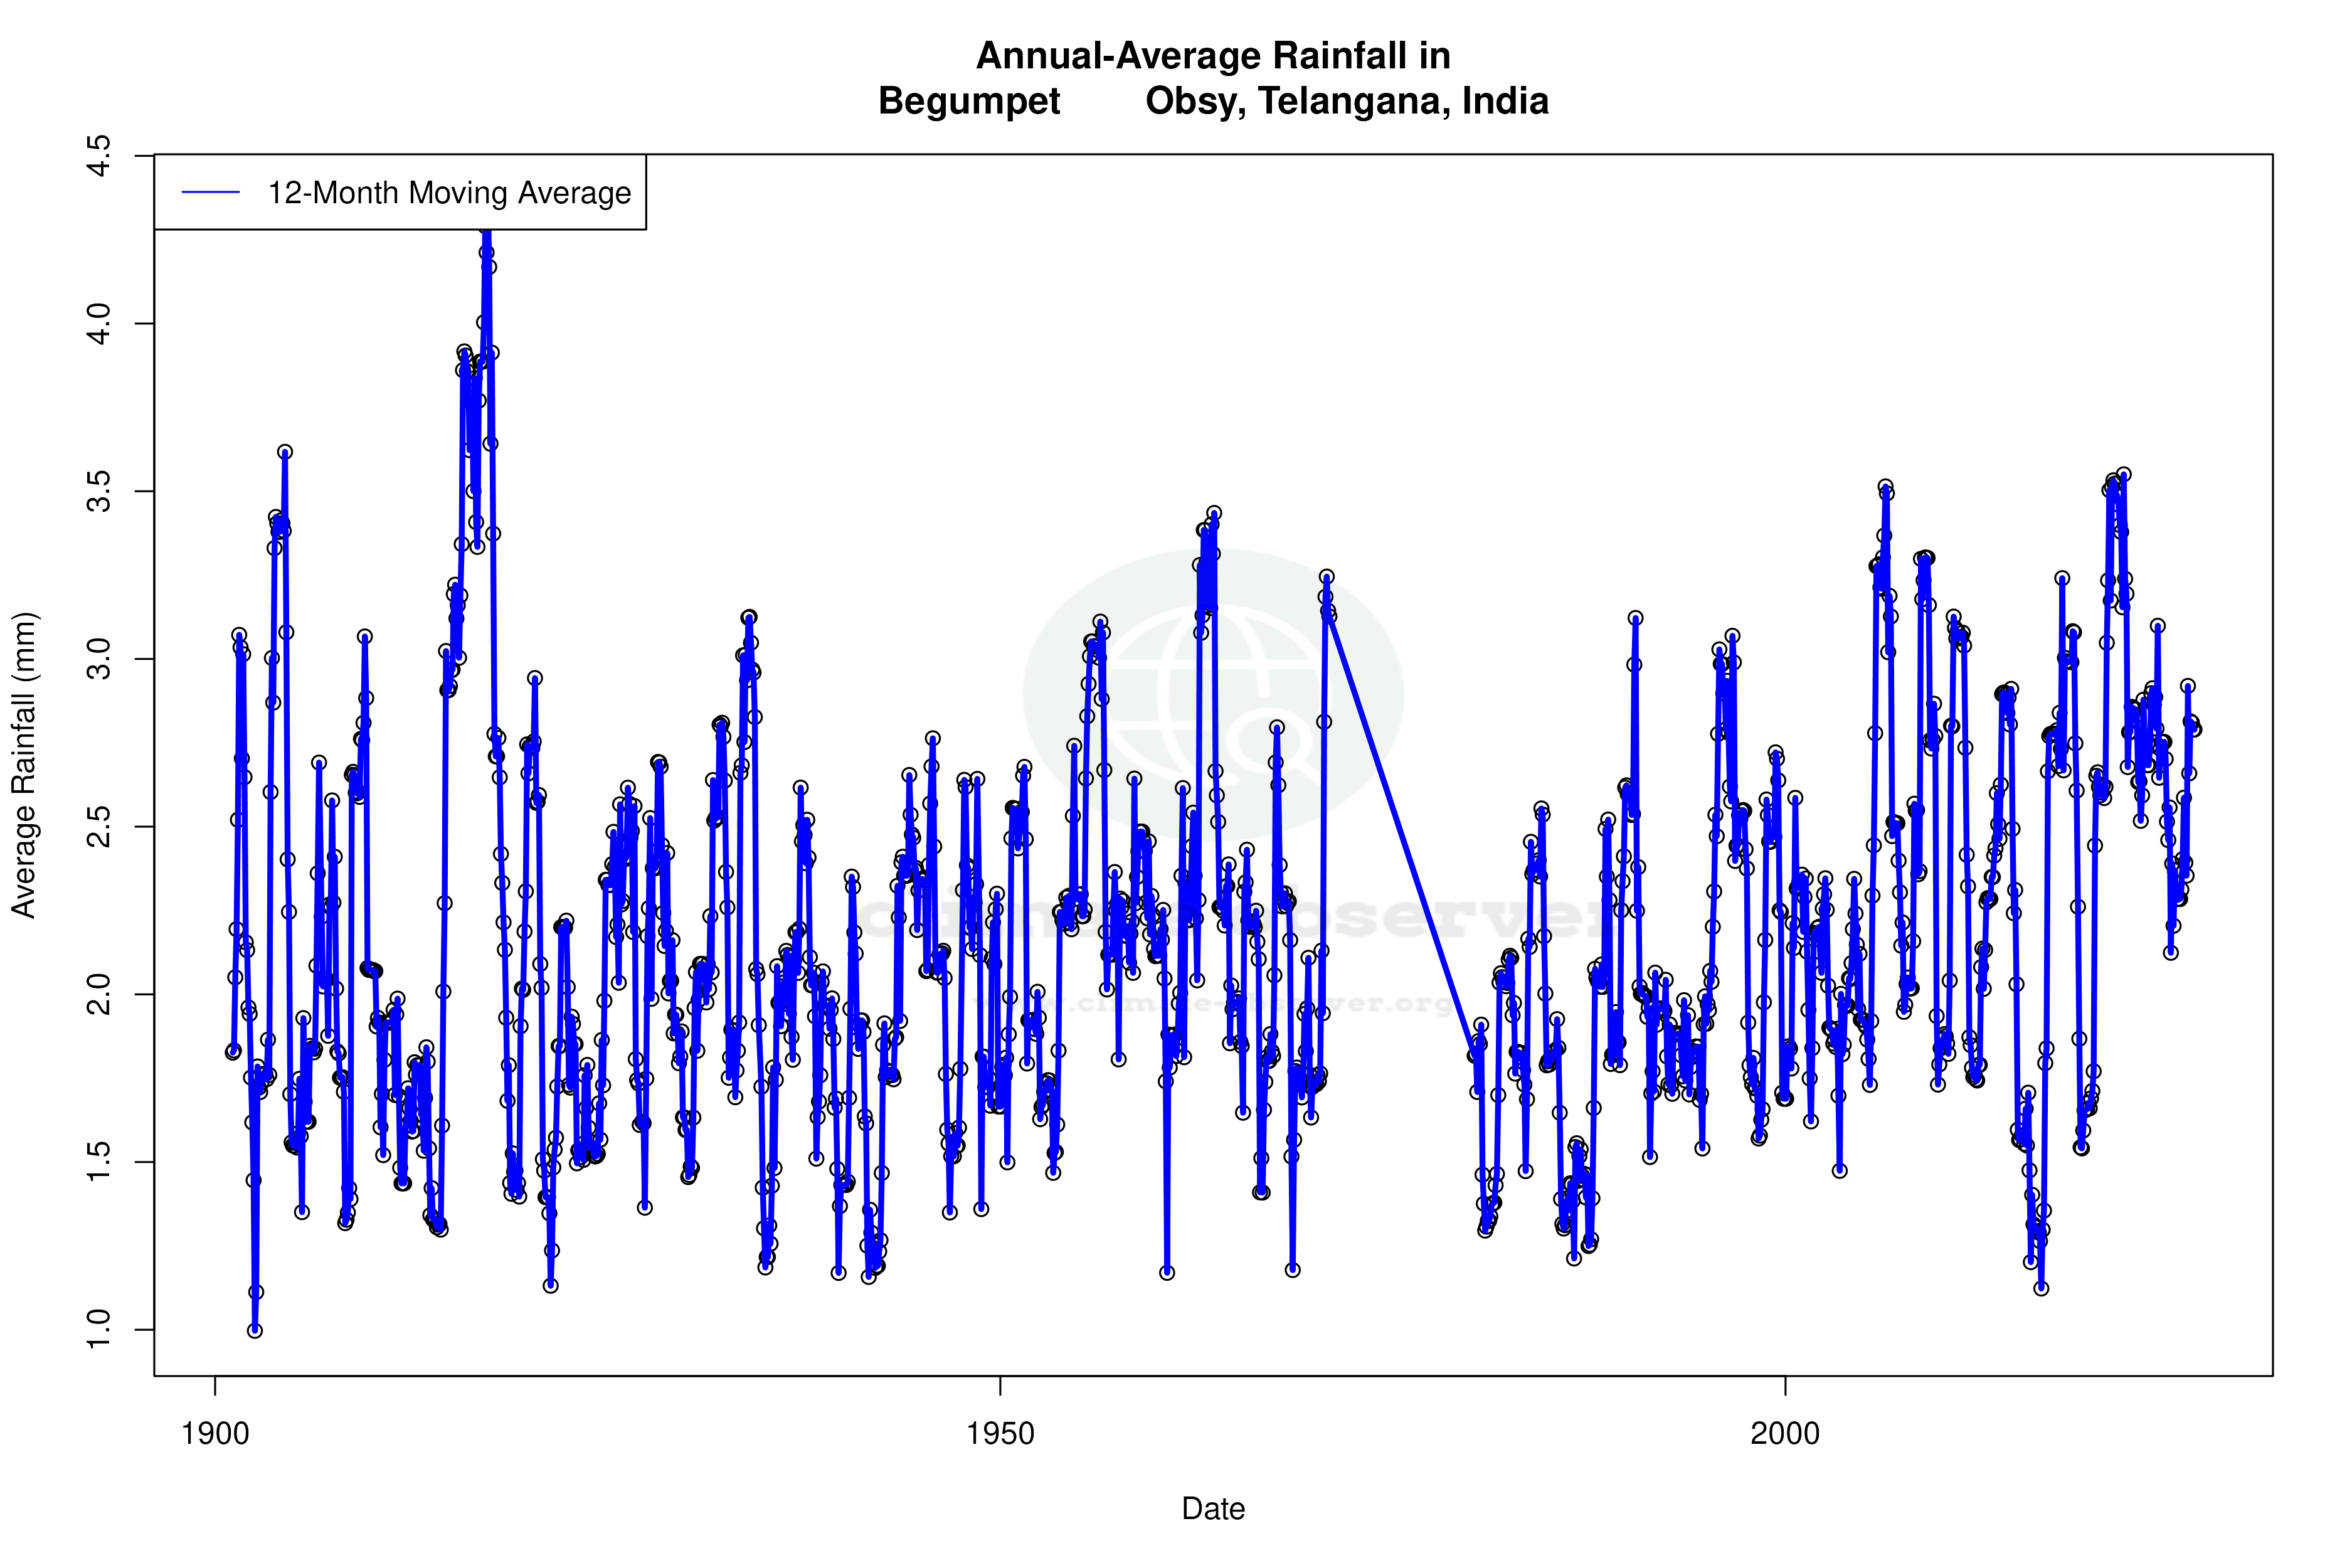
Precipitation Patterns: A Shift Towards Even Distribution
The Precipitation Concentration Index (PCI) at Begumpet Obsy has shown a decrease from a baseline of 21.65 to a current value of 19.31. The PCI measures the concentration of precipitation over time, with higher values indicating more concentrated rainfall events. This decline suggests that precipitation is now more evenly distributed throughout the year, reducing the risk of intense, isolated downpours and potentially benefiting agricultural activities in the region.
Temperature Extremes: Record Highs and Lows
The station has recorded extreme temperatures, with a maximum of 49.0°C (120.2°F) and a minimum of 6.0°C (42.8°F). These records underscore the potential for significant temperature variability in Hyderabad, reflecting both the intensity of summer heat and the occasional cool spells during winter.
Regional Climate Goals and Observations
India's commitment to climate resilience and sustainable development is crucial in the context of Begumpet Obsy's climate profile. The observed trends align with national efforts to mitigate climate change impacts, such as improving water management and agricultural practices. Recent weather events, including unseasonal rains and heatwaves, further highlight the importance of adaptive strategies to safeguard the region's socio-economic stability.
Station Statistics
10-Year Trend
High: -1.58 °C/decade
Low: +0.48 °C/decade
Rain: +0.12 mm/decade
25-Year Trend
High: -0.03 °C/decade
Low: +0.45 °C/decade
Rain: +0.21 mm/decade
50-Year Trend
High: +0.23 °C/decade
Low: +0.11 °C/decade
Rain: +0.20 mm/decade
All-Time Trend
High: +0.22 °C/decade
Low: +0.12 °C/decade
Rain: +0.02 mm/decade
Percentage Above-Average Days
Last 12 Months: 34.2%
This Year: 43.3%
Precipitation Concentration Index (PCI) ℹ️
Last 12 Months: 20.8
Historical Average: 21.2
Percentile Rank of Last 12 Months ℹ️
High: 7th percentile
Low: 83rd percentile
Rain: 84th percentile
Change in Variance ℹ️
High: -10.2%
Low: -8.3%
Intraday: +3.0%
Data Coverage
55.8%
First Year of Data
1901
Station Location
Historical Weather Records
| Max High | Avg High | Min High | Max Avg | Avg Avg | Min Avg | Max Low | Avg Low | Min Low | Max Precipitation | Avg Precipitation | Max Snow | Avg Snow | |
|---|---|---|---|---|---|---|---|---|---|---|---|---|---|
| Record | 49.0 °C | — | 20.0 °C | 38.6 °C | — | 16.1 °C | 32.2 °C | — | 6.0 °C | 190.5 mm | — | — | — |
| January | 39.5 °C | 29.6 °C | 20.0 °C | 29.1 °C | 22.9 °C | 16.1 °C | 21.6 °C | 15.7 °C | 6.0 °C | 93.2 mm | 0.2 mm | — | — |
| February | 39.1 °C | 32.5 °C | 25.0 °C | 32.3 °C | 25.7 °C | 18.6 °C | 23.1 °C | 18.0 °C | 10.0 °C | 42.9 mm | 0.3 mm | — | — |
| March | 41.6 °C | 36.0 °C | 23.7 °C | 34.7 °C | 29.1 °C | 20.7 °C | 27.6 °C | 21.3 °C | 14.0 °C | 103.1 mm | 0.4 mm | — | — |
| April | 49.0 °C | 38.5 °C | 27.5 °C | 38.0 °C | 31.8 °C | 22.3 °C | 30.0 °C | 24.5 °C | 16.0 °C | 60.7 mm | 0.8 mm | — | — |
| May | 45.0 °C | 39.5 °C | 27.0 °C | 38.6 °C | 32.9 °C | 21.5 °C | 32.2 °C | 26.3 °C | 16.7 °C | 65.0 mm | 1.0 mm | — | — |
| June | 44.0 °C | 34.8 °C | 23.6 °C | 37.6 °C | 29.2 °C | 22.3 °C | 31.1 °C | 24.2 °C | 18.2 °C | 122.7 mm | 3.6 mm | — | — |
| July | 39.0 °C | 31.2 °C | 22.8 °C | 32.3 °C | 26.6 °C | 21.1 °C | 27.3 °C | 22.7 °C | 19.0 °C | 140.5 mm | 5.5 mm | — | — |
| August | 38.0 °C | 30.4 °C | 22.1 °C | 30.6 °C | 25.9 °C | 21.3 °C | 25.8 °C | 22.3 °C | 18.0 °C | 190.5 mm | 5.1 mm | — | — |
| September | 36.5 °C | 30.9 °C | 22.0 °C | 30.9 °C | 26.2 °C | 20.4 °C | 25.9 °C | 22.2 °C | 17.5 °C | 153.2 mm | 5.6 mm | — | — |
| October | 38.2 °C | 31.0 °C | 23.3 °C | 30.8 °C | 25.8 °C | 19.1 °C | 25.0 °C | 20.5 °C | 12.9 °C | 117.1 mm | 2.7 mm | — | — |
| November | 37.0 °C | 29.7 °C | 21.8 °C | 28.7 °C | 23.8 °C | 17.7 °C | 23.7 °C | 17.5 °C | 8.0 °C | 95.5 mm | 0.8 mm | — | — |
| December | 38.0 °C | 28.9 °C | 20.6 °C | 28.4 °C | 22.2 °C | 16.2 °C | 22.5 °C | 15.2 °C | 8.5 °C | 44.5 mm | 0.2 mm | — | — |
Data Visualisations
Remove WatermarksCurrent Year Climate Trends vs Historical
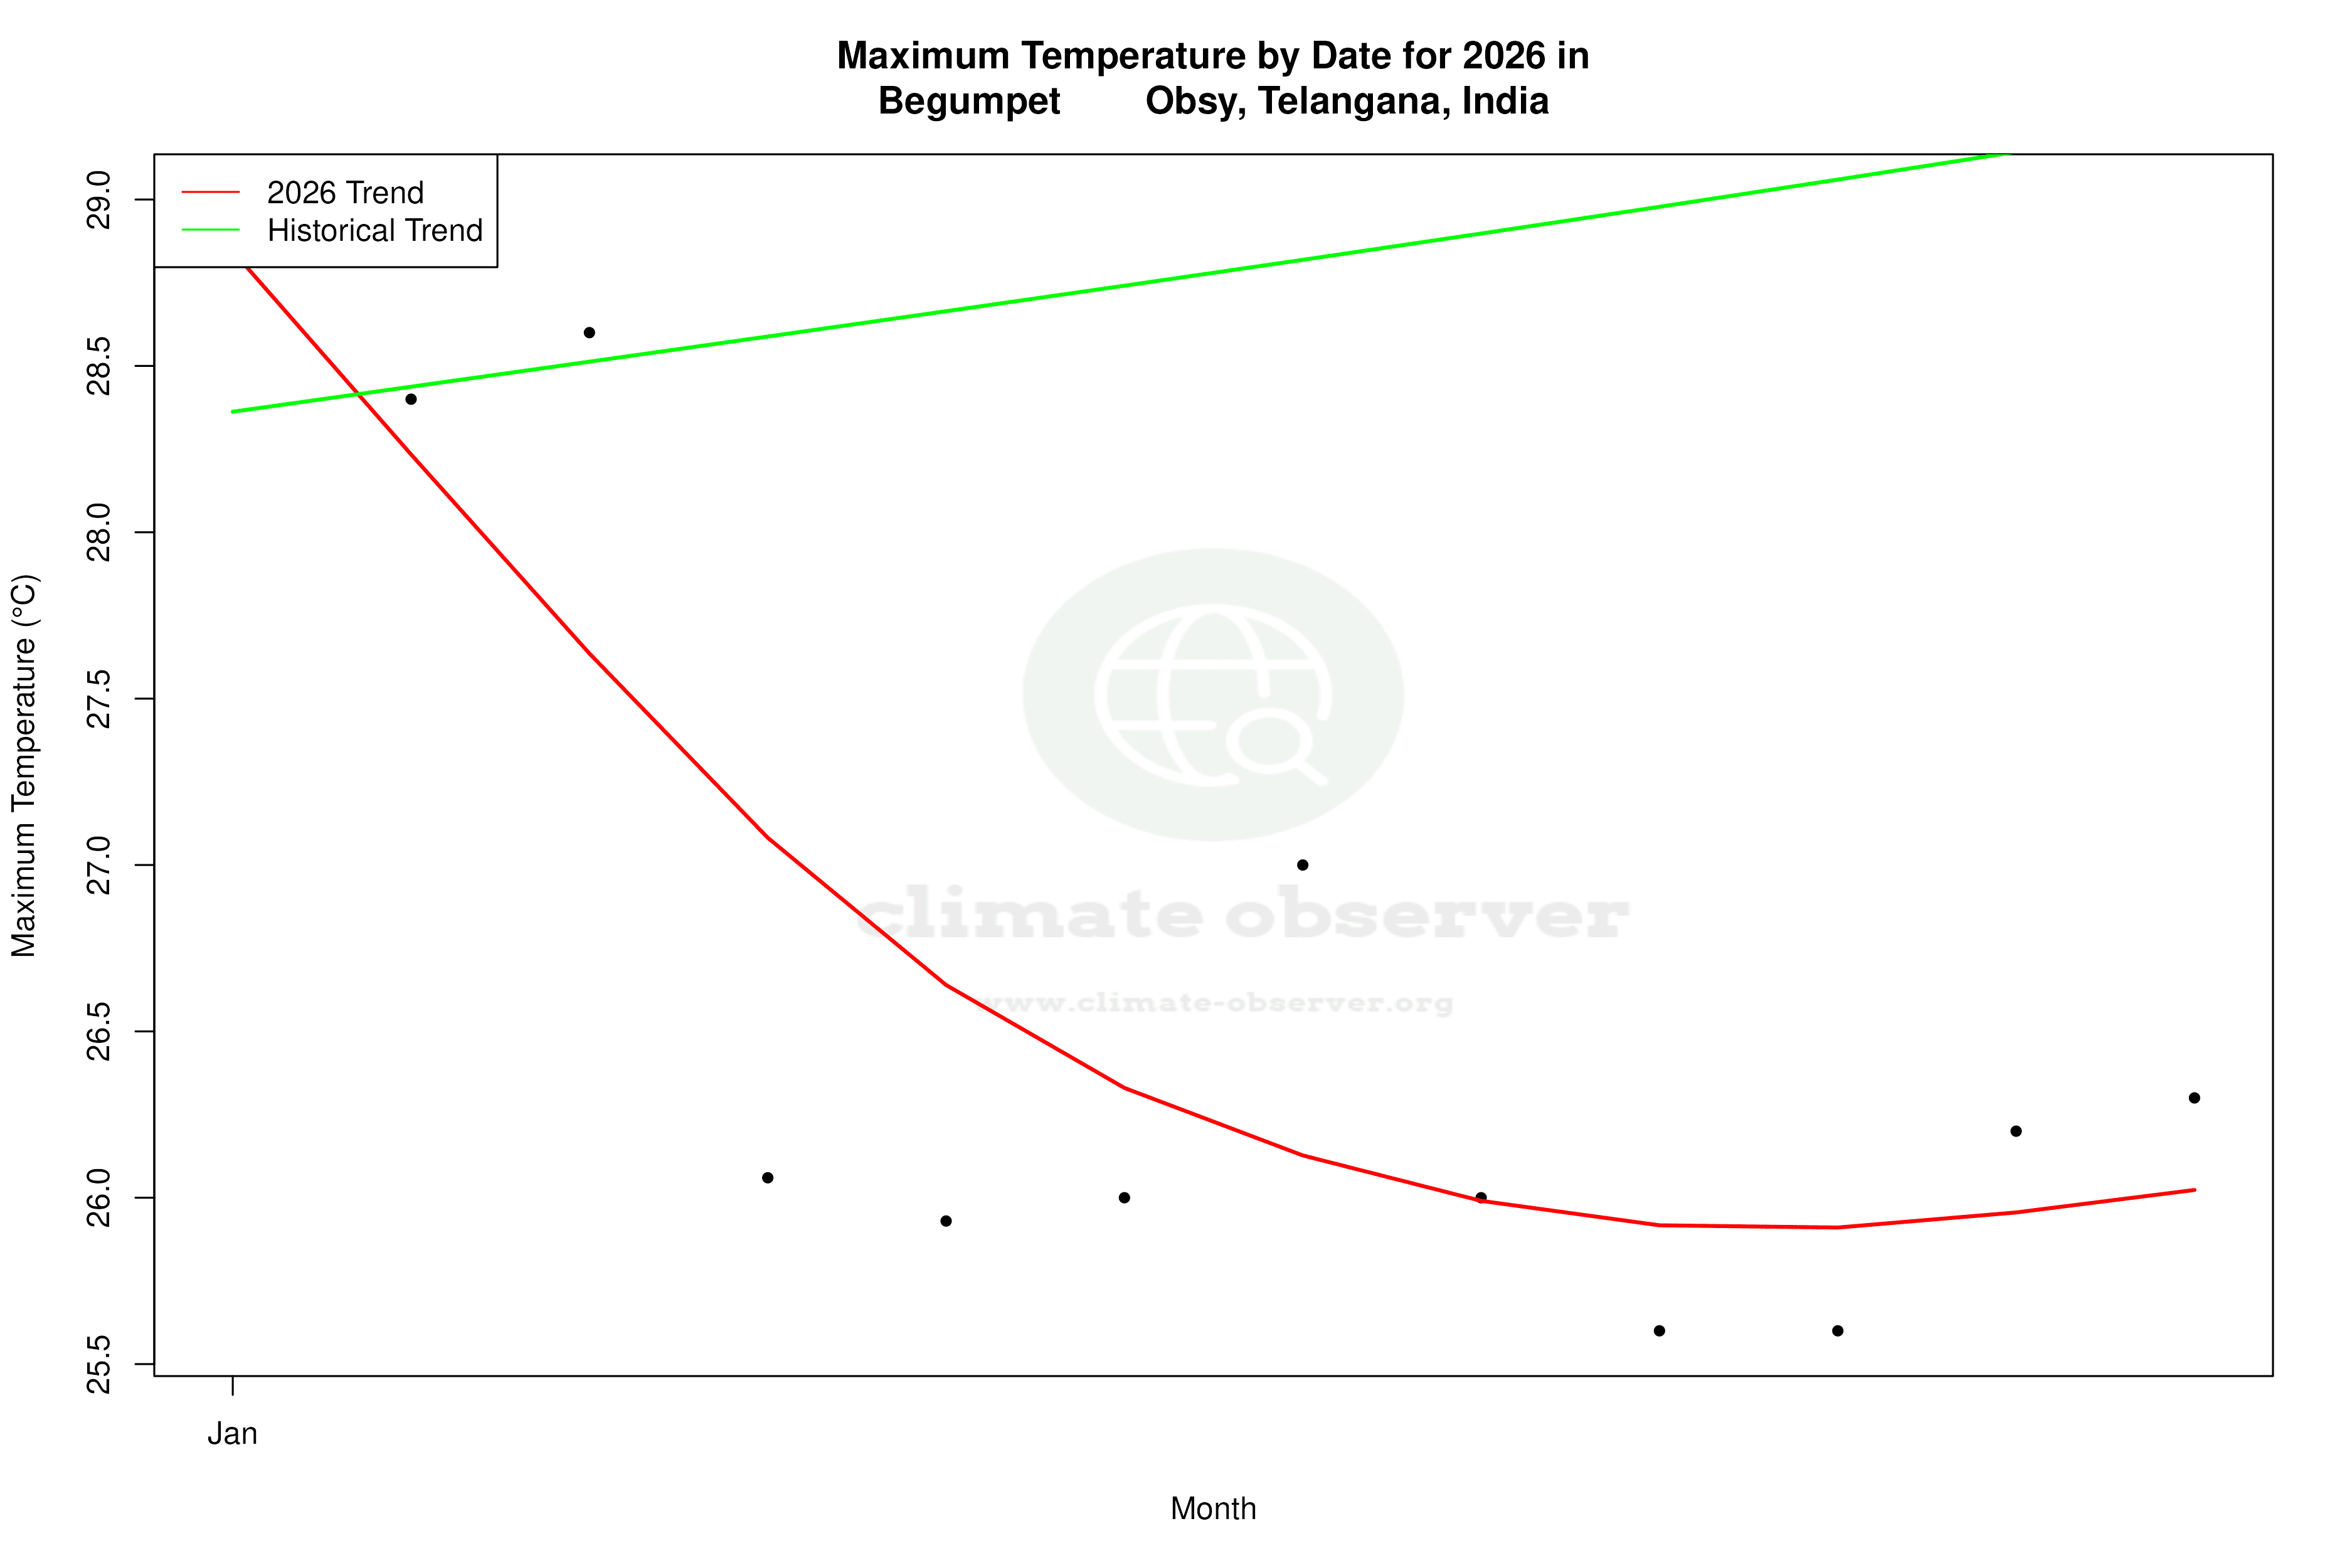


Max Temperature this Year | 1 of 6
Climate 12-Month Moving Averages

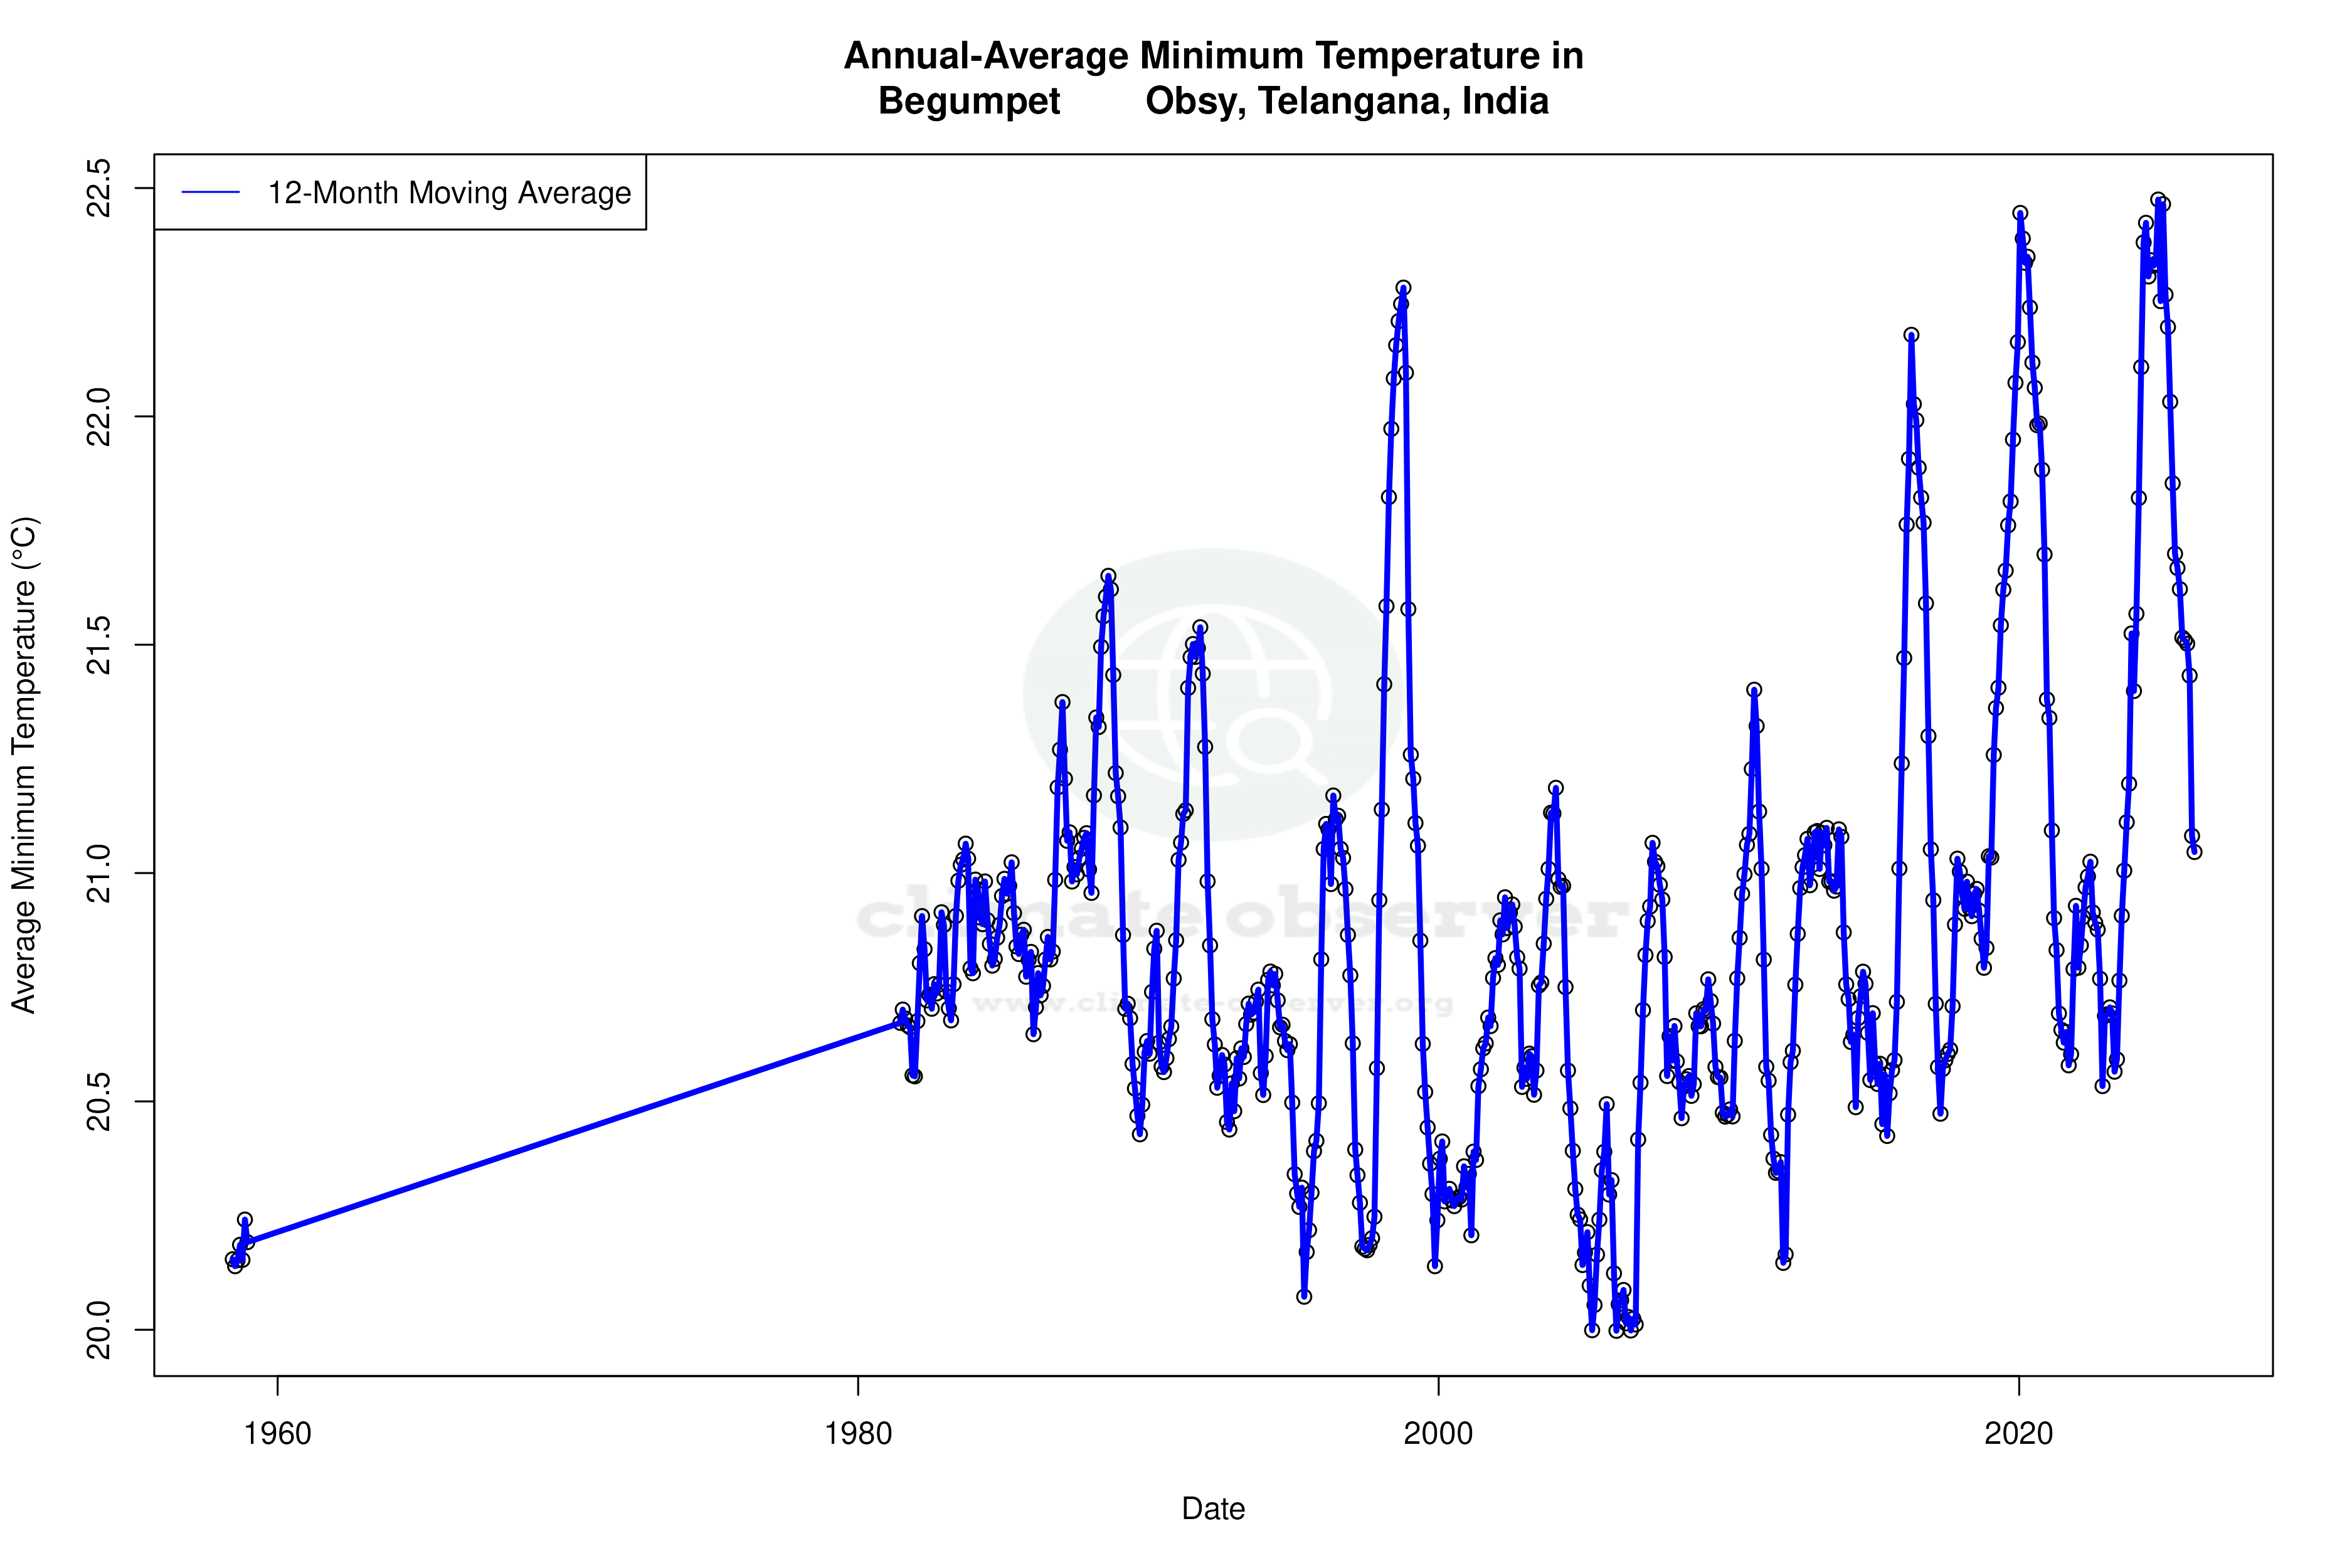


Max Temperature 12-Month MA | 1 of 6
Daily Data Points and Averages Throughout the Year


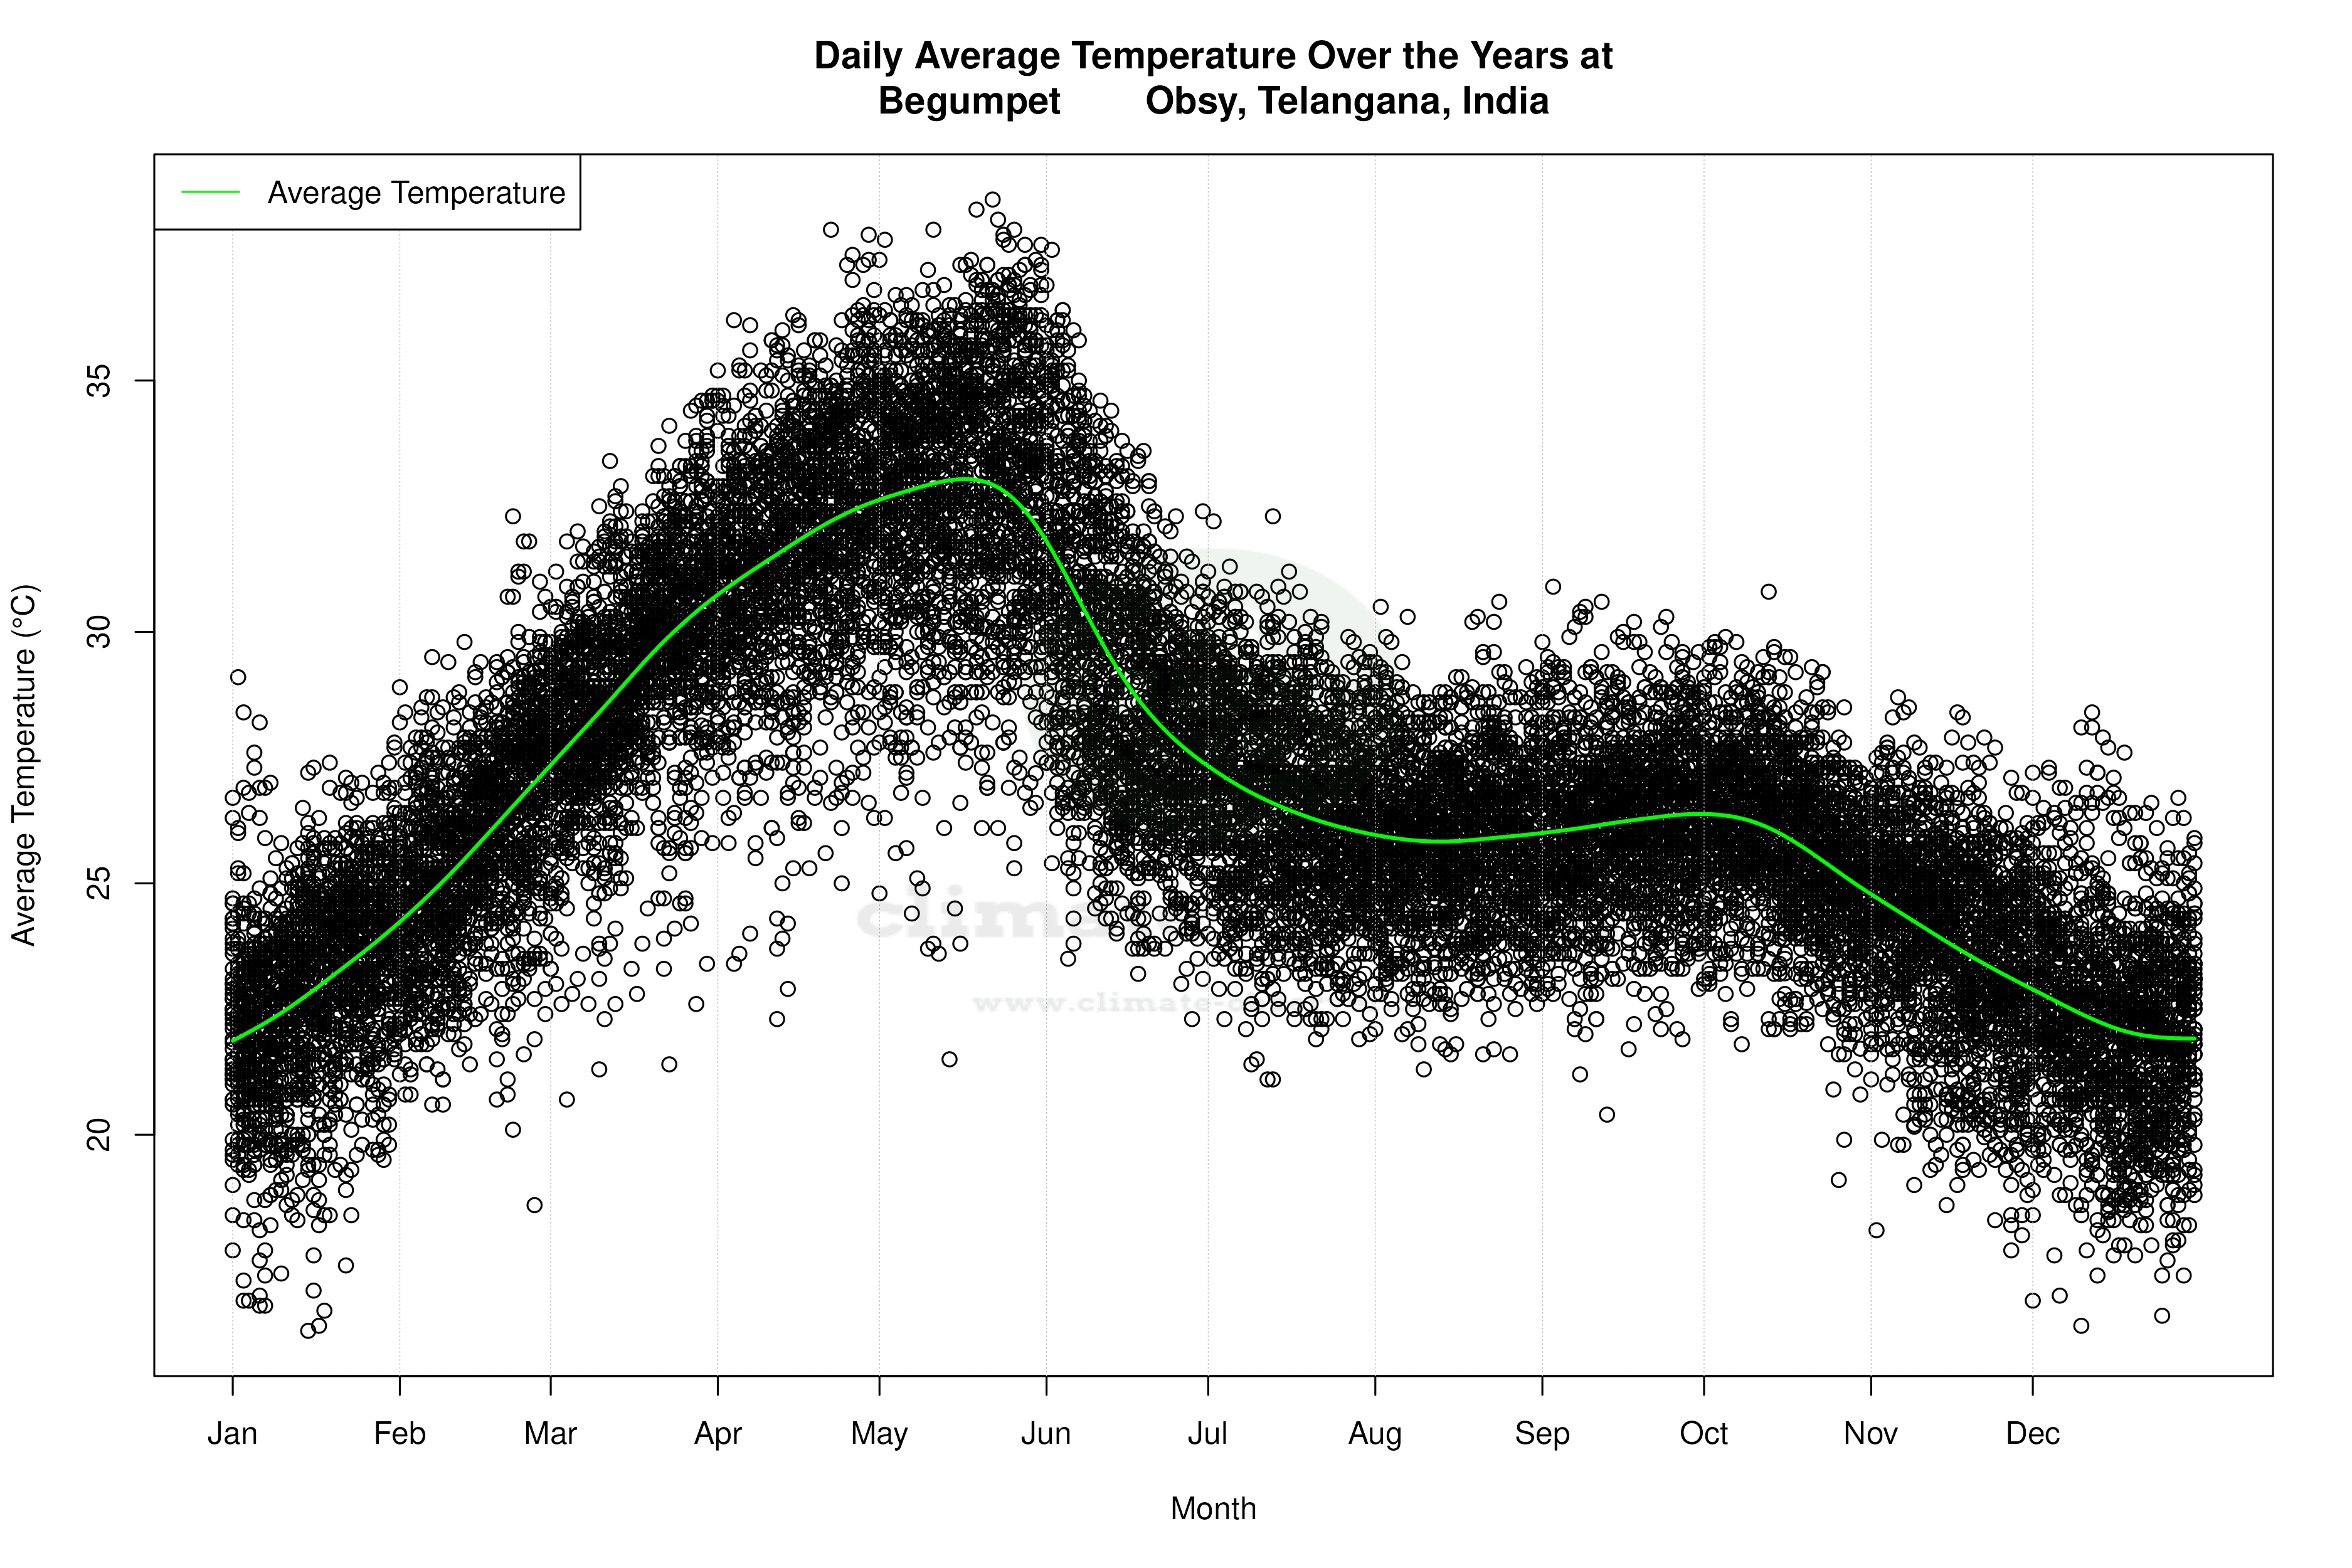


Average Max Temperature Throughout Year | 1 of 5
