Climate for Station: Machilipatnam, Andhra Pradesh, India
Loading live weather...
Climate Analysis & Overview
Machilipatnam, nestled along the eastern coast of India, exhibits a complex climate narrative. While all-time temperature trends indicate a warming of 0.59°C (1.06°F) for highs and 0.11°C (0.20°F) for lows, recent 10-year data suggests a contrasting cooling trend for highs by 0.73°C (1.31°F). Precipitation patterns have become more evenly distributed, as evidenced by a decrease in the Precipitation Concentration Index (PCI).
Coastal Influences and Climatic Classification
Machilipatnam, located at 16.2°N, 81.15°E, falls under the Tropical Wet and Dry climate classification (Aw) according to the Köppen system. Its proximity to the Bay of Bengal significantly influences local weather patterns, contributing to high humidity and substantial rainfall during the monsoon season. The geographical setting, with the coast acting as a moderating influence, often tempers extreme temperature fluctuations.
Temperature Trends: A Tale of Two Narratives
Long-term data reveals a warming trend, with all-time highs increasing by 0.59°C (1.06°F). However, recent 10-year trends indicate a cooling of 0.73°C (1.31°F) in high temperatures, suggesting a temporary deviation from the broader warming pattern. This variability may reflect regional climate anomalies or short-term meteorological events. In contrast, low temperatures have shown a marginal rise of 0.01°C (0.02°F) over the past decade, aligning with the all-time trend of 0.11°C (0.20°F).
Precipitation Patterns: A Shift Towards Even Distribution
The Precipitation Concentration Index (PCI) for Machilipatnam has decreased from a baseline of 20.06 to 16.73, indicating a shift towards more evenly distributed rainfall events. A PCI value above 20 suggests highly concentrated rainfall, while a decrease to the current level points to a more balanced distribution. This change could be beneficial for agriculture, reducing the risk of flood damage and improving water management.
Record Temperatures: Extremes in Context
Machilipatnam's recorded temperature extremes underscore the region's climatic variability. The highest recorded temperature is 47.6°C (117.7°F), while the lowest is 14.0°C (57.2°F). These records highlight the potential for significant thermal oscillations, influenced by both regional and global climatic factors.
Regional Climate Goals and Implications
India's commitment to climate resilience and sustainable development is crucial in the context of Machilipatnam's evolving climate profile. The observed trends in temperature and precipitation distribution align with broader national goals to mitigate climate change impacts. Understanding these localised patterns is essential for designing effective adaptation strategies, particularly in coastal regions vulnerable to climate variability.
Station Statistics
10-Year Trend
High: -2.22 °F/decade
Low: +0.16 °F/decade
Rain: +0.014 in/decade
25-Year Trend
High: +0.76 °F/decade
Low: +0.32 °F/decade
Rain: +0.012 in/decade
50-Year Trend
High: +1.04 °F/decade
Low: +0.21 °F/decade
Rain: +0.011 in/decade
All-Time Trend
High: +1.04 °F/decade
Low: +0.20 °F/decade
Rain: +0.001 in/decade
Percentage Above-Average Days
Last 12 Months: 28.8%
This Year: 10.9%
Precipitation Concentration Index (PCI) ℹ️
Last 12 Months: 16.5
Historical Average: 19.7
Percentile Rank of Last 12 Months ℹ️
High: 27th percentile
Low: 98th percentile
Rain: 54th percentile
Change in Variance ℹ️
High: -27.9%
Low: -14.2%
Intraday: -21.4%
Data Coverage
53.4%
First Year of Data
1988
Station Location
Historical Weather Records
| Max High | Avg High | Min High | Max Avg | Avg Avg | Min Avg | Max Low | Avg Low | Min Low | Max Precipitation | Avg Precipitation | Max Snow | Avg Snow | |
|---|---|---|---|---|---|---|---|---|---|---|---|---|---|
| Record | 117.68 °F | — | 71.42 °F | 102.92 °F | — | 66.20 °F | 91.40 °F | — | 57.20 °F | 19.78 in | — | — | — |
| January | 95.72 °F | 84.93 °F | 71.42 °F | 82.40 °F | 76.01 °F | 66.20 °F | 76.89 °F | 69.01 °F | 57.20 °F | 3.00 in | 0.01 in | — | — |
| February | 100.40 °F | 88.00 °F | 78.08 °F | 84.74 °F | 78.61 °F | 71.42 °F | 79.56 °F | 71.05 °F | 59.54 °F | 3.80 in | 0.01 in | — | — |
| March | 102.20 °F | 91.92 °F | 81.54 °F | 88.52 °F | 82.43 °F | 73.76 °F | 82.76 °F | 74.83 °F | 64.40 °F | 5.92 in | 0.01 in | — | — |
| April | 111.20 °F | 95.31 °F | 79.88 °F | 95.18 °F | 86.39 °F | 75.92 °F | 86.00 °F | 79.32 °F | 68.00 °F | 3.99 in | 0.02 in | — | — |
| May | 117.68 °F | 99.13 °F | 78.26 °F | 102.92 °F | 89.72 °F | 75.92 °F | 91.40 °F | 82.78 °F | 68.18 °F | 3.25 in | 0.05 in | — | — |
| June | 116.96 °F | 97.68 °F | 78.98 °F | 99.86 °F | 88.59 °F | 76.46 °F | 89.96 °F | 81.91 °F | 69.62 °F | 5.25 in | 0.14 in | — | — |
| July | 109.04 °F | 92.83 °F | 77.00 °F | 95.36 °F | 85.06 °F | 75.74 °F | 87.08 °F | 79.57 °F | 69.98 °F | 6.22 in | 0.24 in | — | — |
| August | 103.28 °F | 91.64 °F | 75.20 °F | 91.76 °F | 84.40 °F | 74.66 °F | 85.28 °F | 79.03 °F | 68.18 °F | 11.81 in | 0.21 in | — | — |
| September | 100.76 °F | 91.36 °F | 79.16 °F | 91.04 °F | 84.28 °F | 75.56 °F | 85.28 °F | 79.04 °F | 68.00 °F | 5.59 in | 0.23 in | — | — |
| October | 101.12 °F | 89.84 °F | 76.28 °F | 89.42 °F | 82.64 °F | 74.30 °F | 83.48 °F | 77.26 °F | 66.56 °F | 19.78 in | 0.28 in | — | — |
| November | 96.80 °F | 87.24 °F | 74.84 °F | 85.82 °F | 79.47 °F | 67.82 °F | 81.32 °F | 73.29 °F | 59.00 °F | 18.30 in | 0.15 in | — | — |
| December | 94.28 °F | 84.92 °F | 72.68 °F | 82.40 °F | 76.49 °F | 67.64 °F | 79.16 °F | 69.61 °F | 59.00 °F | 6.27 in | 0.02 in | — | — |
Data Visualisations
Remove WatermarksCurrent Year Climate Trends vs Historical


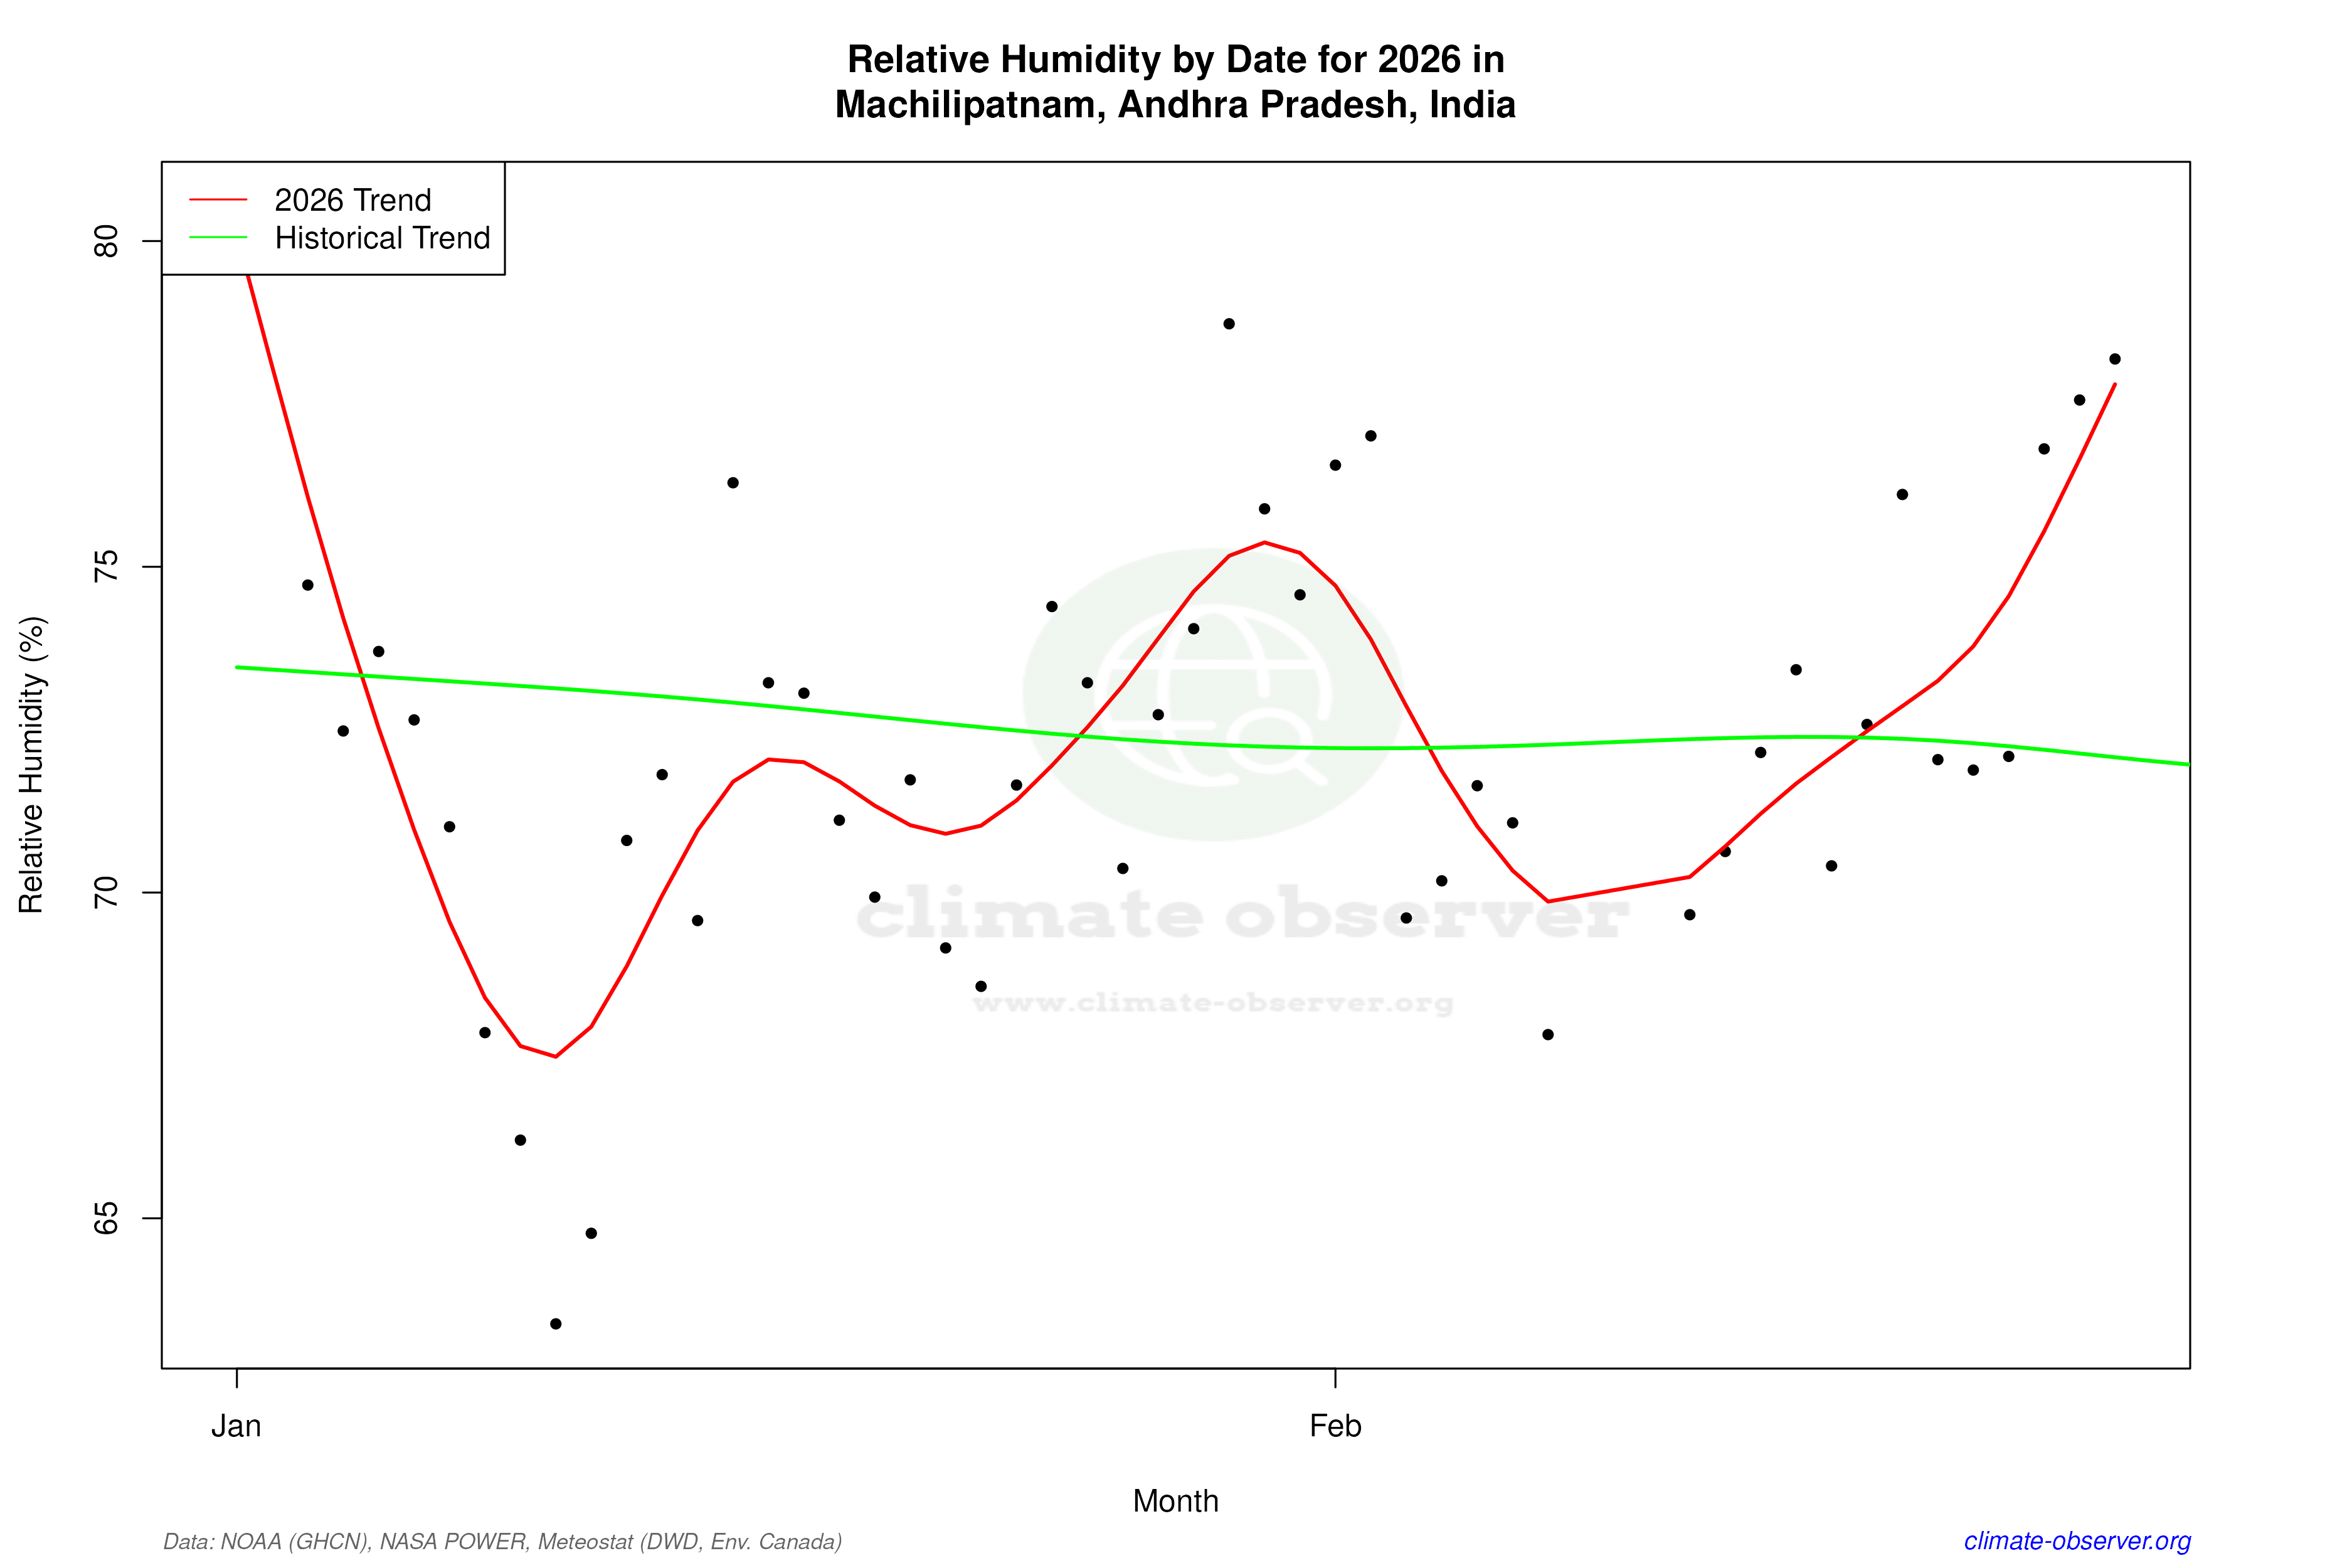

Max Temperature this Year | 1 of 6
Climate 12-Month Moving Averages


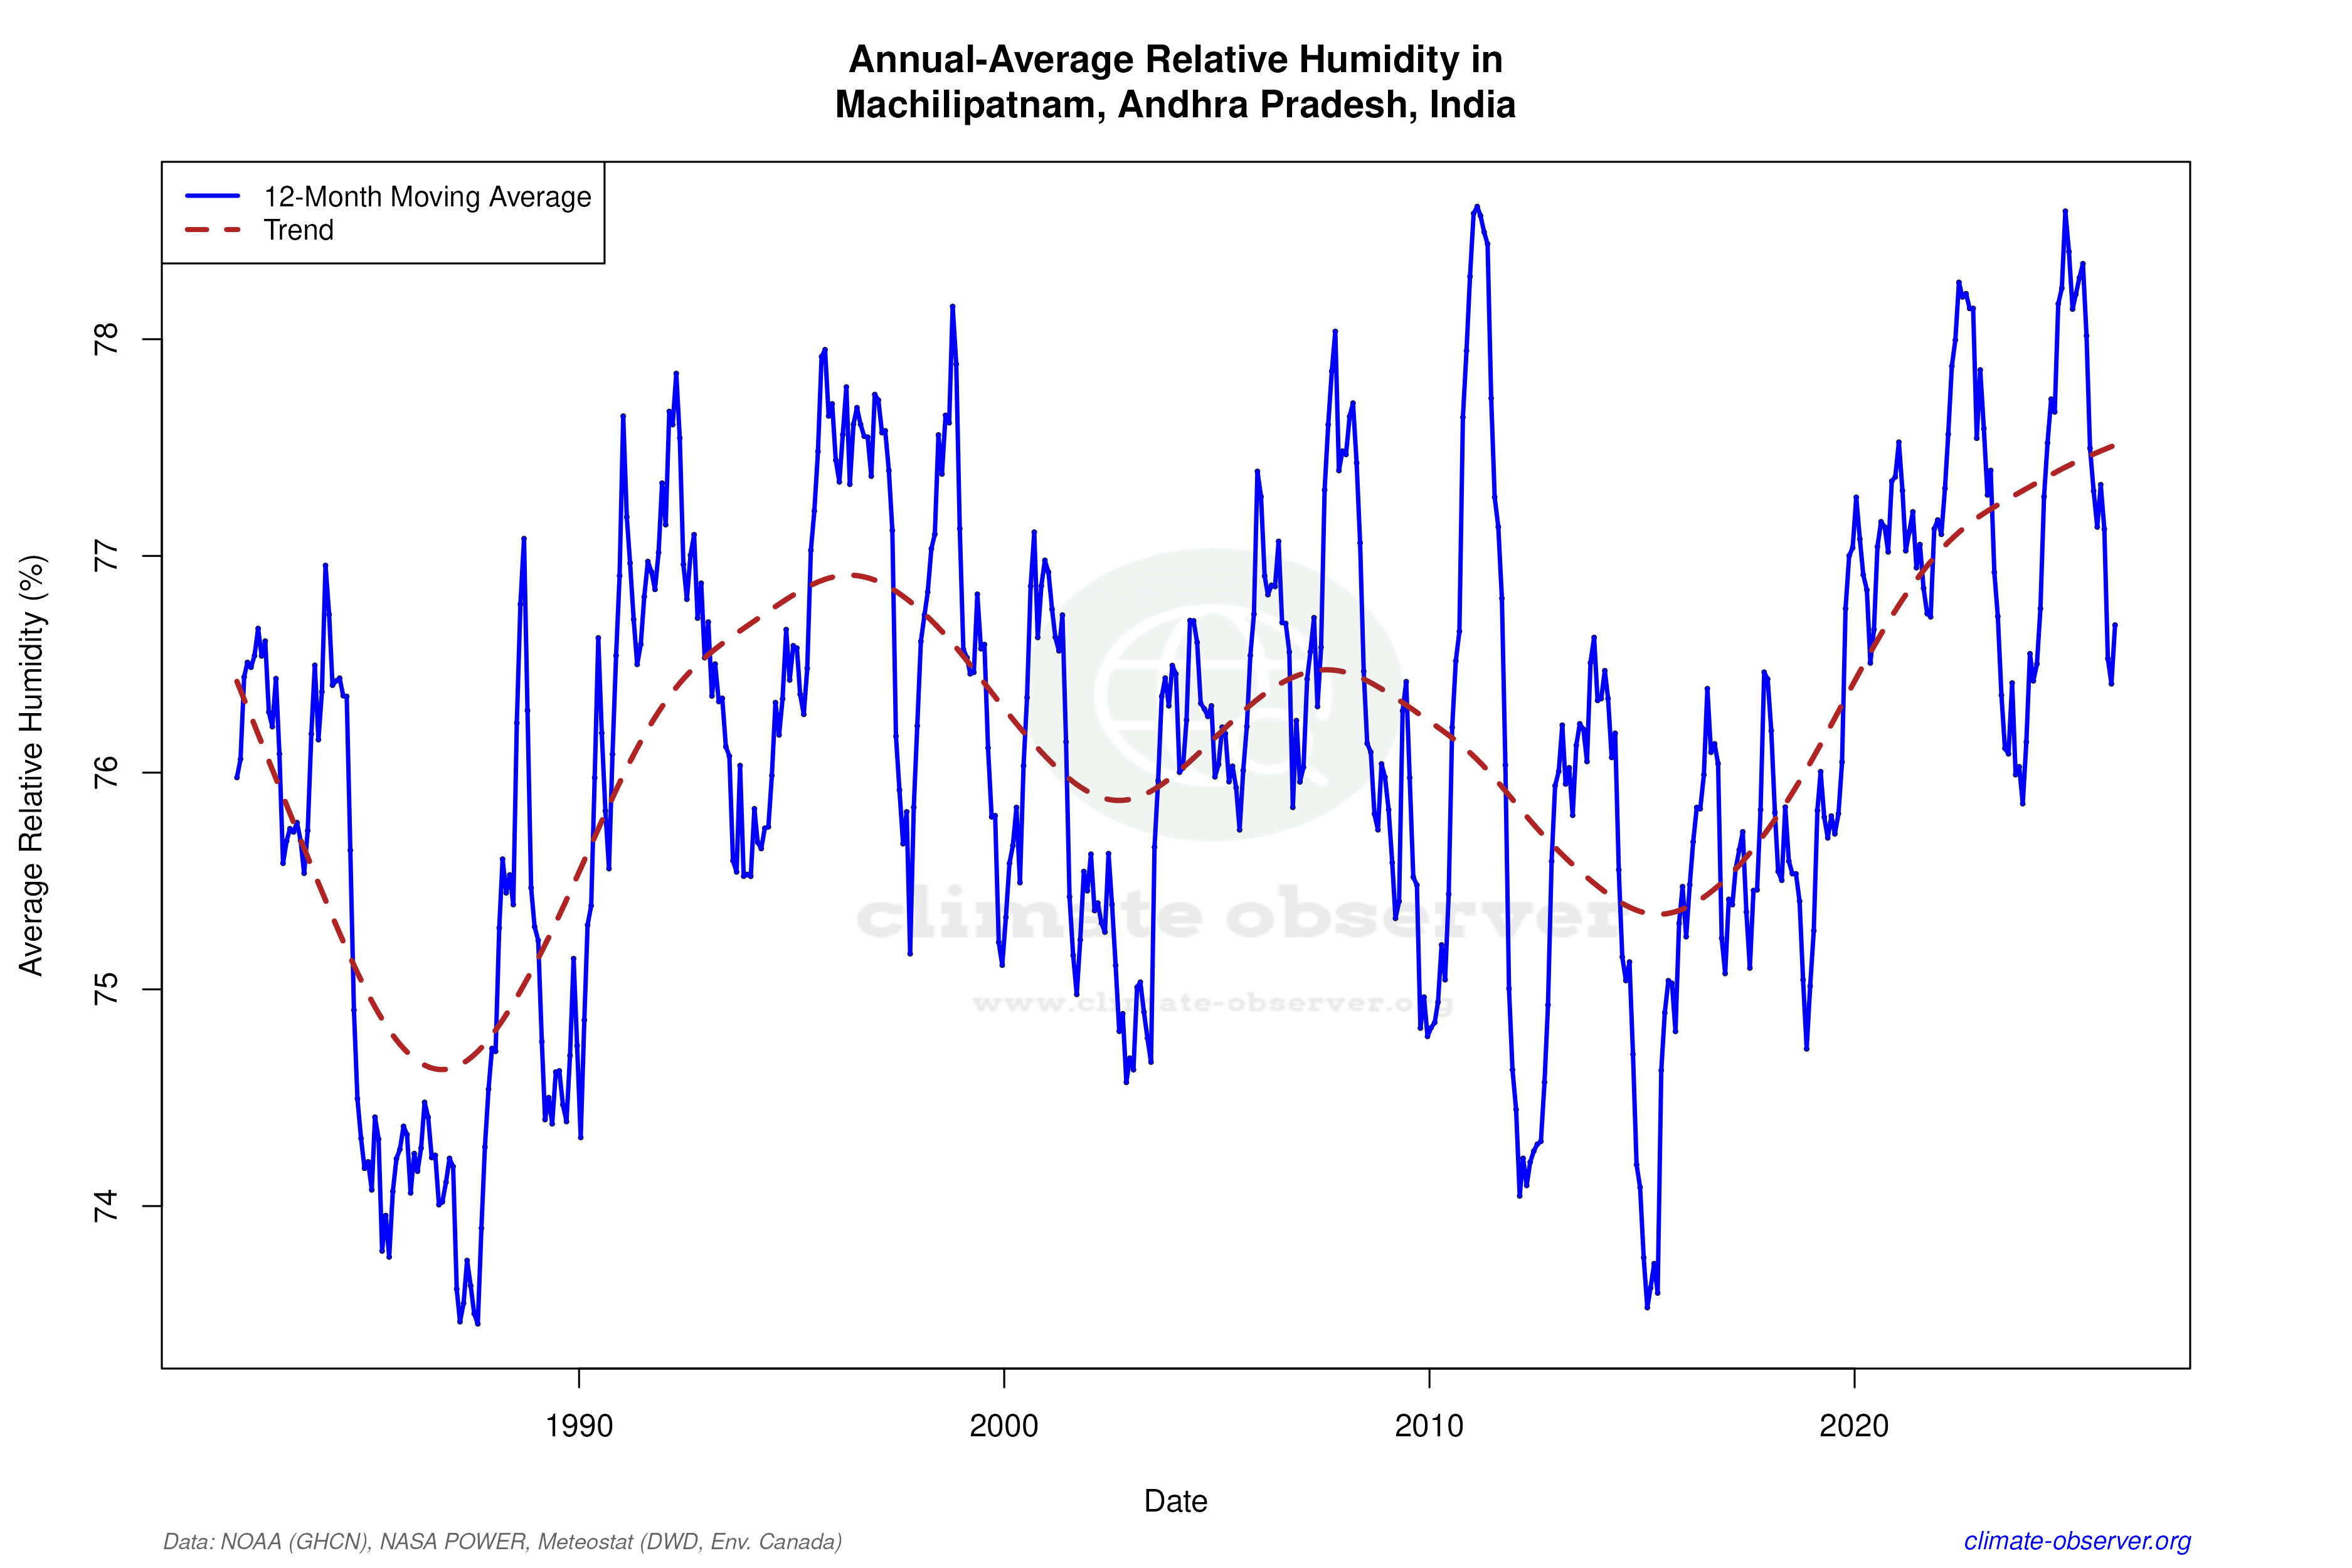

Max Temperature 12-Month MA | 1 of 6
Daily Data Points and Averages Throughout the Year


Average Max Temperature Throughout Year | 1 of 5
