Climate for Station: Srinagar, Jammu and Kashmir, India
Loading live weather...
Climate Analysis & Overview
Srinagar, nestled in the Kashmir Valley, is experiencing a warming trend with significant temperature increases over the past decade. The city's climate, influenced by its mountainous surroundings, shows a shift towards more evenly distributed precipitation patterns.
Warming Trends in the Kashmir Valley
Srinagar, located at 34.083°N, 74.833°E, falls under the Köppen climate classification of Cfa, indicating a humid subtropical climate. The city's unique geographical setting, surrounded by the Pir Panjal range, significantly impacts its weather patterns. Over the past decade, Srinagar has witnessed a notable warming, with average high temperatures increasing by 5.61°C (10.10°F) and lows by 1.85°C (3.32°F). This recent trend is more pronounced than the all-time warming, where highs have risen by 0.41°C (0.74°F) and lows by 0.72°C (1.30°F). Despite the long-term warming, the past decade's accelerated increase highlights a concerning shift in the local climate dynamics.
Temperature Extremes and Records
Srinagar has recorded extreme temperatures, with a maximum of 39.7°C (103.5°F) and a minimum of -19.97°C (-3.95°F). These records underscore the city's capacity for both intense heat and severe cold, reflecting its continental climate influences. The warming trend, particularly in the last decade, suggests that these extremes might become more frequent, posing challenges for local infrastructure and agriculture.
Precipitation Patterns and Distribution
The Precipitation Concentration Index (PCI) is a measure of how rainfall is distributed throughout the year. Srinagar's PCI has decreased from a baseline of 14.56 to a current value of 10.01. This significant reduction indicates that precipitation is now more evenly spread across the year, reducing the risk of intense, concentrated rainfall events that can lead to flooding. This shift towards a more balanced distribution of precipitation is a positive development for the region, potentially mitigating some impacts of climate change.
Regional Climate Goals and Implications
India's commitment to addressing climate change includes enhancing climate resilience in vulnerable regions like Jammu and Kashmir. The observed warming and changes in precipitation patterns in Srinagar align with broader regional climate trends. These shifts necessitate adaptive strategies to safeguard the local environment and economy. Recent weather events, such as unseasonal rainfall and heatwaves, further highlight the urgency of implementing effective climate action plans.
Future Considerations for Srinagar
The dual trends of warming and more evenly distributed precipitation suggest a complex future for Srinagar's climate. As the city continues to experience these changes, understanding the interplay between temperature and precipitation will be crucial for developing sustainable adaptation strategies. The ongoing monitoring of these trends will provide valuable insights into the evolving climate narrative of this picturesque yet vulnerable region.
Station Statistics
10-Year Trend
High: +5.71 °C/decade
Low: +0.84 °C/decade
Rain: +0.98 mm/decade
25-Year Trend
High: -0.98 °C/decade
Low: +0.61 °C/decade
Rain: +0.59 mm/decade
50-Year Trend
High: +0.42 °C/decade
Low: +0.67 °C/decade
Rain: +0.20 mm/decade
All-Time Trend
High: +0.42 °C/decade
Low: +0.67 °C/decade
Rain: +0.03 mm/decade
Percentage Above-Average Days
Last 12 Months: 58.4%
This Year: 27.5%
Precipitation Concentration Index (PCI) ℹ️
Last 12 Months: 10.0
Historical Average: 15.0
Percentile Rank of Last 12 Months ℹ️
High: 83rd percentile
Low: 96th percentile
Rain: 97th percentile
Change in Variance ℹ️
High: -10.5%
Low: +4.8%
Intraday: +0.4%
Data Coverage
53.9%
First Year of Data
1901
Station Location
Historical Weather Records
| Max High | Avg High | Min High | Max Avg | Avg Avg | Min Avg | Max Low | Avg Low | Min Low | Max Precipitation | Avg Precipitation | Max Snow | Avg Snow | |
|---|---|---|---|---|---|---|---|---|---|---|---|---|---|
| Record | 39.7 °C | — | -6.3 °C | 31.7 °C | — | -9.2 °C | 25.0 °C | — | -20.0 °C | 199.9 mm | — | — | — |
| January | 15.8 °C | 6.5 °C | -6.3 °C | 8.5 °C | 1.5 °C | -8.6 °C | 5.5 °C | -3.6 °C | -17.7 °C | 147.8 mm | 2.1 mm | — | — |
| February | 20.0 °C | 9.0 °C | -4.5 °C | 11.6 °C | 4.1 °C | -7.5 °C | 7.4 °C | -1.5 °C | -20.0 °C | 77.4 mm | 2.6 mm | — | — |
| March | 27.0 °C | 13.9 °C | -1.8 °C | 19.7 °C | 8.7 °C | -5.3 °C | 12.2 °C | 2.3 °C | -15.3 °C | 88.9 mm | 3.3 mm | — | — |
| April | 30.0 °C | 19.3 °C | 2.9 °C | 24.6 °C | 13.5 °C | -0.5 °C | 14.3 °C | 6.4 °C | -8.7 °C | 84.1 mm | 3.1 mm | — | — |
| May | 34.2 °C | 23.7 °C | 7.2 °C | 26.1 °C | 17.5 °C | 4.0 °C | 18.2 °C | 10.0 °C | -0.4 °C | 60.2 mm | 2.0 mm | — | — |
| June | 39.7 °C | 27.7 °C | 12.0 °C | 31.7 °C | 21.4 °C | 9.5 °C | 25.0 °C | 13.8 °C | 4.4 °C | 65.8 mm | 1.3 mm | — | — |
| July | 37.0 °C | 29.1 °C | 16.4 °C | 31.4 °C | 23.6 °C | 14.1 °C | 24.8 °C | 17.2 °C | 8.2 °C | 199.9 mm | 2.0 mm | — | — |
| August | 36.0 °C | 28.8 °C | 15.0 °C | 30.1 °C | 23.0 °C | 13.9 °C | 24.2 °C | 16.7 °C | 7.3 °C | 67.3 mm | 2.1 mm | — | — |
| September | 33.8 °C | 26.6 °C | 13.0 °C | 26.5 °C | 19.4 °C | 8.4 °C | 21.4 °C | 12.1 °C | 0.9 °C | 102.4 mm | 1.3 mm | — | — |
| October | 31.1 °C | 21.5 °C | 5.0 °C | 23.1 °C | 13.3 °C | 3.2 °C | 18.1 °C | 5.7 °C | -1.9 °C | 65.4 mm | 1.0 mm | — | — |
| November | 24.4 °C | 14.8 °C | 1.0 °C | 16.0 °C | 7.1 °C | -3.0 °C | 8.5 °C | 0.7 °C | -12.7 °C | 79.1 mm | 0.7 mm | — | — |
| December | 18.0 °C | 9.1 °C | -4.2 °C | 9.9 °C | 2.8 °C | -9.2 °C | 5.2 °C | -2.4 °C | -16.4 °C | 100.7 mm | 1.2 mm | — | — |
Data Visualisations
Remove WatermarksCurrent Year Climate Trends vs Historical
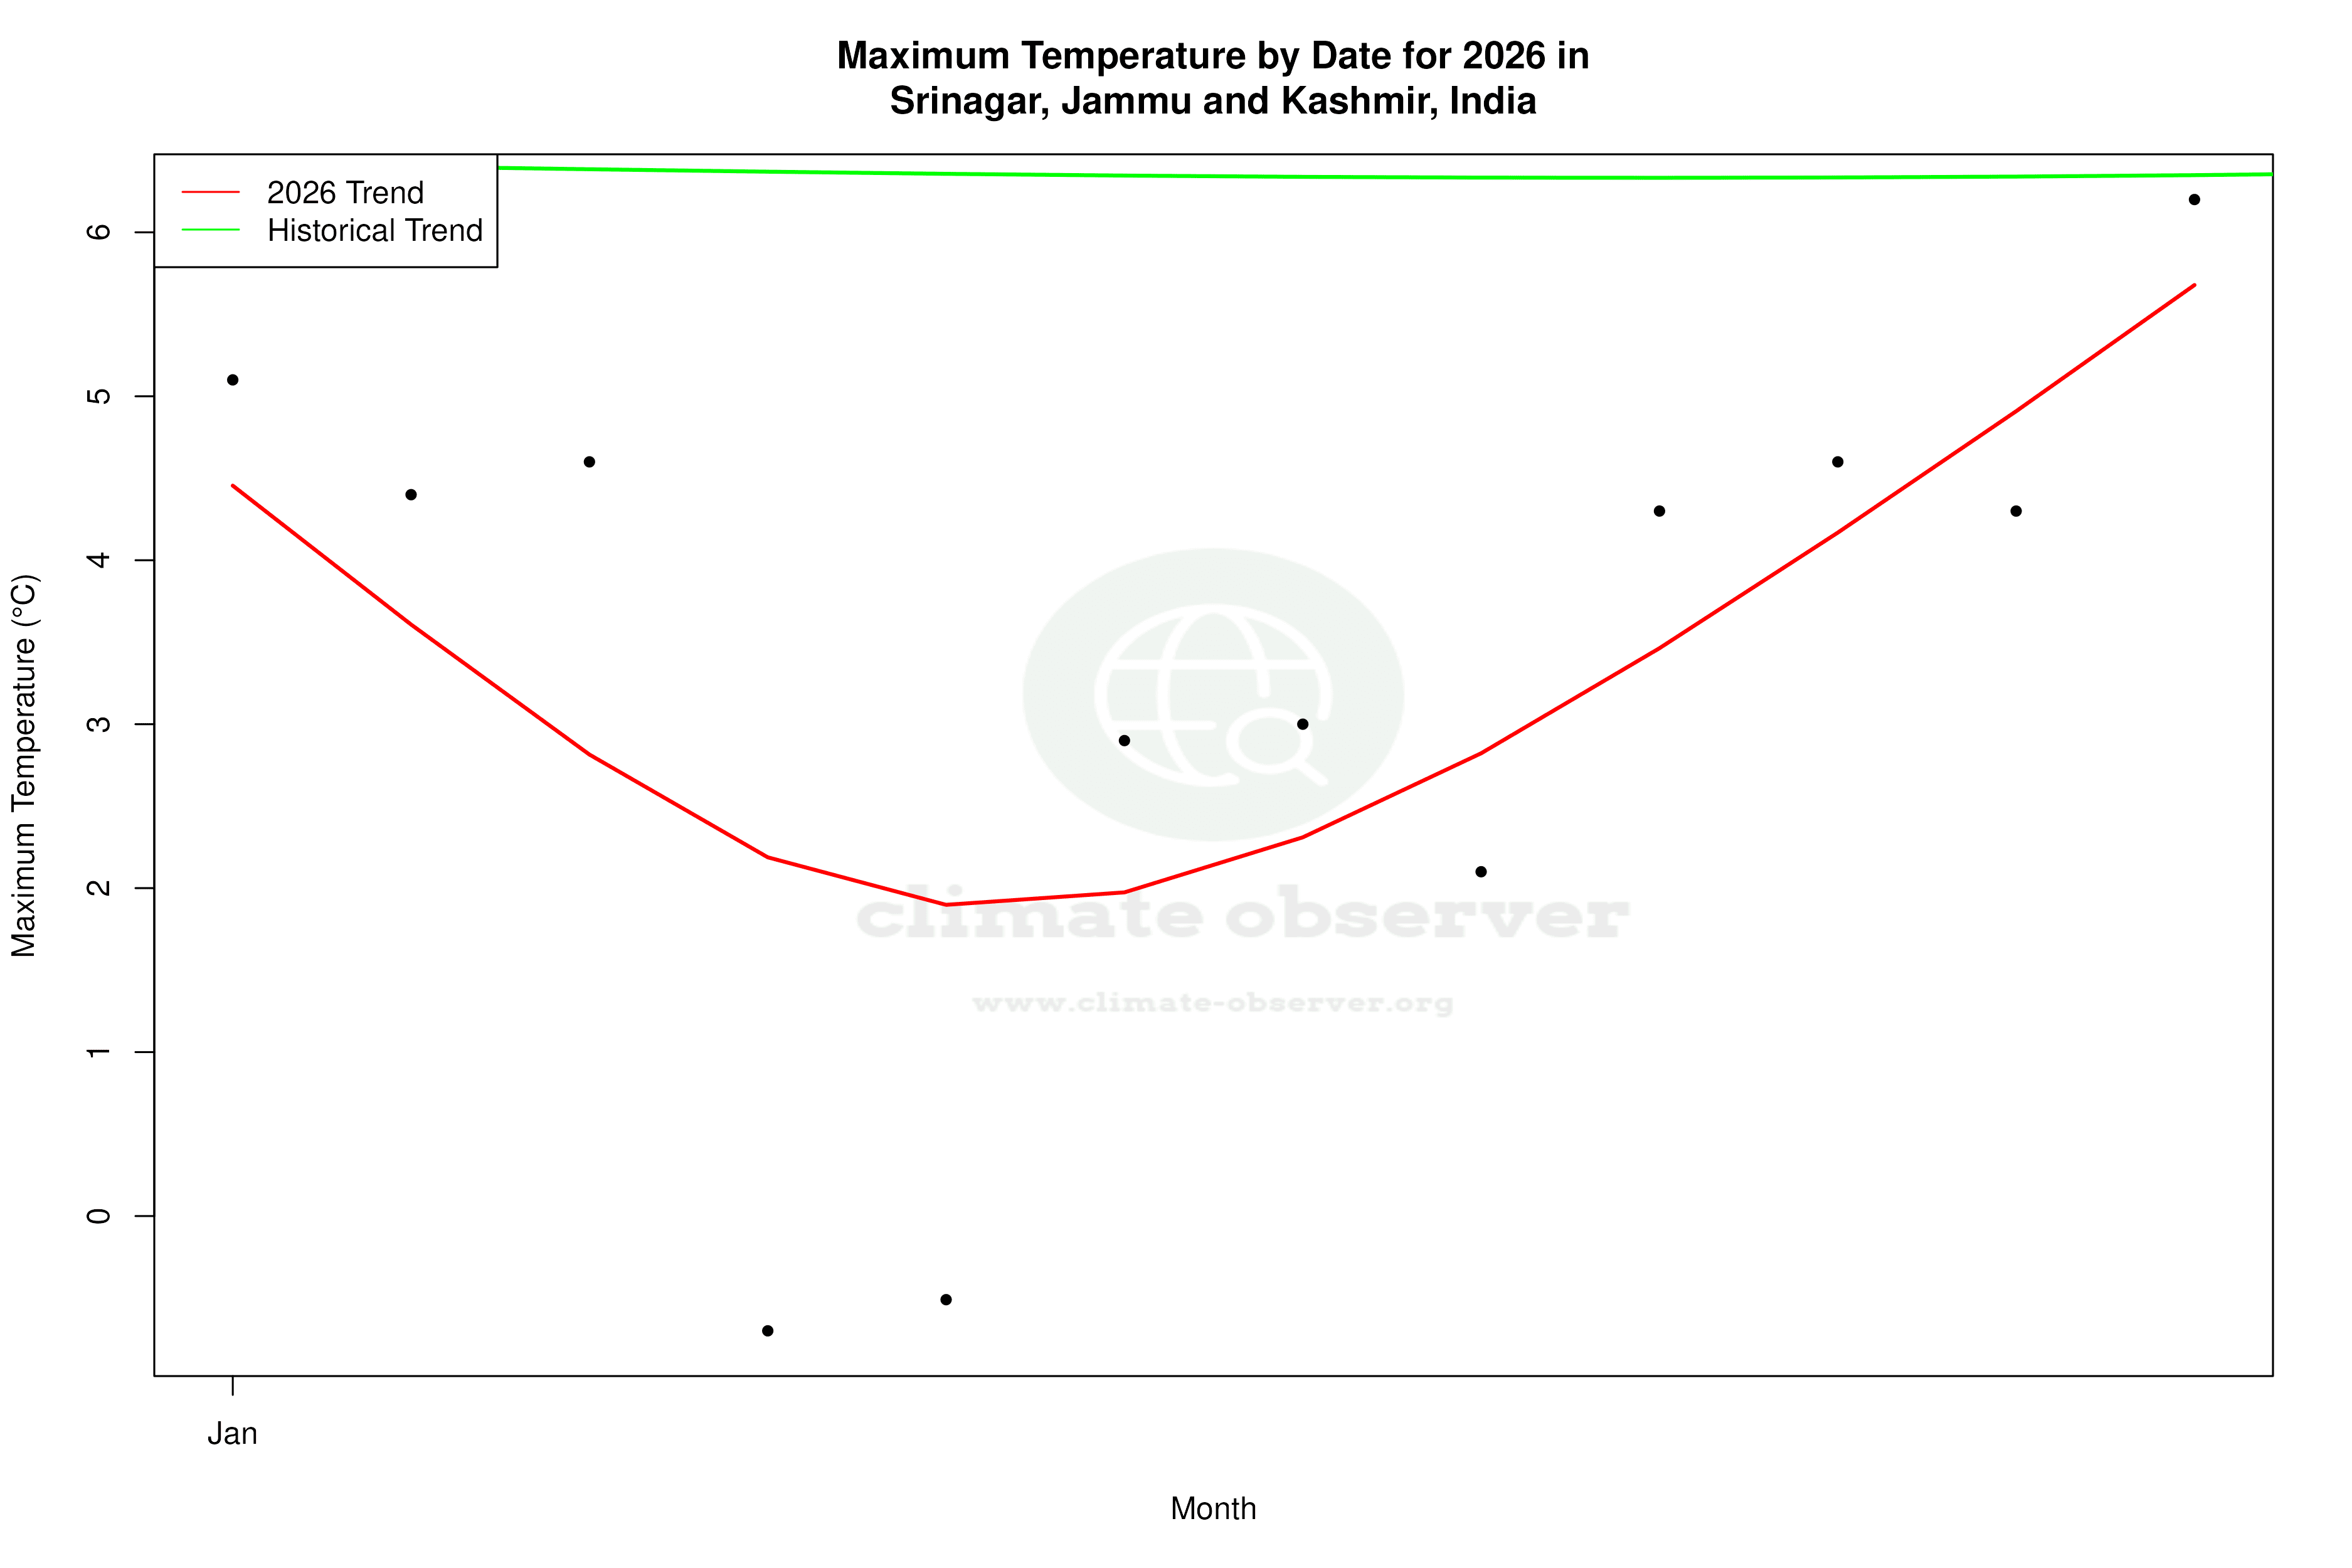


Max Temperature this Year | 1 of 6
Climate 12-Month Moving Averages


Max Temperature 12-Month MA | 1 of 6
Daily Data Points and Averages Throughout the Year


Average Max Temperature Throughout Year | 1 of 5
