Climate for Station: Cuddalore, Tamil Nadu, India
Loading live weather...
Climate Analysis & Overview
Cuddalore's climate is experiencing a nuanced transformation, with a marked warming trend in low temperatures and a more even distribution of rainfall. Despite a slight cooling in high temperatures over the past decade, the long-term data indicates a warming trajectory, aligning with India's broader climate adaptation goals.
Coastal Climate Dynamics
Cuddalore, located in Tamil Nadu, India, falls under the Köppen climate classification of Aw, indicating a tropical savanna climate with a distinct dry season. The city's proximity to the Bay of Bengal greatly influences its climatic conditions, moderating temperatures and contributing to its seasonal rainfall patterns. Over the past decade, there has been a notable decrease in high temperatures by 0.05°C (0.09°F), contrasting with the long-term warming trend of 0.28°C (0.50°F). This suggests a complex interplay between short-term variability and long-term climate change, which may be influenced by regional climatic phenomena or mitigation efforts.
Thermal Shifts in Low Temperatures
The most significant change in Cuddalore's climate profile is the warming of low temperatures. Over the last decade, lows have risen by 0.81°C (1.46°F), a substantial increase compared to the all-time rise of 0.17°C (0.31°F). This trend is indicative of warmer nights, which can affect local agriculture, energy consumption, and human health. Such changes are consistent with broader regional patterns observed across India, where minimum temperatures are rising more rapidly than maximum temperatures.
Precipitation Patterns and Distribution
The Precipitation Concentration Index (PCI) for Cuddalore has decreased from a baseline of 18.6 to a current value of 12.9. This significant change suggests that rainfall is now more evenly distributed throughout the year, reducing the intensity of individual rain events. A more even distribution can mitigate flood risks and enhance water resource management, aligning with India's climate resilience strategies.
Temperature Extremes and Records
Cuddalore's temperature records highlight the extremes that the region can experience. The highest recorded temperature stands at 42.6°C (108.7°F), while the lowest is 12.0°C (53.6°F). These records underscore the potential for extreme weather events, which are critical considerations for infrastructure and public safety planning in the region.
Interpreting Climate Trends
The climate data from Cuddalore reveals a complex narrative of both cooling and warming trends. While the recent decade has shown a slight cooling in high temperatures, the overall warming of lows and a more even rainfall distribution are indicative of broader climate shifts. These changes are crucial for understanding local impacts and informing adaptive strategies as India continues to address climate change challenges.
Station Statistics
10-Year Trend
High: -0.25 °C/decade
Low: +0.96 °C/decade
Rain: +0.68 mm/decade
25-Year Trend
High: -0.13 °C/decade
Low: +0.54 °C/decade
Rain: +0.73 mm/decade
50-Year Trend
High: +0.25 °C/decade
Low: +0.16 °C/decade
Rain: +0.46 mm/decade
All-Time Trend
High: +0.25 °C/decade
Low: +0.17 °C/decade
Rain: +0.01 mm/decade
Percentage Above-Average Days
Last 12 Months: 34.2%
This Year: 3.2%
Precipitation Concentration Index (PCI) ℹ️
Last 12 Months: 14.1
Historical Average: 21.3
Percentile Rank of Last 12 Months ℹ️
High: 5th percentile
Low: 99th percentile
Rain: 66th percentile
Change in Variance ℹ️
High: +1.1%
Low: -16.6%
Intraday: -2.3%
Data Coverage
54.7%
First Year of Data
1901
Station Location
Historical Weather Records
| Max High | Avg High | Min High | Max Avg | Avg Avg | Min Avg | Max Low | Avg Low | Min Low | Max Precipitation | Avg Precipitation | Max Snow | Avg Snow | |
|---|---|---|---|---|---|---|---|---|---|---|---|---|---|
| Record | 42.6 °C | — | 23.0 °C | 35.8 °C | — | 21.1 °C | 30.6 °C | — | 12.0 °C | 572.0 mm | — | — | — |
| January | 33.4 °C | 29.1 °C | 24.0 °C | 28.6 °C | 25.1 °C | 21.1 °C | 25.7 °C | 21.1 °C | 15.6 °C | 197.0 mm | 1.6 mm | — | — |
| February | 35.4 °C | 30.5 °C | 25.6 °C | 29.6 °C | 26.1 °C | 21.6 °C | 27.0 °C | 21.6 °C | 12.0 °C | 101.1 mm | 0.5 mm | — | — |
| March | 39.0 °C | 32.4 °C | 26.7 °C | 31.1 °C | 28.0 °C | 23.3 °C | 28.4 °C | 23.6 °C | 16.5 °C | 183.1 mm | 0.5 mm | — | — |
| April | 41.2 °C | 34.4 °C | 26.1 °C | 33.8 °C | 30.1 °C | 24.8 °C | 30.6 °C | 26.1 °C | 20.5 °C | 120.4 mm | 0.7 mm | — | — |
| May | 42.6 °C | 36.4 °C | 26.3 °C | 35.8 °C | 31.1 °C | 25.1 °C | 30.2 °C | 27.2 °C | 21.0 °C | 572.0 mm | 1.6 mm | — | — |
| June | 42.1 °C | 36.5 °C | 27.8 °C | 35.0 °C | 31.0 °C | 24.3 °C | 30.2 °C | 26.7 °C | 20.7 °C | 82.6 mm | 1.6 mm | — | — |
| July | 40.7 °C | 35.4 °C | 27.6 °C | 34.0 °C | 30.1 °C | 25.6 °C | 30.4 °C | 26.0 °C | 19.5 °C | 100.8 mm | 2.2 mm | — | — |
| August | 40.0 °C | 34.7 °C | 25.7 °C | 33.7 °C | 29.5 °C | 24.8 °C | 28.6 °C | 25.5 °C | 20.0 °C | 125.0 mm | 4.2 mm | — | — |
| September | 39.7 °C | 33.7 °C | 26.0 °C | 33.3 °C | 29.0 °C | 24.4 °C | 28.8 °C | 25.2 °C | 21.0 °C | 160.0 mm | 4.0 mm | — | — |
| October | 38.0 °C | 31.9 °C | 24.0 °C | 31.5 °C | 27.9 °C | 22.8 °C | 28.0 °C | 24.7 °C | 19.9 °C | 220.0 mm | 8.3 mm | — | — |
| November | 38.0 °C | 29.7 °C | 23.0 °C | 29.9 °C | 26.2 °C | 22.0 °C | 28.2 °C | 23.3 °C | 17.3 °C | 380.0 mm | 13.0 mm | — | — |
| December | 33.4 °C | 28.9 °C | 23.8 °C | 30.0 °C | 25.3 °C | 21.2 °C | 26.3 °C | 22.0 °C | 15.9 °C | 426.5 mm | 5.8 mm | — | — |
Data Visualisations
Remove WatermarksCurrent Year Climate Trends vs Historical


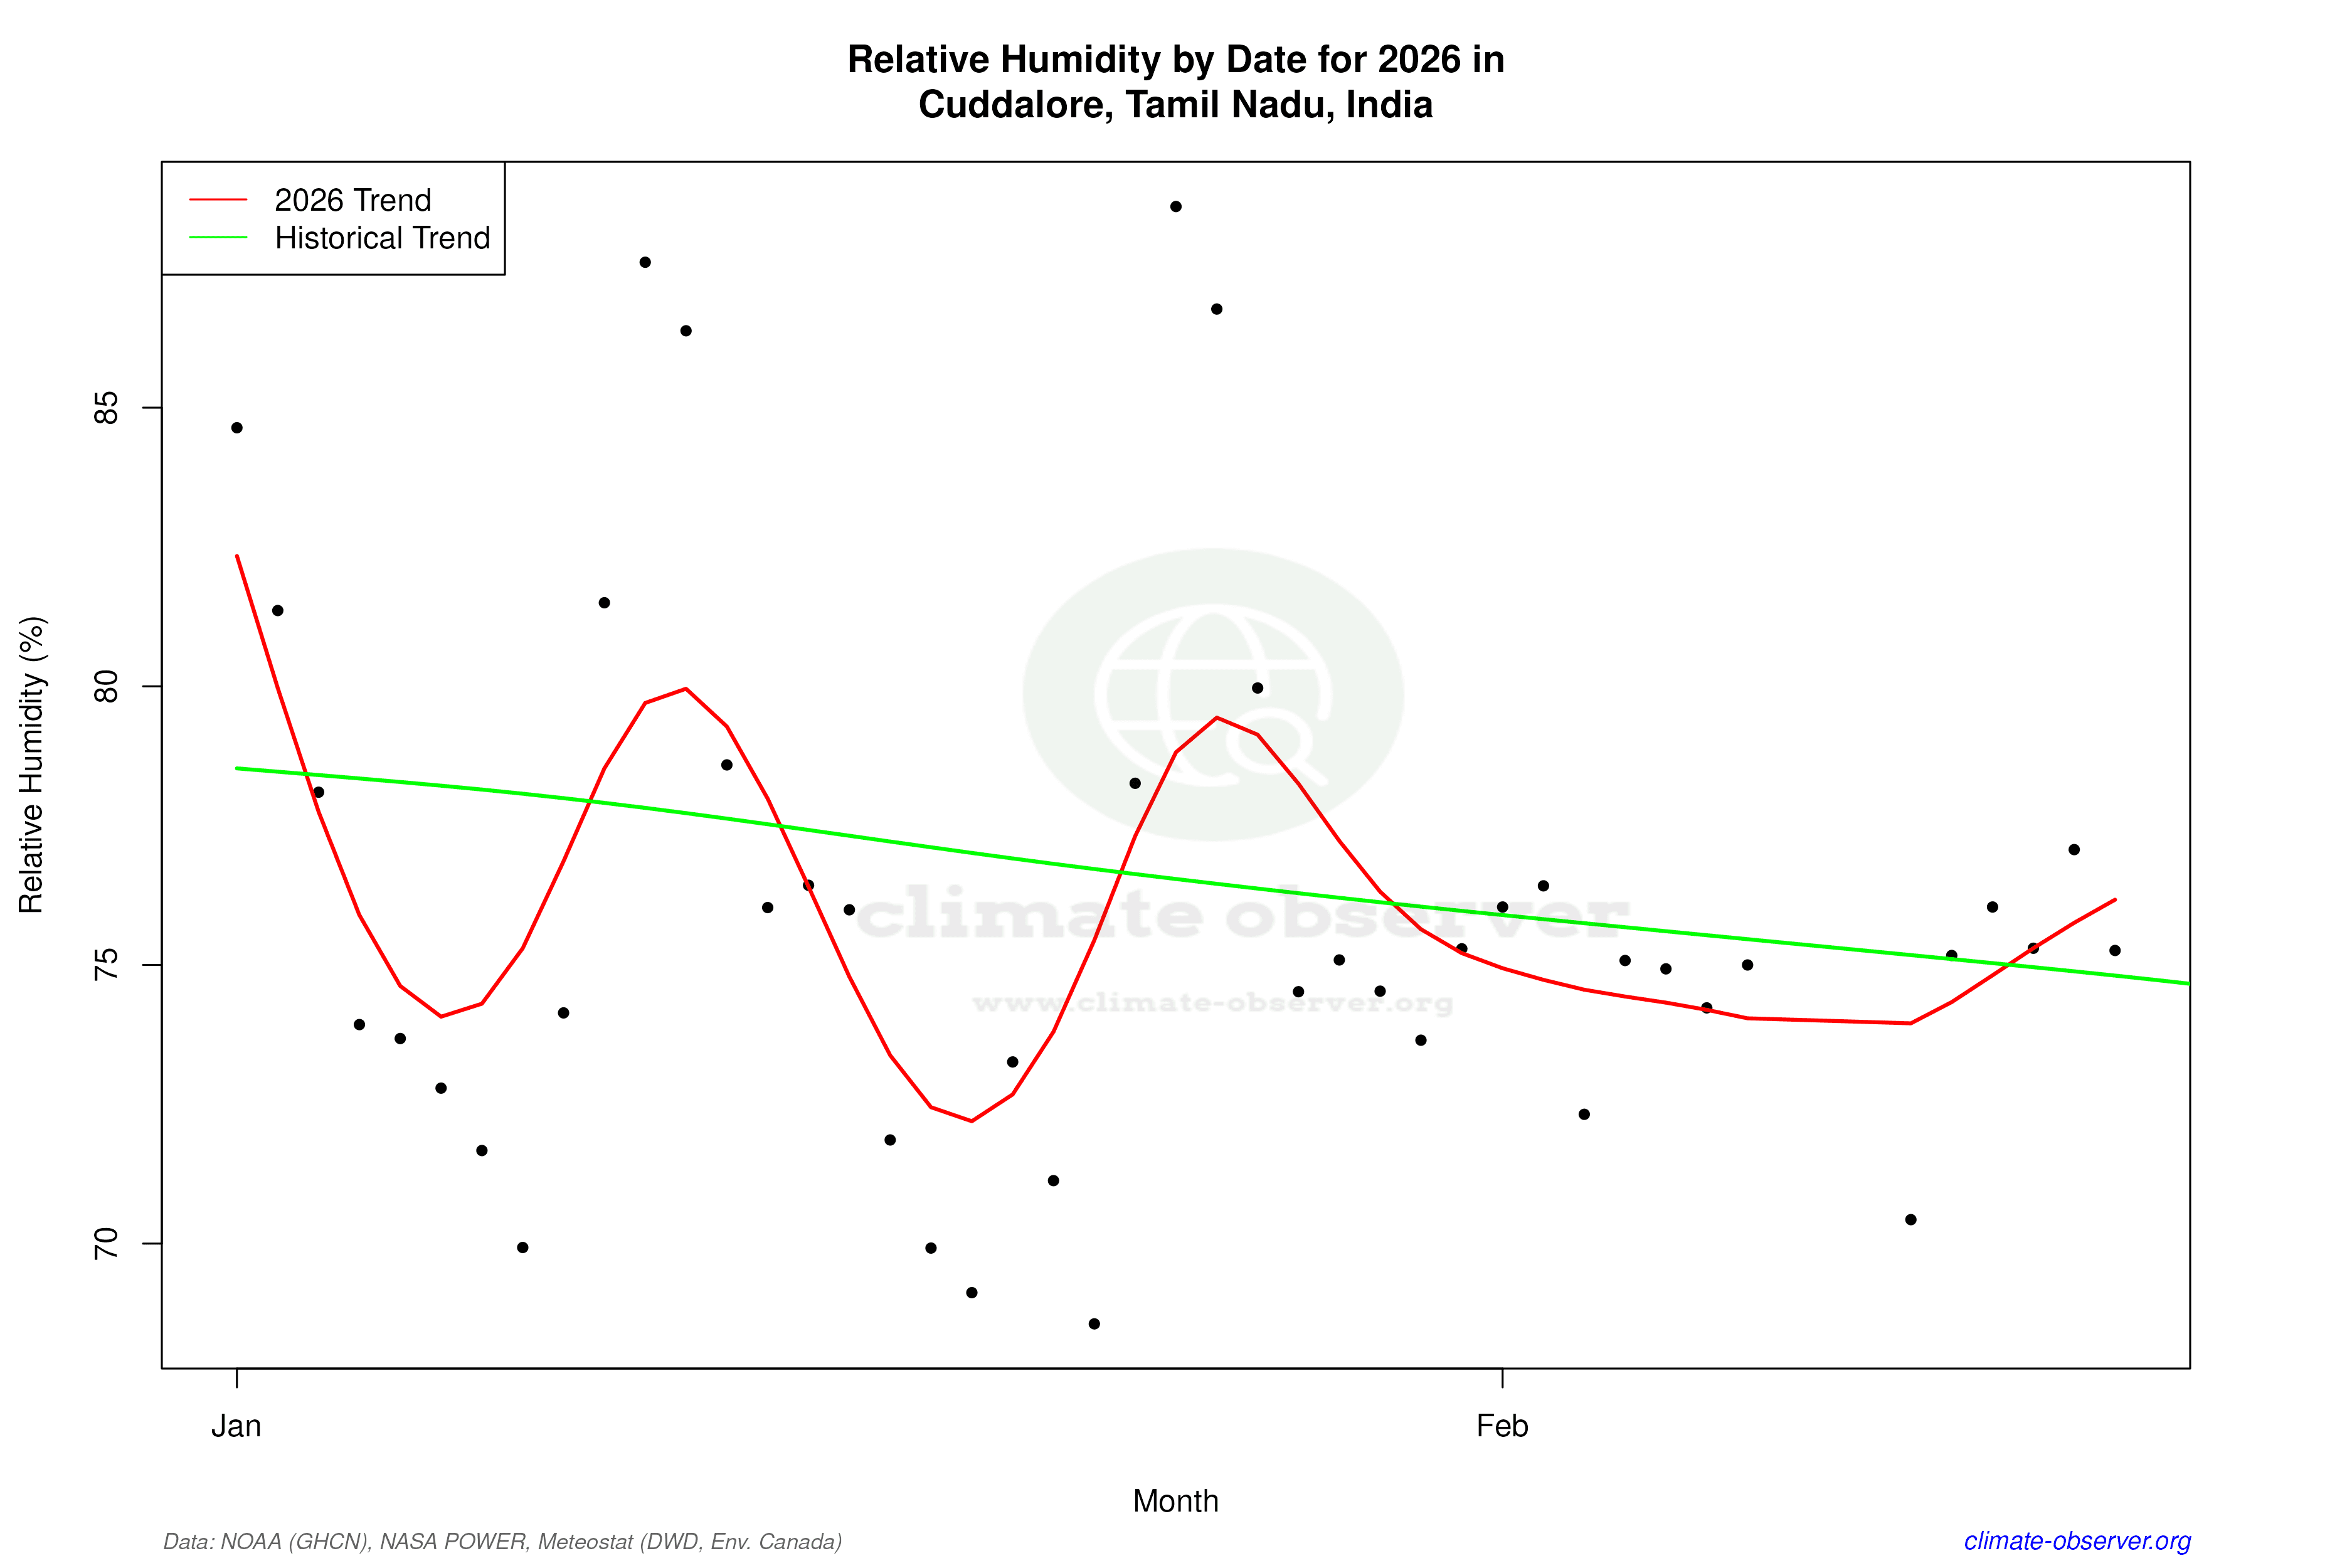

Max Temperature this Year | 1 of 6
Climate 12-Month Moving Averages


Max Temperature 12-Month MA | 1 of 6
Daily Data Points and Averages Throughout the Year


Average Max Temperature Throughout Year | 1 of 5
