Climate for Station: Agartala, Tripura, India
Loading live weather...
Climate Analysis & Overview
Agartala, nestled in the humid subtropical climate zone, is experiencing a nuanced dance of thermal shifts. While recent years show a warming trend, the long-term data suggests a slight cooling in high temperatures. Precipitation patterns are becoming marginally more concentrated, hinting at potential impacts on agriculture and water management.
Subtropical Climate Dynamics
Agartala, the capital of Tripura, India, is situated in a region characterised by a humid subtropical climate, according to the Köppen classification. This climate type typically involves hot, humid summers and mild winters, influenced by the city's proximity to the Bangladesh border and the lush hills of the Indian subcontinent. The geographical setting contributes to the unique climatic patterns observed in Agartala, where the interplay of monsoons and topography creates distinct seasonal variations.
Temperature Trends: A Tale of Two Scales
The temperature trends in Agartala present an intriguing narrative. Over the past decade, the city has experienced a warming pattern, with high temperatures increasing by 1.66°C (2.99°F) and low temperatures by 0.32°C (0.58°F). This recent warming trend contrasts with the all-time data, which shows a slight cooling in high temperatures by 0.02°C (0.04°F), while low temperatures have risen by 0.34°C (0.61°F). This divergence suggests a complex interplay between short-term climatic variations and long-term atmospheric changes.
Precipitation Patterns: Marginal Shifts
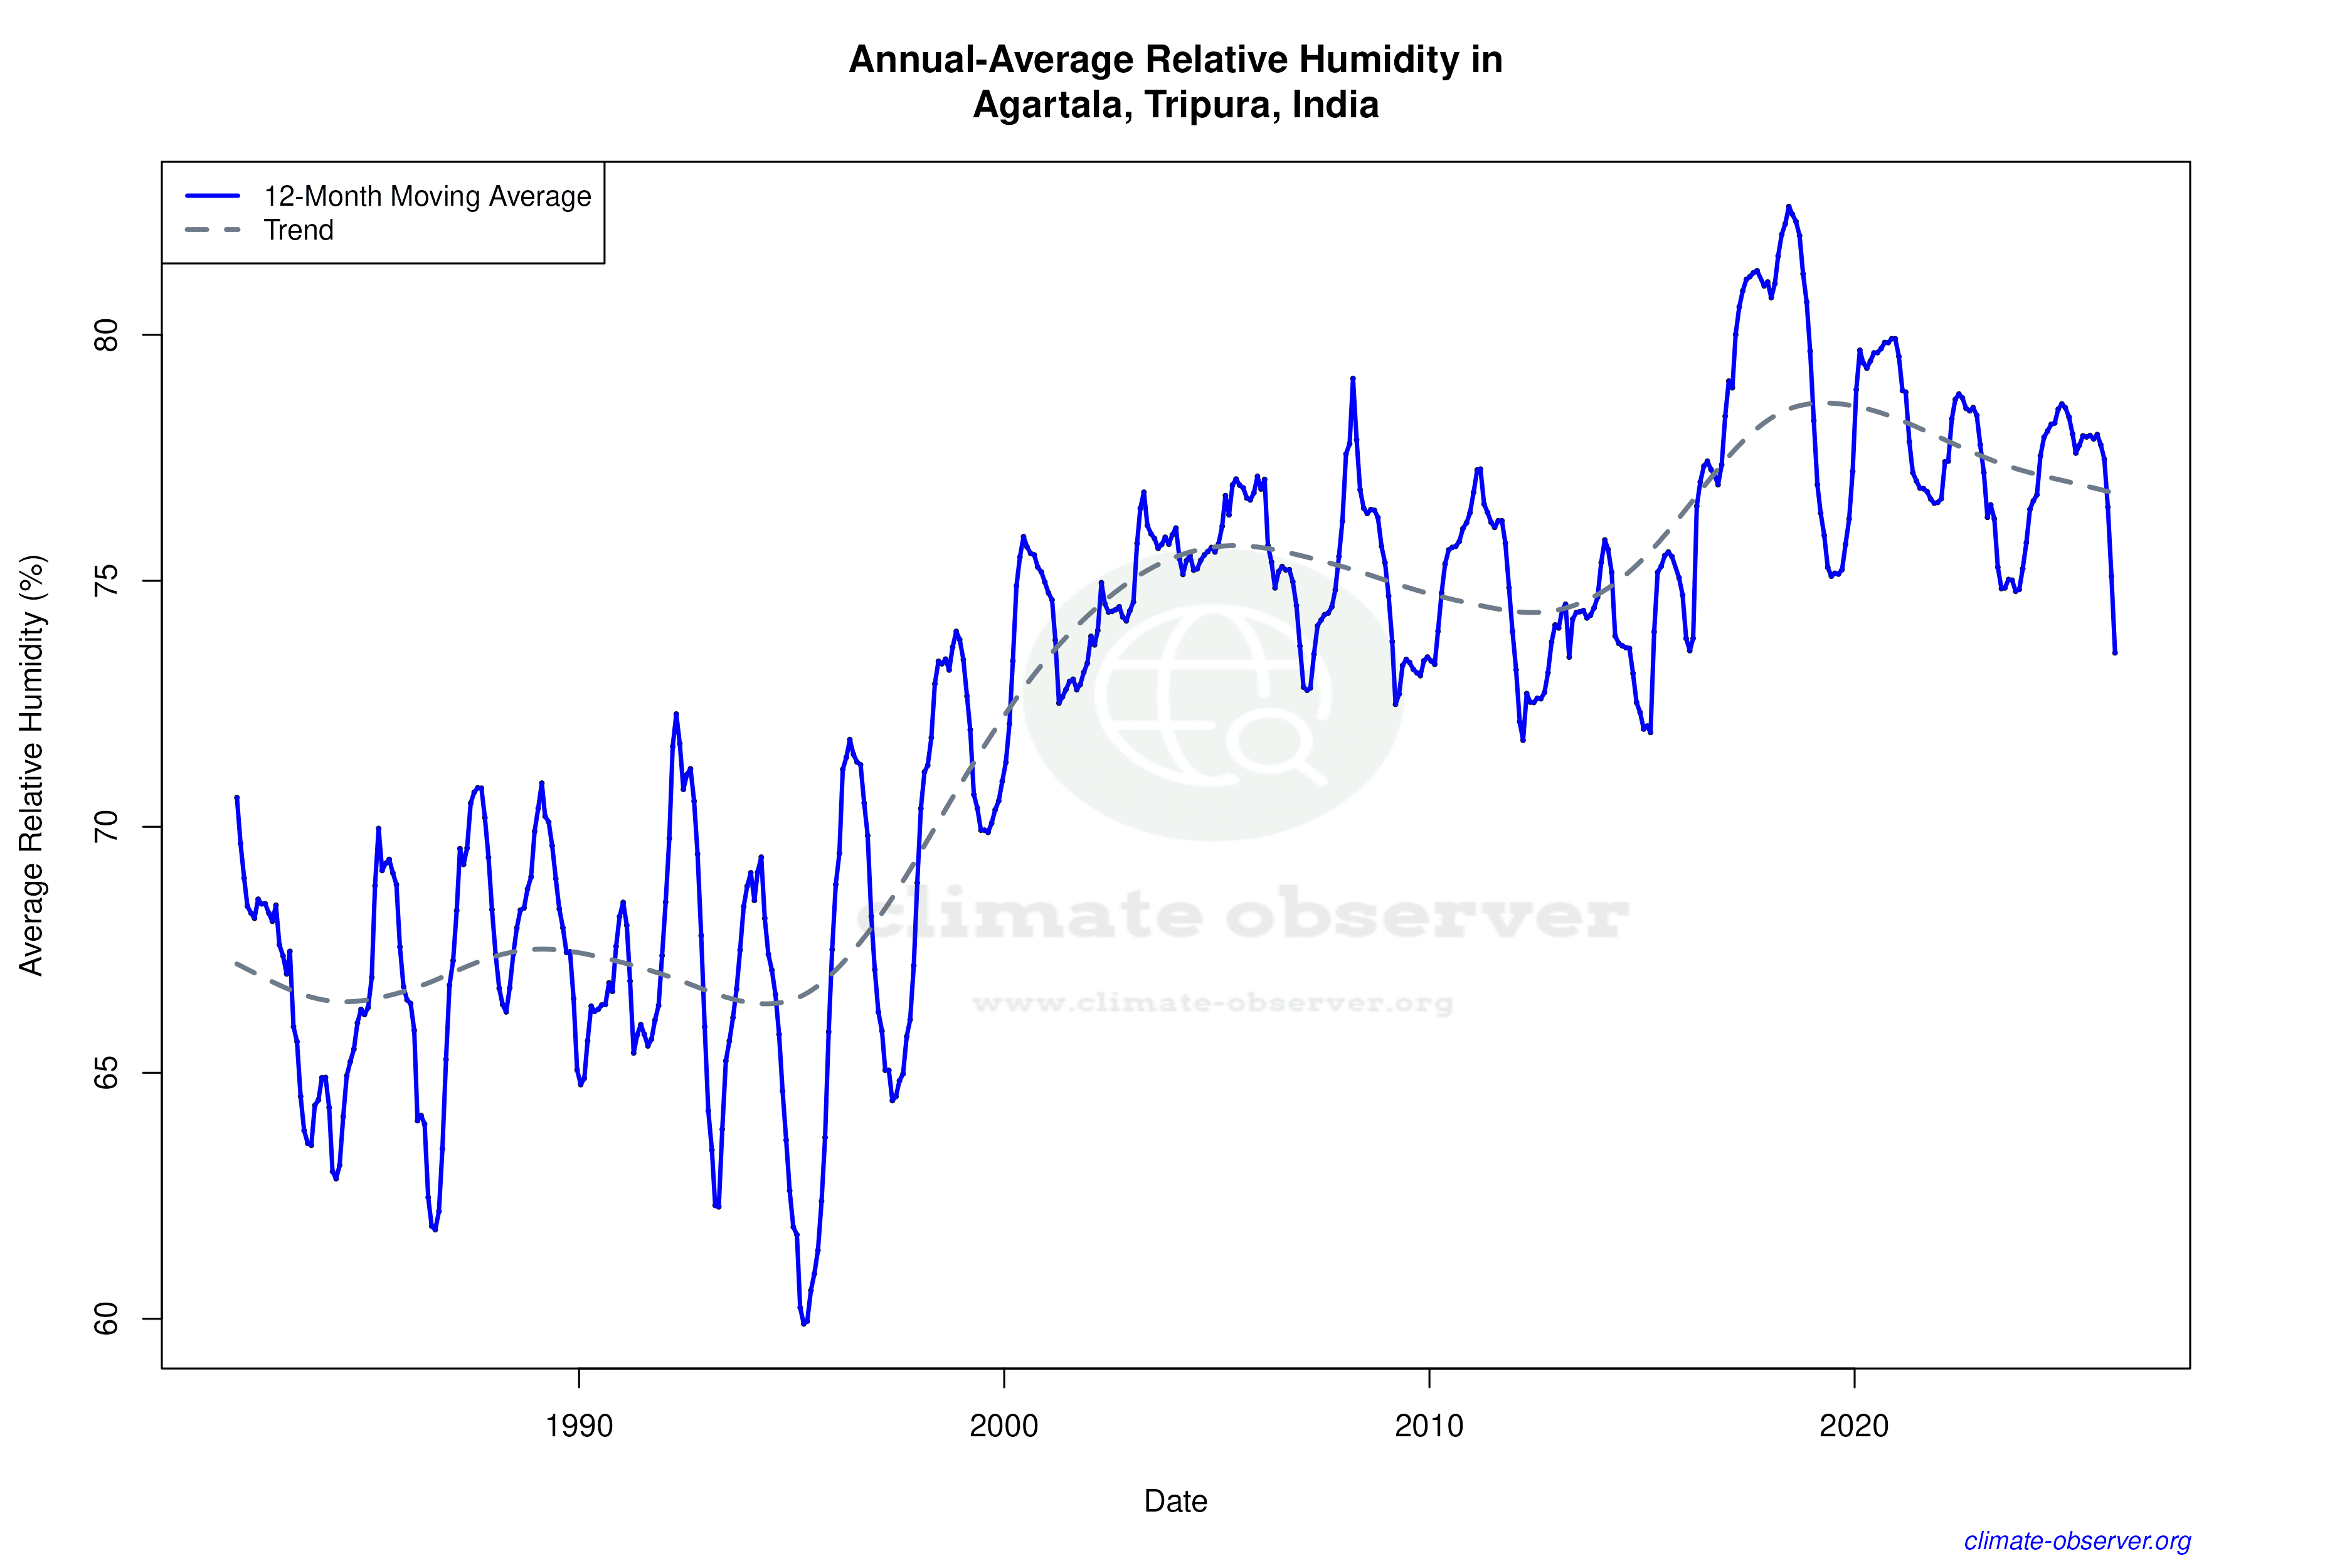
The Precipitation Concentration Index (PCI) for Agartala has shown a marginal increase from a baseline of 15.34 to a current value of 15.43. The PCI is a measure that indicates how precipitation is distributed over time, with higher values suggesting more concentrated rainfall events. This slight increase implies that rainfall in Agartala is becoming marginally more concentrated in fewer events, which could affect water resource management and agricultural practices in the region.
Record Extremes: Thermal Boundaries
Agartala's climate records highlight the city's thermal boundaries. The highest recorded temperature is a scorching 43.29°C (109.92°F), while the lowest plummets to a chilly 1.0°C (33.8°F). These extremes underscore the variability inherent in Agartala's climate, shaped by its geographical and meteorological influences.
Regional Implications and Considerations
The climate trends in Agartala align with broader regional climate goals, which aim to adapt to and mitigate the impacts of climate change. The slight increase in temperature and precipitation concentration may have implications for local agriculture, water supply, and urban planning. Recent weather events, such as unseasonal rainfall or heatwaves, serve as reminders of the ongoing challenges posed by climate variability in this region.
Station Statistics
10-Year Trend
High: +3.10 °F/decade
Low: +1.09 °F/decade
Rain: -0.044 in/decade
25-Year Trend
High: +0.19 °F/decade
Low: +0.80 °F/decade
Rain: +0.013 in/decade
50-Year Trend
High: +0.02 °F/decade
Low: +0.62 °F/decade
Rain: +0.014 in/decade
All-Time Trend
High: +0.02 °F/decade
Low: +0.62 °F/decade
Rain: -0.002 in/decade
Percentage Above-Average Days
Last 12 Months: 64.9%
This Year: 78.5%
Precipitation Concentration Index (PCI) ℹ️
Last 12 Months: 14.3
Historical Average: 16.5
Percentile Rank of Last 12 Months ℹ️
High: 90th percentile
Low: 93rd percentile
Rain: 70th percentile
Change in Variance ℹ️
High: +28.5%
Low: -12.7%
Intraday: -22.0%
Data Coverage
54.1%
First Year of Data
1901
Station Location
Historical Weather Records
| Max High | Avg High | Min High | Max Avg | Avg Avg | Min Avg | Max Low | Avg Low | Min Low | Max Precipitation | Avg Precipitation | Max Snow | Avg Snow | |
|---|---|---|---|---|---|---|---|---|---|---|---|---|---|
| Record | 109.92 °F | — | 58.64 °F | 95.36 °F | — | 47.12 °F | 84.56 °F | — | 33.80 °F | 14.96 in | — | — | — |
| January | 89.06 °F | 77.52 °F | 58.64 °F | 78.08 °F | 63.88 °F | 47.12 °F | 67.08 °F | 51.52 °F | 33.80 °F | 1.75 in | 0.01 in | — | — |
| February | 100.04 °F | 83.52 °F | 66.20 °F | 84.92 °F | 70.05 °F | 55.40 °F | 75.20 °F | 57.05 °F | 37.04 °F | 4.53 in | 0.03 in | — | — |
| March | 106.39 °F | 90.55 °F | 70.52 °F | 91.04 °F | 78.44 °F | 63.68 °F | 78.44 °F | 66.43 °F | 48.20 °F | 11.81 in | 0.08 in | — | — |
| April | 109.92 °F | 93.34 °F | 73.76 °F | 92.84 °F | 82.89 °F | 64.76 °F | 84.56 °F | 73.07 °F | 46.40 °F | 5.81 in | 0.23 in | — | — |
| May | 105.69 °F | 91.86 °F | 73.76 °F | 95.36 °F | 83.08 °F | 69.26 °F | 82.94 °F | 75.19 °F | 64.04 °F | 10.31 in | 0.39 in | — | — |
| June | 104.00 °F | 90.12 °F | 76.28 °F | 94.64 °F | 83.30 °F | 73.94 °F | 83.30 °F | 77.39 °F | 64.40 °F | 14.96 in | 0.50 in | — | — |
| July | 102.20 °F | 89.50 °F | 77.36 °F | 91.58 °F | 83.07 °F | 74.48 °F | 82.40 °F | 77.53 °F | 69.80 °F | 8.66 in | 0.42 in | — | — |
| August | 103.28 °F | 89.74 °F | 77.00 °F | 90.68 °F | 83.24 °F | 73.40 °F | 82.40 °F | 77.37 °F | 68.00 °F | 8.37 in | 0.38 in | — | — |
| September | 101.48 °F | 89.68 °F | 75.45 °F | 91.04 °F | 82.75 °F | 73.04 °F | 83.48 °F | 76.66 °F | 66.90 °F | 5.51 in | 0.29 in | — | — |
| October | 101.48 °F | 88.38 °F | 71.26 °F | 89.06 °F | 80.47 °F | 68.36 °F | 80.78 °F | 72.71 °F | 56.48 °F | 9.40 in | 0.19 in | — | — |
| November | 98.60 °F | 84.96 °F | 69.80 °F | 85.64 °F | 74.03 °F | 62.96 °F | 77.00 °F | 63.30 °F | 41.00 °F | 5.35 in | 0.04 in | — | — |
| December | 95.00 °F | 79.37 °F | 62.24 °F | 77.90 °F | 66.39 °F | 53.06 °F | 71.24 °F | 54.61 °F | 35.96 °F | 3.70 in | 0.01 in | — | — |
Data Visualisations
Remove WatermarksCurrent Year Climate Trends vs Historical


Max Temperature this Year | 1 of 6
Climate 12-Month Moving Averages


Max Temperature 12-Month MA | 1 of 6
Daily Data Points and Averages Throughout the Year


Average Max Temperature Throughout Year | 1 of 5
