Climate for Station: Port Blair, Andaman and Nicobar Islands, India
Loading live weather...
Climate Analysis & Overview
Port Blair, nestled in the Andaman and Nicobar Islands, is experiencing a warming trend with a notable increase in high temperatures over the past decade. The precipitation pattern has become more evenly distributed, indicating a shift in rainfall dynamics. These changes are crucial in the context of India's climate goals and regional weather patterns.
Tropical Maritime Climate Dynamics
Port Blair, located at 11.667°N, 92.717°E, falls under the tropical rainforest climate (Af) according to the Köppen classification. This island city is surrounded by the Bay of Bengal, which plays a significant role in moderating its climate. The maritime influence ensures high humidity and significant rainfall throughout the year. The geographical positioning of Port Blair contributes to its unique climate profile, where oceanic currents and monsoonal winds are key influencers.
Rising Highs and Cooling Lows
Over the past decade, Port Blair has experienced a warming trend in high temperatures, with an increase of 1.75°C (3.15°F). Interestingly, the lows have shown a slight cooling of -0.22°C (-0.40°F). This divergence between highs and lows suggests a greater diurnal temperature range, possibly influenced by changing cloud cover or atmospheric circulation patterns. The all-time trends show a more modest warming, with highs rising by 0.33°C (0.59°F) and lows by 0.04°C (0.07°F), indicating a long-term gradual warming.
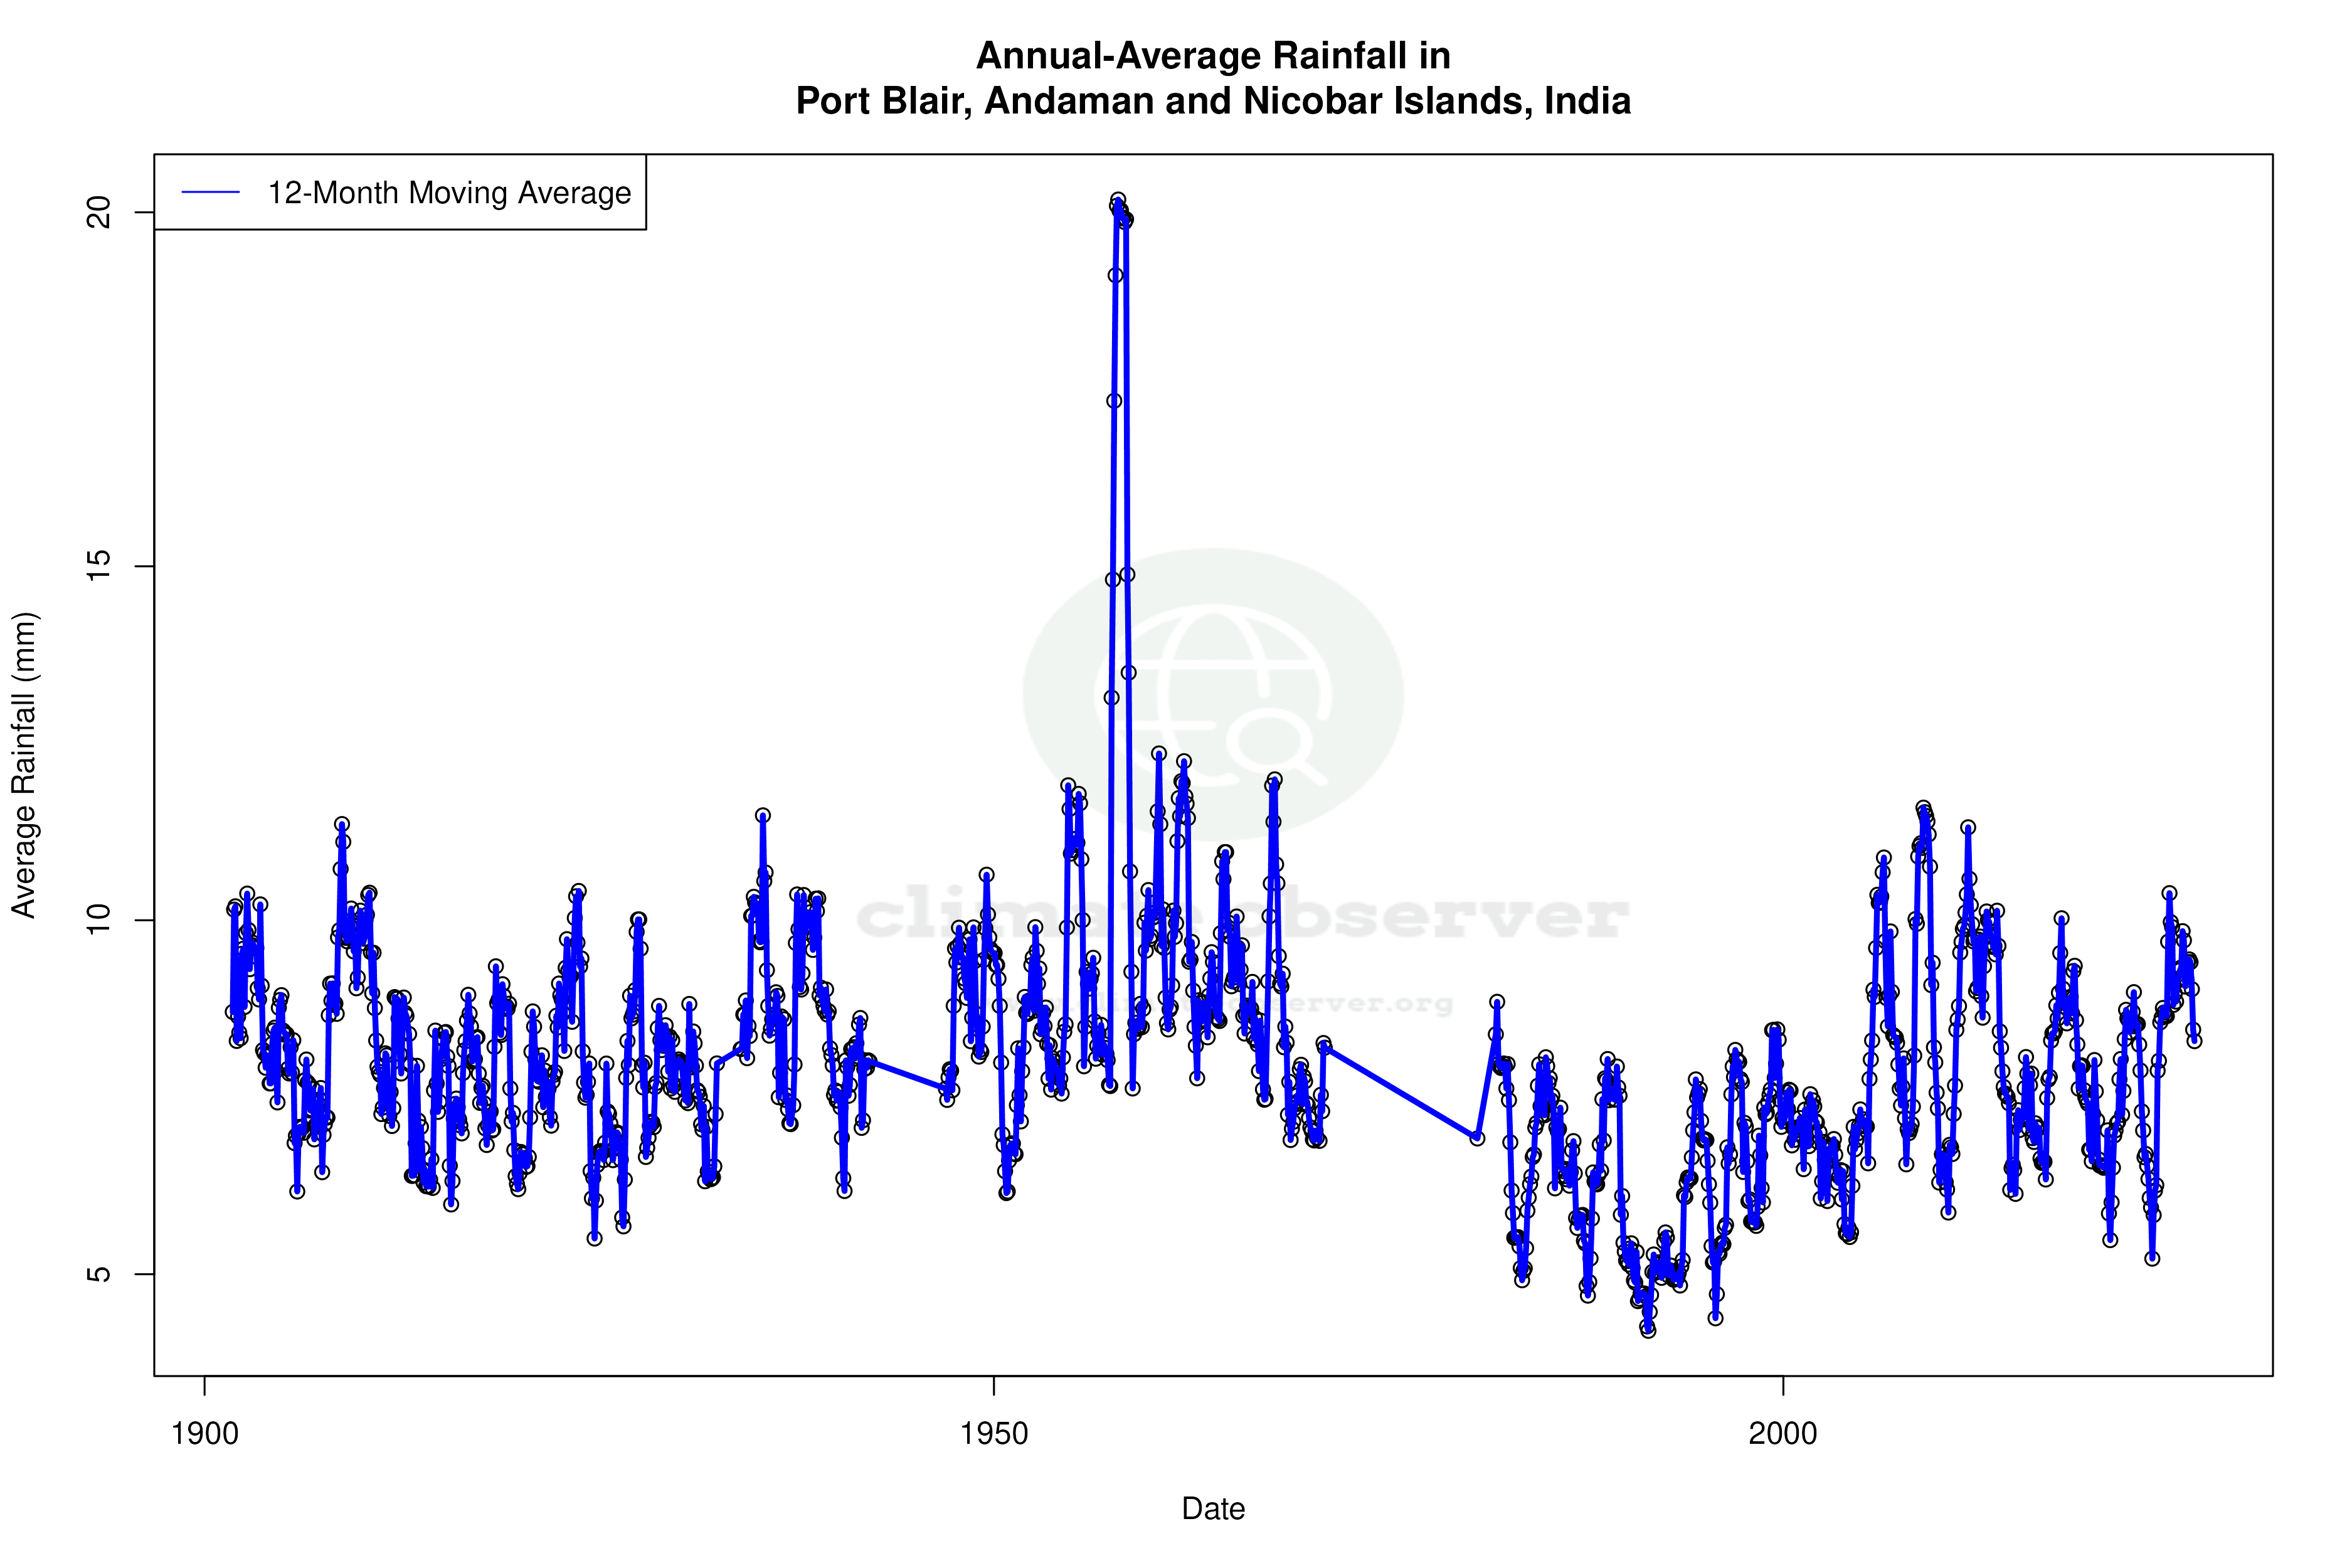
Precipitation Patterns: A Shift Towards Evenness
The Precipitation Concentration Index (PCI) offers insights into rainfall distribution. Port Blair's PCI has decreased from a baseline of 15.44 to 13.52, suggesting that rainfall has become more evenly distributed across the year. This shift could imply a reduction in extreme rainfall events, aligning with India's regional climate goals to manage water resources more effectively and mitigate flood risks.
Record Extremes and Their Implications
Port Blair's historical temperature records reveal an absolute maximum of 38.4°C (101.1°F) and a minimum of 10.0°C (50.0°F). These extremes highlight the potential for significant thermal variability despite the overall tropical climate. Such variations can impact local ecosystems and human activities, necessitating adaptive strategies in agriculture and infrastructure planning.
Contextual Climate Considerations
The climate trends observed in Port Blair are part of a broader pattern of change affecting the Andaman and Nicobar Islands. With India aiming to enhance climate resilience, understanding these localised changes is vital. Recent weather events, such as cyclones and monsoon variability, underscore the importance of integrating climate data into policy and planning. As Port Blair continues to evolve, its climate profile will be a critical factor in shaping sustainable development pathways.
Station Statistics
10-Year Trend
High: +1.76 °C/decade
Low: +0.07 °C/decade
Rain: +1.75 mm/decade
25-Year Trend
High: -0.19 °C/decade
Low: +0.31 °C/decade
Rain: +0.20 mm/decade
50-Year Trend
High: +0.30 °C/decade
Low: +0.05 °C/decade
Rain: +0.62 mm/decade
All-Time Trend
High: +0.30 °C/decade
Low: +0.05 °C/decade
Rain: -0.06 mm/decade
Percentage Above-Average Days
Last 12 Months: 44.7%
This Year: 55.2%
Precipitation Concentration Index (PCI) ℹ️
Last 12 Months: 14.7
Historical Average: 14.5
Percentile Rank of Last 12 Months ℹ️
High: 50th percentile
Low: 82nd percentile
Rain: 68th percentile
Change in Variance ℹ️
High: -14.6%
Low: -49.4%
Intraday: -51.0%
Data Coverage
53.0%
First Year of Data
1974
Station Location
Historical Weather Records
| Max High | Avg High | Min High | Max Avg | Avg Avg | Min Avg | Max Low | Avg Low | Min Low | Max Precipitation | Avg Precipitation | Max Snow | Avg Snow | |
|---|---|---|---|---|---|---|---|---|---|---|---|---|---|
| Record | 38.4 °C | — | 24.0 °C | 35.3 °C | — | 21.7 °C | 30.6 °C | — | 10.0 °C | 334.3 mm | — | — | — |
| January | 32.1 °C | 29.1 °C | 25.3 °C | 29.2 °C | 26.5 °C | 22.3 °C | 27.7 °C | 23.7 °C | 10.0 °C | 208.3 mm | 1.4 mm | — | — |
| February | 34.1 °C | 29.8 °C | 25.5 °C | 29.7 °C | 26.8 °C | 22.7 °C | 27.8 °C | 23.6 °C | 13.7 °C | 131.1 mm | 0.9 mm | — | — |
| March | 36.0 °C | 30.8 °C | 26.2 °C | 30.5 °C | 27.7 °C | 23.8 °C | 29.1 °C | 24.4 °C | 16.0 °C | 94.3 mm | 0.9 mm | — | — |
| April | 36.8 °C | 31.8 °C | 27.5 °C | 31.4 °C | 28.7 °C | 23.5 °C | 30.5 °C | 25.8 °C | 19.0 °C | 206.8 mm | 2.3 mm | — | — |
| May | 38.4 °C | 30.8 °C | 24.5 °C | 35.3 °C | 28.1 °C | 22.7 °C | 30.6 °C | 25.9 °C | 20.0 °C | 230.9 mm | 11.5 mm | — | — |
| June | 36.0 °C | 29.6 °C | 24.6 °C | 30.3 °C | 27.5 °C | 22.5 °C | 29.5 °C | 25.5 °C | 18.0 °C | 334.3 mm | 16.1 mm | — | — |
| July | 32.2 °C | 29.2 °C | 25.3 °C | 29.5 °C | 27.1 °C | 21.8 °C | 29.1 °C | 25.2 °C | 15.6 °C | 190.8 mm | 12.7 mm | — | — |
| August | 32.7 °C | 29.1 °C | 25.0 °C | 29.4 °C | 27.0 °C | 21.7 °C | 28.7 °C | 25.1 °C | 18.0 °C | 262.1 mm | 13.4 mm | — | — |
| September | 34.8 °C | 29.0 °C | 24.5 °C | 29.4 °C | 26.6 °C | 21.7 °C | 28.6 °C | 24.7 °C | 18.8 °C | 251.2 mm | 15.6 mm | — | — |
| October | 34.0 °C | 29.5 °C | 25.0 °C | 30.2 °C | 26.8 °C | 23.0 °C | 28.9 °C | 24.6 °C | 18.8 °C | 205.0 mm | 9.4 mm | — | — |
| November | 34.0 °C | 29.6 °C | 24.6 °C | 29.6 °C | 27.2 °C | 23.6 °C | 28.7 °C | 24.9 °C | 18.3 °C | 147.3 mm | 7.2 mm | — | — |
| December | 32.6 °C | 29.2 °C | 24.0 °C | 28.9 °C | 26.8 °C | 22.2 °C | 28.3 °C | 24.4 °C | 15.0 °C | 295.7 mm | 4.6 mm | — | — |
Data Visualisations
Remove WatermarksCurrent Year Climate Trends vs Historical


Max Temperature this Year | 1 of 6
Climate 12-Month Moving Averages


Max Temperature 12-Month MA | 1 of 6
Daily Data Points and Averages Throughout the Year


Average Max Temperature Throughout Year | 1 of 5
