Climate for Station: Esfahan Shahid Beheshti Intl, Isfahan Province, Iran
Loading live weather...
Climate Analysis & Overview
Esfahan Shahid Beheshti International Airport is experiencing a notable warming trend, with both high and low temperatures rising significantly over the past decade. Precipitation patterns have become more concentrated, indicating a shift towards fewer, more intense rainfall events. These changes align with broader regional climate dynamics and present challenges for local climate adaptation strategies.
Geographic and Climatic Context
Esfahan Shahid Beheshti International Airport is situated in the heart of Iran, at coordinates 32.751, 51.862. The region falls under the BWh classification in the Köppen climate system, indicating a hot desert climate. The surrounding geography, characterised by arid landscapes and limited water bodies, influences the local climate significantly. The absence of moderating influences such as large lakes or oceans results in extreme temperature variations between day and night, as well as between seasons.
Temperature Trends: A Decade of Change
Over the past ten years, Esfahan has experienced a significant increase in temperatures. Highs have risen by 2.77°C (4.99°F), while lows have increased by 1.25°C (2.25°F). This warming trend is more pronounced than the all-time trend, which shows a rise of 0.54°C (0.97°F) for highs and a modest 0.05°C (0.09°F) for lows. This suggests that recent years have seen accelerated warming, possibly linked to broader regional climate changes and increased urbanisation effects.
Precipitation Patterns: Intensifying Extremes
The Precipitation Concentration Index (PCI) for Esfahan has seen a significant increase from a baseline of 22.3 to a current value of 39.2. The PCI measures how precipitation is distributed over time, with higher values indicating more concentrated rainfall events. This shift suggests that the region is experiencing fewer but more intense rainfalls, which can lead to increased risks of flooding and challenges for water resource management. Such changes are critical for planning and adaptation in a region already prone to water scarcity.
Temperature Extremes: Historical Records
The historical temperature records for Esfahan highlight the extremes of its desert climate. The highest recorded temperature is 45.5°C (113.9°F), while the lowest is -21.4°C (-6.5°F). These extremes underscore the variability and harshness of the local climate, which can pose challenges to infrastructure and human activity, particularly in the context of ongoing climate change.
Implications for Regional Climate Goals
Iran's regional climate goals focus on mitigating the impacts of climate change and adapting to its effects. The trends observed at Esfahan Shahid Beheshti International Airport, including the significant warming and changes in precipitation patterns, highlight the urgency of these goals. Addressing these challenges requires integrated strategies that consider both mitigation and adaptation, leveraging technology and policy to build resilience in the face of a changing climate.
Station Statistics
10-Year Trend
High: +3.44 °F/decade
Low: +0.71 °F/decade
Rain: +0.002 in/decade
25-Year Trend
High: +2.25 °F/decade
Low: -0.17 °F/decade
Rain: +0.000 in/decade
50-Year Trend
High: +2.24 °F/decade
Low: +0.42 °F/decade
Rain: +0.000 in/decade
All-Time Trend
High: +1.13 °F/decade
Low: +0.21 °F/decade
Rain: +0.000 in/decade
Percentage Above-Average Days
Last 12 Months: 54.1%
This Year: 72.5%
Precipitation Concentration Index (PCI) ℹ️
Last 12 Months: 46.1
Historical Average: 23.7
Percentile Rank of Last 12 Months ℹ️
High: 93rd percentile
Low: 79th percentile
Rain: 16th percentile
Change in Variance ℹ️
High: -1.8%
Low: +7.3%
Intraday: +35.5%
Data Coverage
68.6%
First Year of Data
1948
Station Location
Historical Weather Records
| Max High | Avg High | Min High | Max Avg | Avg Avg | Min Avg | Max Low | Avg Low | Min Low | Max Precipitation | Avg Precipitation | Max Snow | Avg Snow | |
|---|---|---|---|---|---|---|---|---|---|---|---|---|---|
| Record | 113.90 °F | — | 23.79 °F | 98.96 °F | — | 17.60 °F | 80.96 °F | — | -6.52 °F | 1.96 in | — | — | — |
| January | 69.98 °F | 49.50 °F | 23.79 °F | 57.20 °F | 36.05 °F | 17.60 °F | 44.96 °F | 24.55 °F | -6.52 °F | 0.71 in | 0.02 in | — | — |
| February | 77.00 °F | 54.46 °F | 28.04 °F | 62.24 °F | 40.71 °F | 21.56 °F | 51.80 °F | 27.45 °F | 3.92 °F | 1.96 in | 0.02 in | — | — |
| March | 86.00 °F | 62.95 °F | 38.01 °F | 71.24 °F | 49.40 °F | 28.92 °F | 60.80 °F | 34.54 °F | 15.80 °F | 1.10 in | 0.03 in | — | — |
| April | 95.54 °F | 73.37 °F | 43.43 °F | 77.00 °F | 59.88 °F | 36.28 °F | 62.96 °F | 44.49 °F | 22.10 °F | 0.80 in | 0.02 in | — | — |
| May | 104.00 °F | 83.75 °F | 56.48 °F | 89.24 °F | 69.85 °F | 50.05 °F | 70.38 °F | 53.23 °F | 33.80 °F | 0.47 in | 0.01 in | — | — |
| June | 107.96 °F | 94.26 °F | 74.73 °F | 94.64 °F | 80.03 °F | 61.16 °F | 77.36 °F | 61.68 °F | 46.87 °F | 0.68 in | 0.00 in | — | — |
| July | 112.28 °F | 98.16 °F | 77.47 °F | 98.96 °F | 84.31 °F | 66.31 °F | 80.96 °F | 66.09 °F | 51.98 °F | 0.75 in | 0.00 in | — | — |
| August | 113.90 °F | 95.78 °F | 76.32 °F | 98.24 °F | 81.25 °F | 66.74 °F | 80.60 °F | 63.43 °F | 46.40 °F | 0.41 in | 0.00 in | — | — |
| September | 102.56 °F | 89.24 °F | 61.66 °F | 86.54 °F | 73.66 °F | 51.76 °F | 71.60 °F | 55.91 °F | 39.51 °F | 0.40 in | 0.00 in | — | — |
| October | 93.20 °F | 77.28 °F | 53.24 °F | 79.34 °F | 61.61 °F | 40.89 °F | 64.04 °F | 45.91 °F | 26.60 °F | 0.36 in | 0.00 in | — | — |
| November | 86.00 °F | 62.52 °F | 32.00 °F | 66.56 °F | 48.17 °F | 23.36 °F | 55.40 °F | 34.88 °F | 8.60 °F | 0.90 in | 0.02 in | — | — |
| December | 74.12 °F | 52.56 °F | 30.51 °F | 57.56 °F | 39.11 °F | 21.02 °F | 46.40 °F | 27.49 °F | 2.84 °F | 1.38 in | 0.02 in | — | — |
Data Visualisations
Remove WatermarksCurrent Year Climate Trends vs Historical


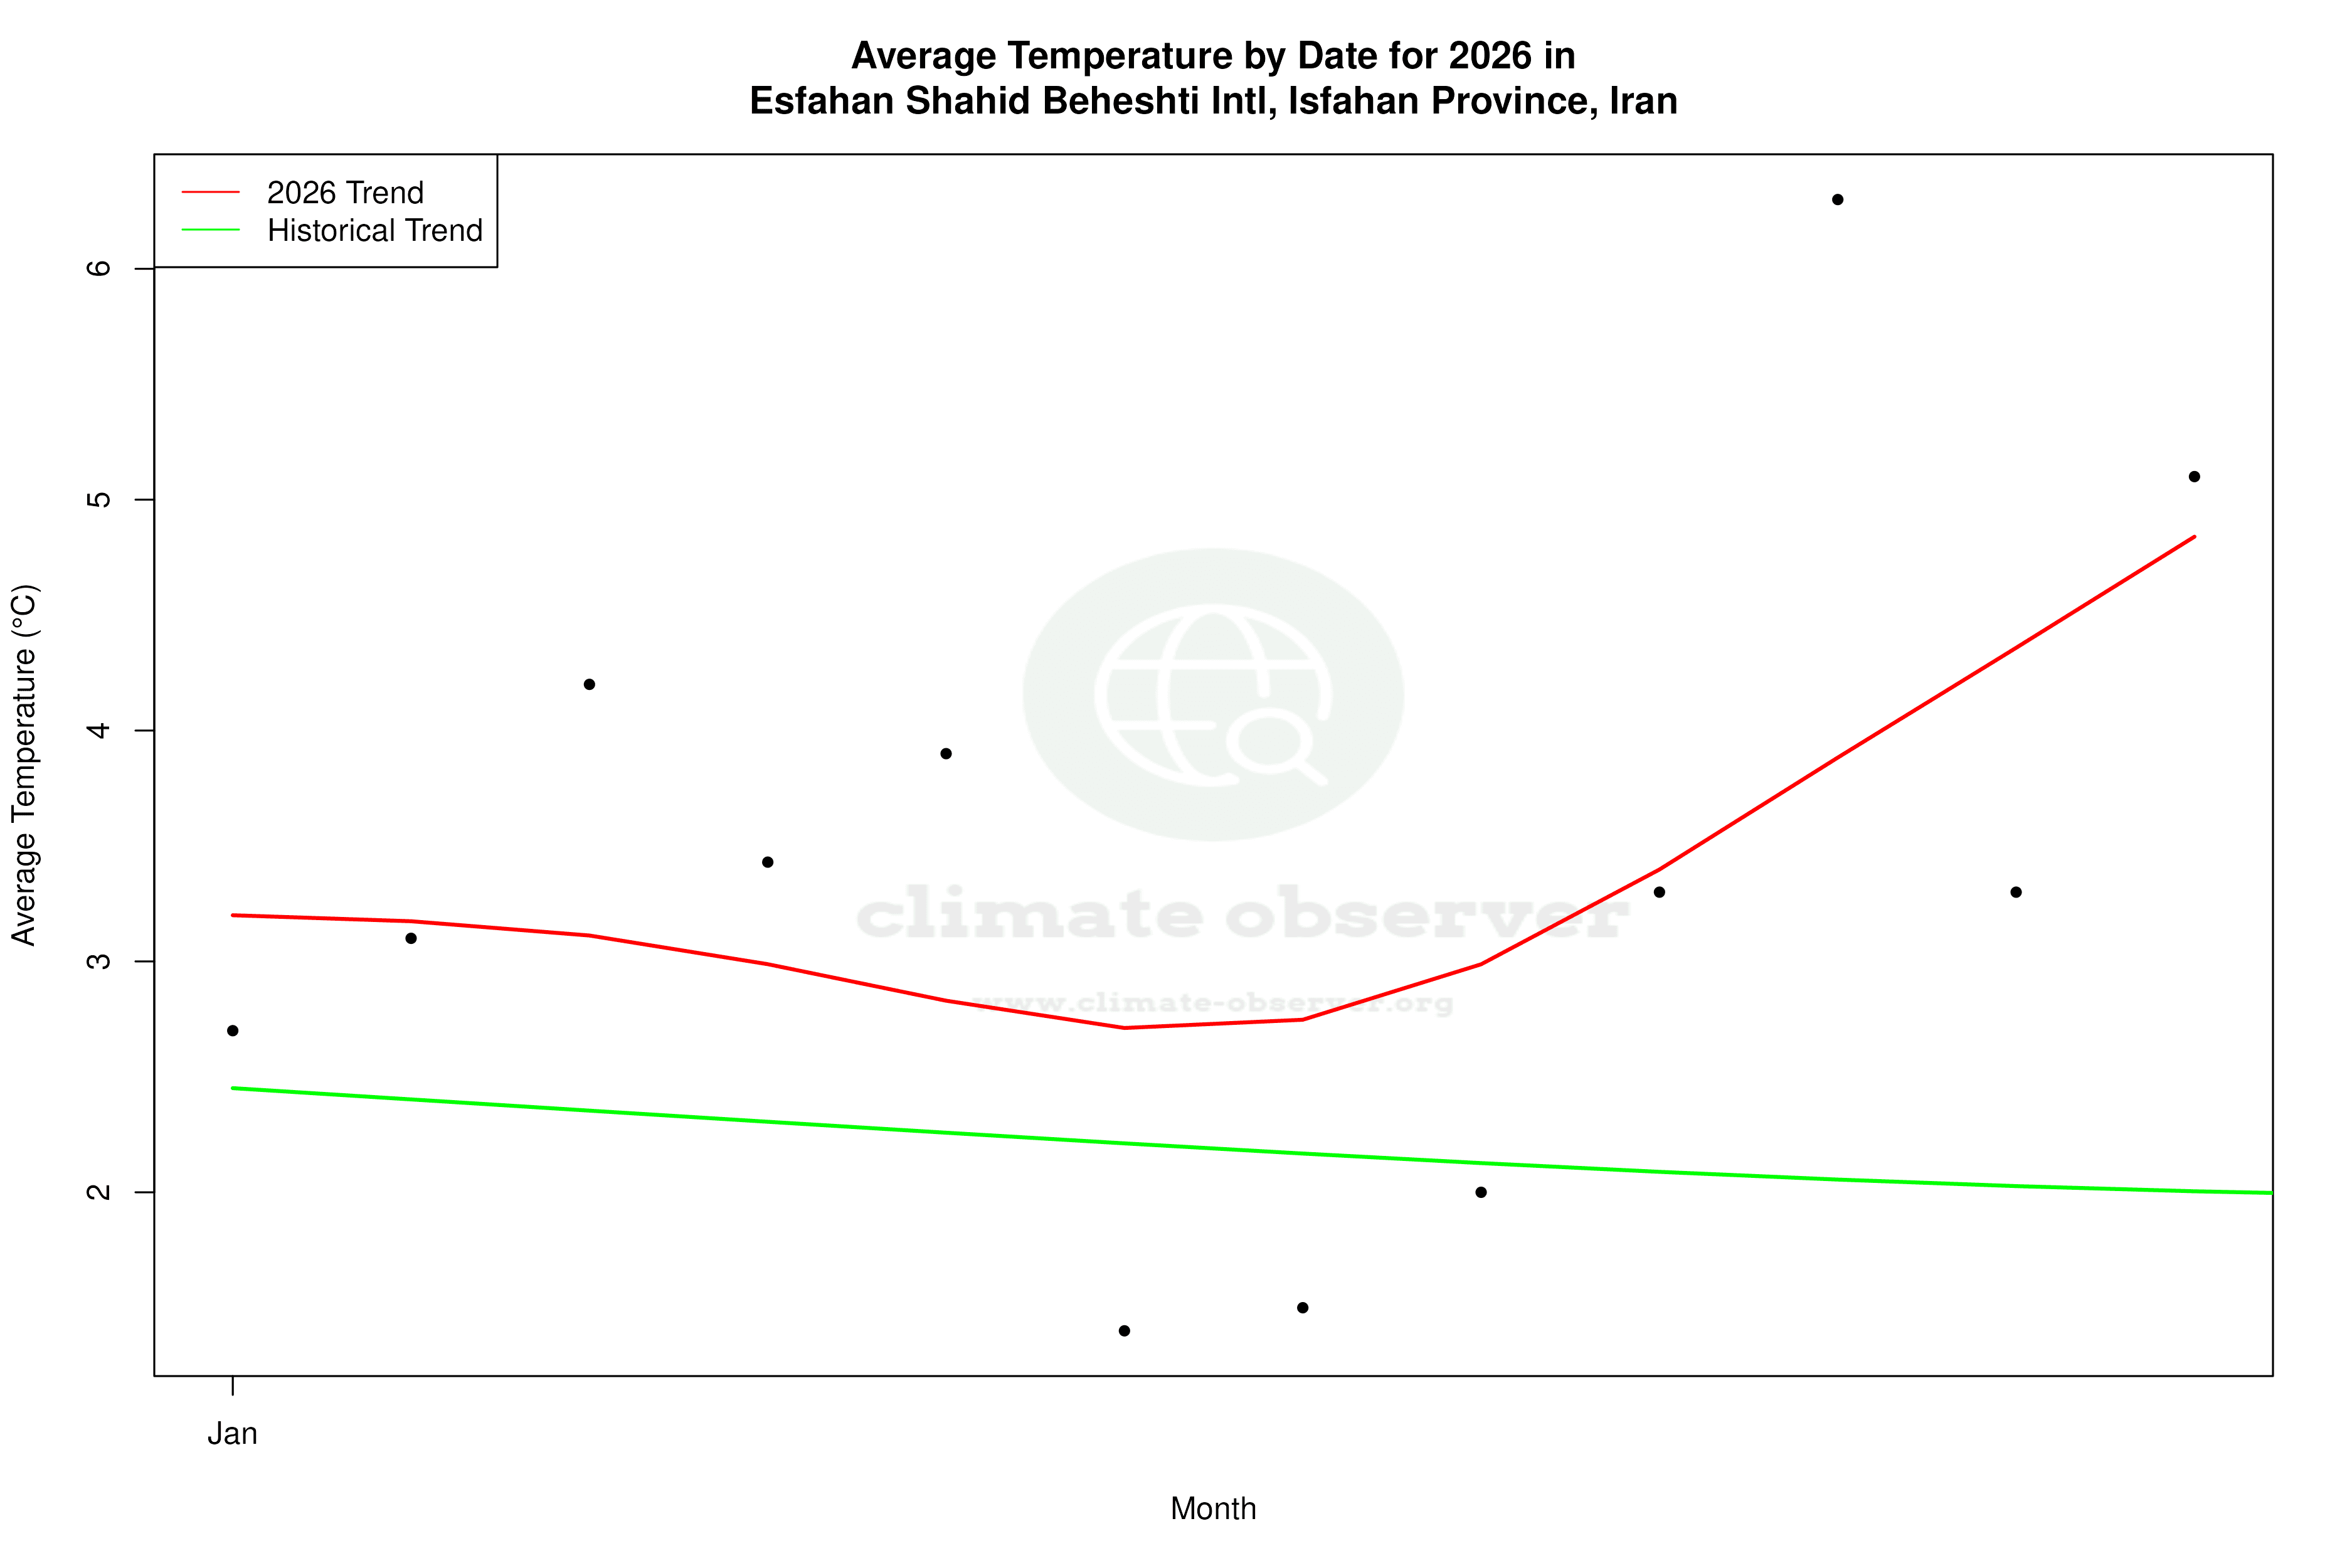


Max Temperature this Year | 1 of 6
Climate 12-Month Moving Averages


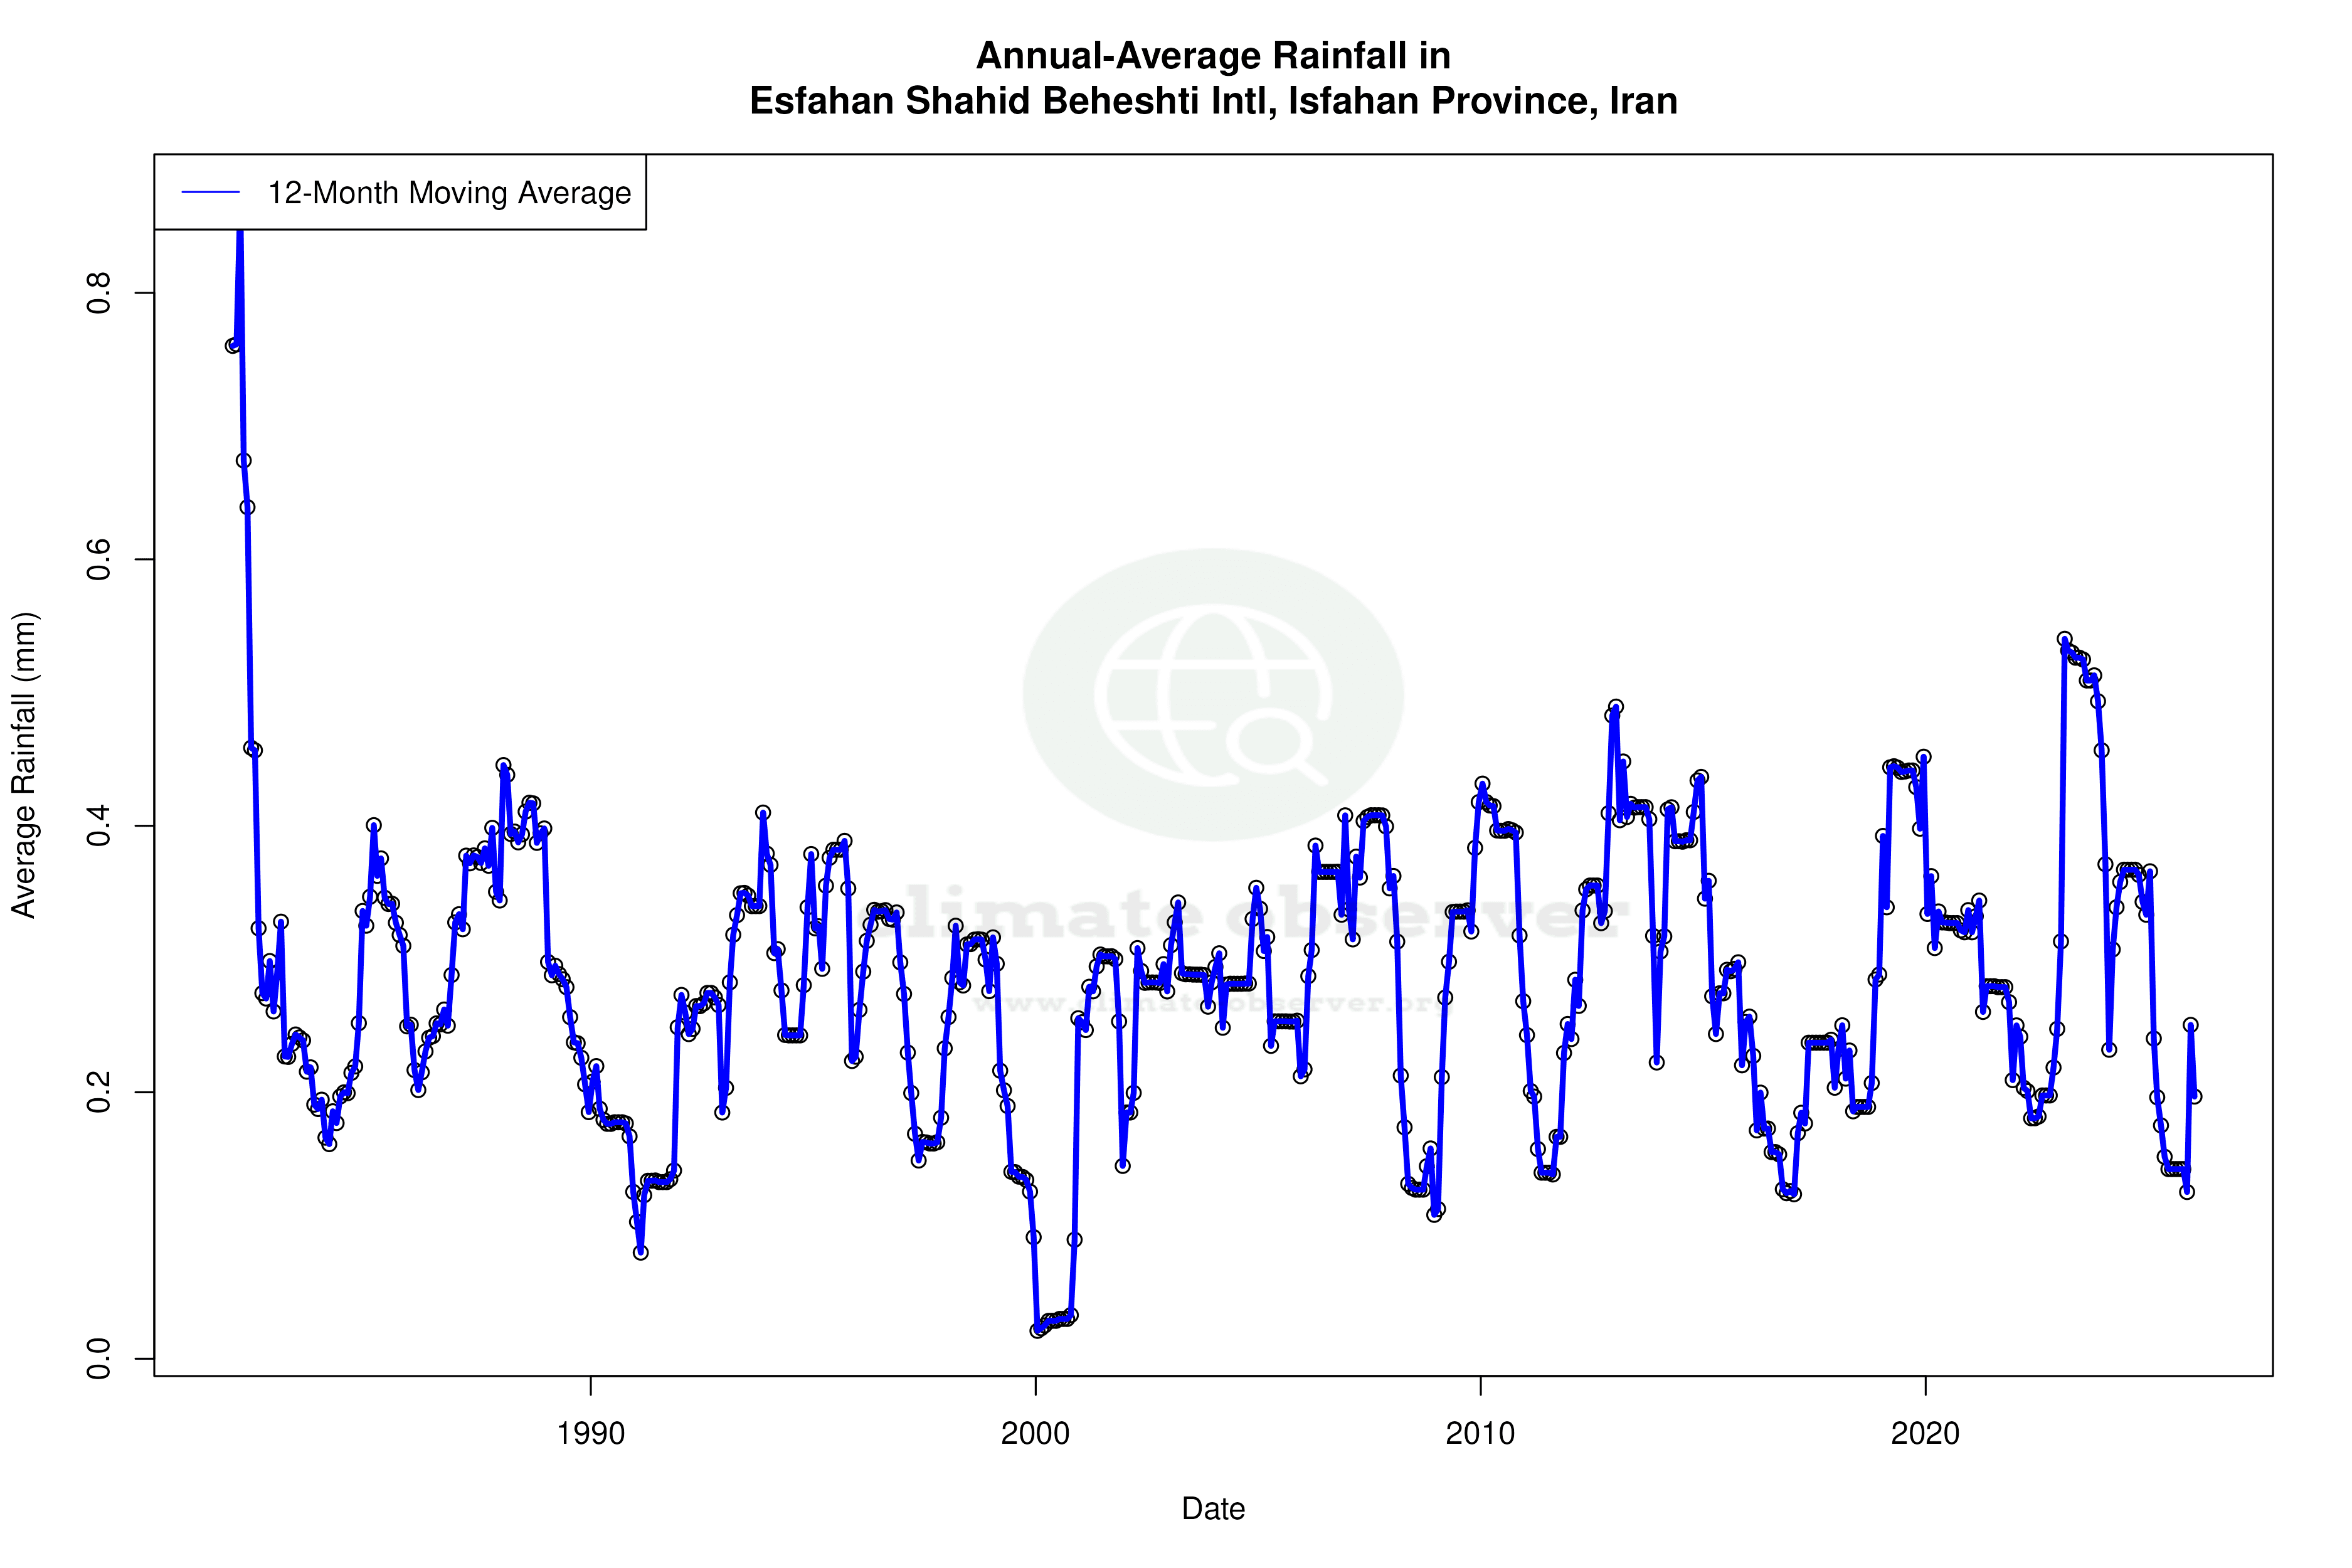


Max Temperature 12-Month MA | 1 of 6
Daily Data Points and Averages Throughout the Year
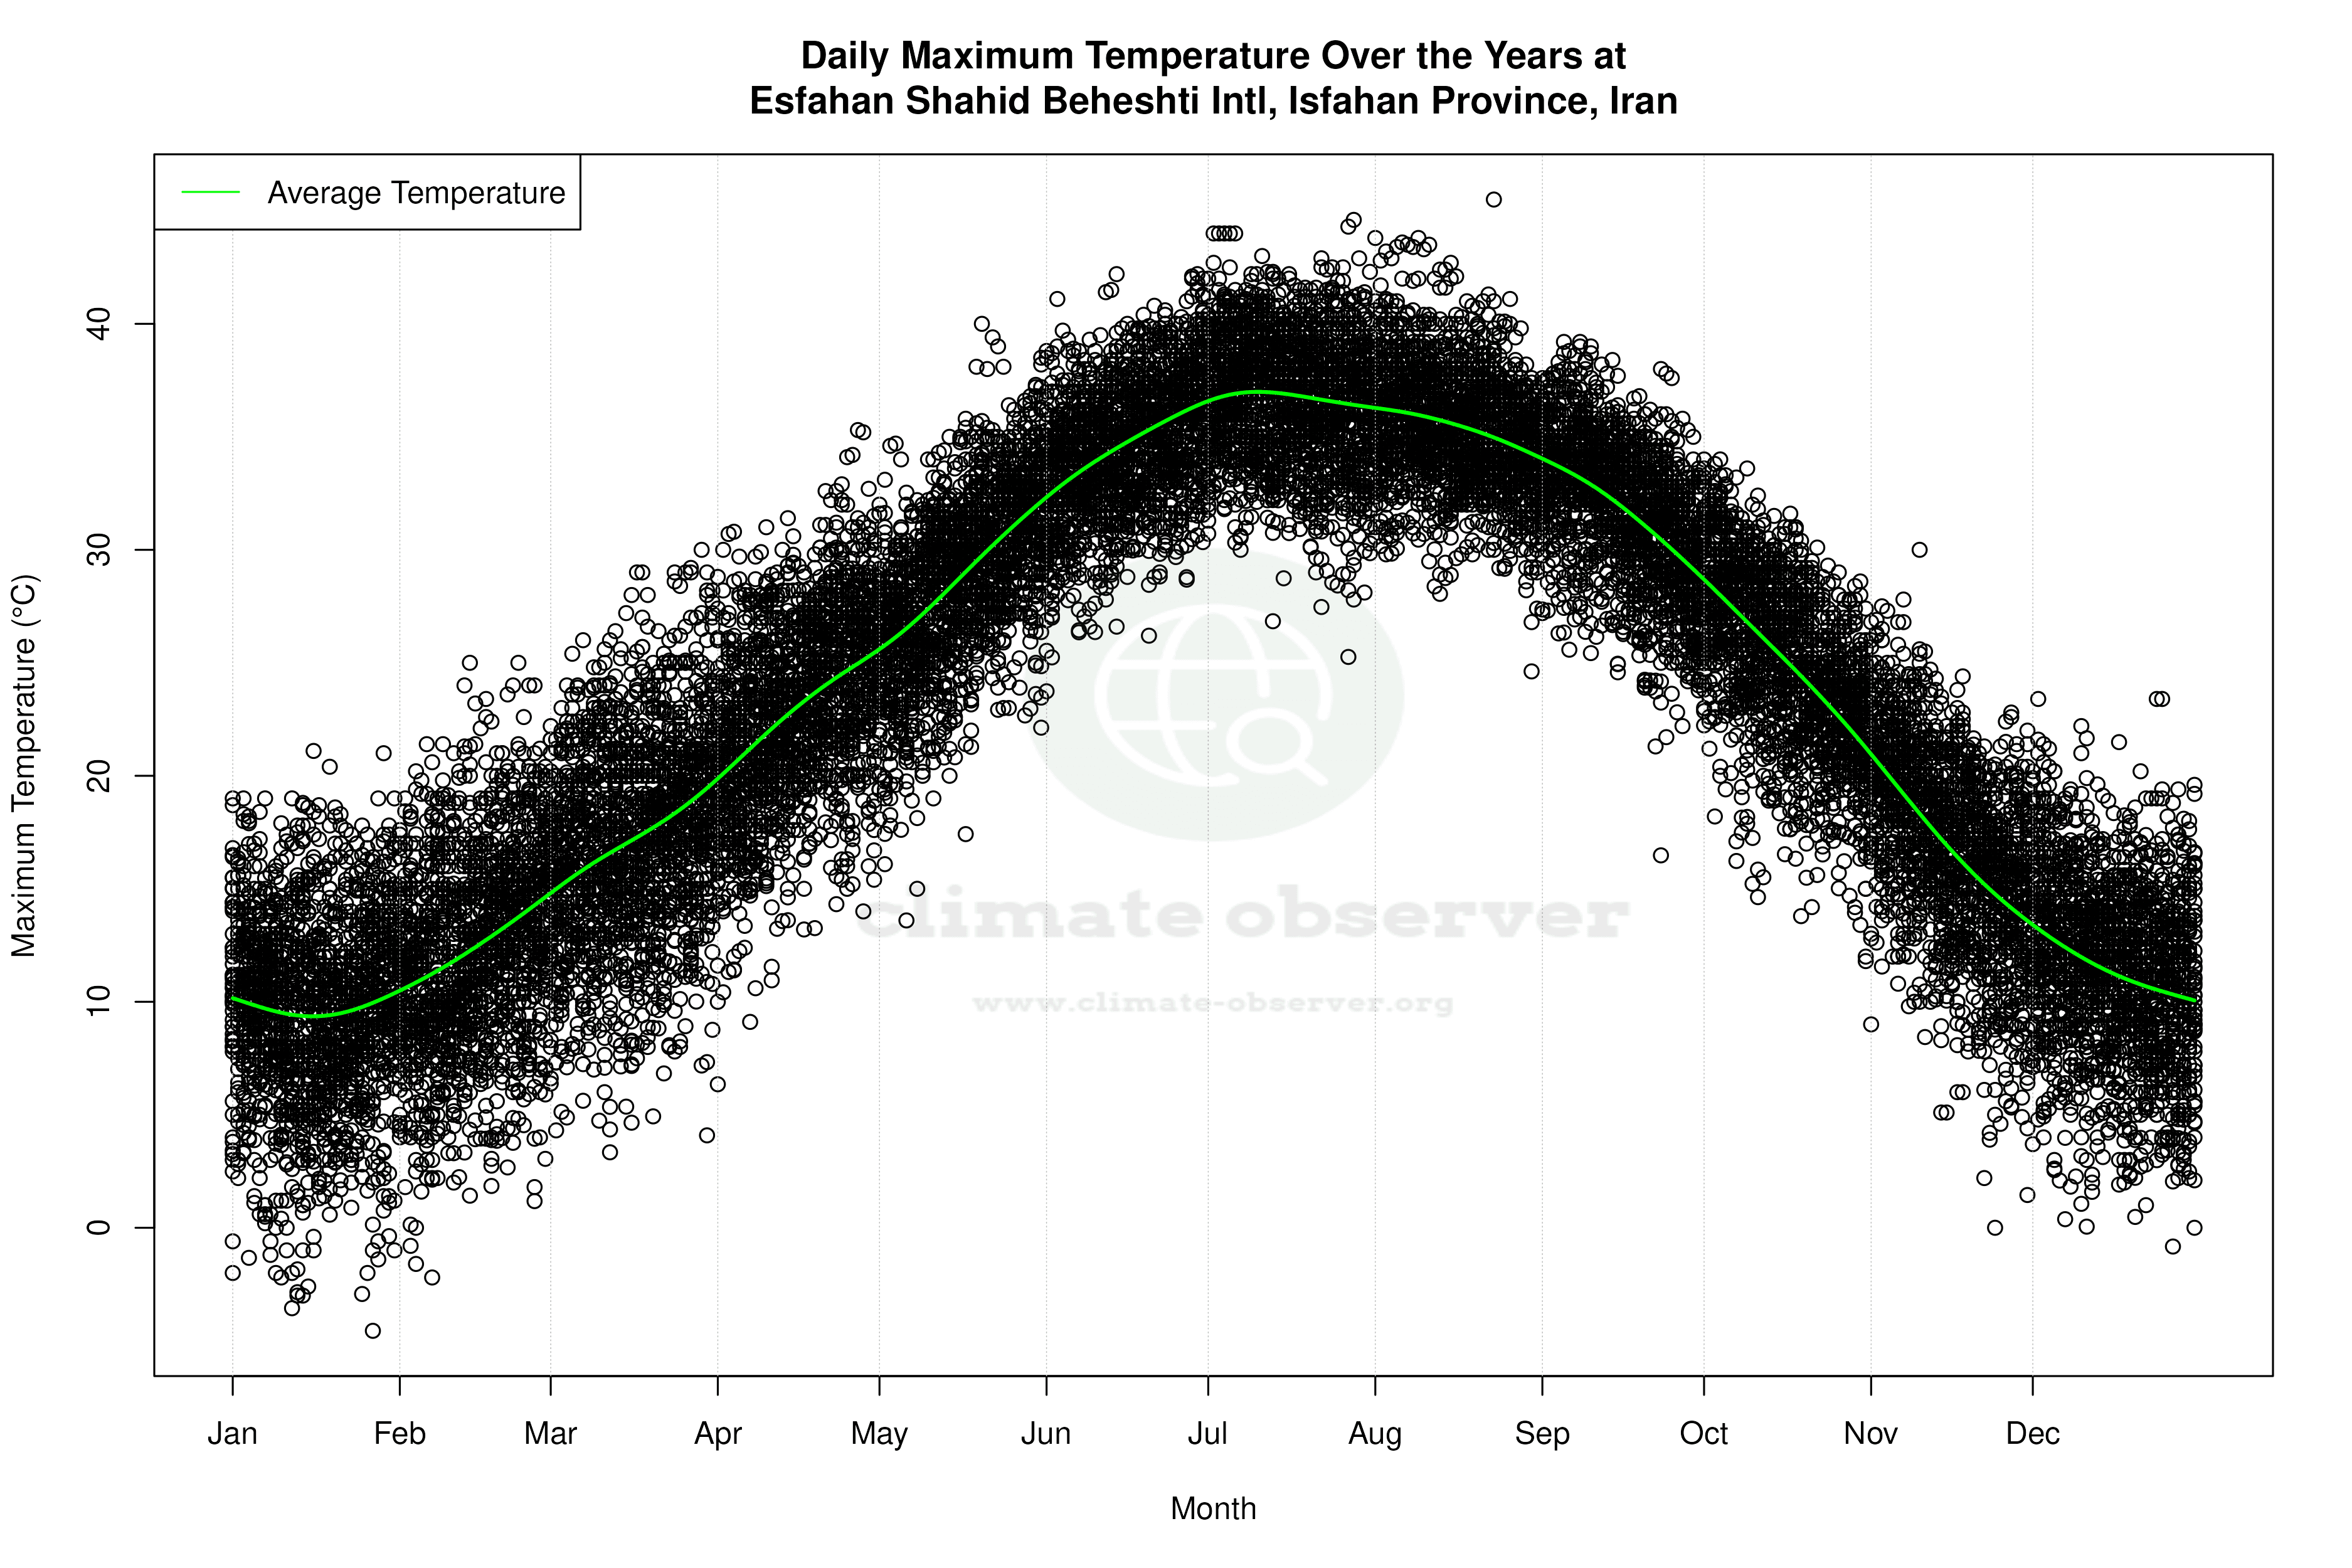


Average Max Temperature Throughout Year | 1 of 5
