Climate for Station: Cagliari, Sardinia, Italy
Loading live weather...
Climate Analysis & Overview
Cagliari, located on the southern coast of Sardinia, is experiencing a warming trend, with notable increases in both high and low temperatures over the past decade. The region's precipitation is becoming significantly more concentrated, indicating a shift towards fewer but more intense rainfall events.
Mediterranean Climate Dynamics
Cagliari, with its coordinates at 39.2331°N, 9.05°E, is classified under the Köppen climate classification as a hot-summer Mediterranean climate (Csa). This classification is characterized by hot, dry summers and mild, wet winters. The city's proximity to the Tyrrhenian Sea moderates temperature extremes, while the surrounding mountainous terrain can influence local weather patterns, often resulting in microclimates.
Warming Trends in Cagliari
Over the past decade, Cagliari has experienced a significant warming trend, with high temperatures increasing by 1.46°C (2.63°F) and low temperatures rising by 0.89°C (1.60°F). In contrast, the all-time trends show a more modest warming, with high temperatures increasing by 0.42°C (0.76°F) and low temperatures by 0.19°C (0.34°F). This discrepancy highlights the accelerated warming the region has faced in recent years, aligning with broader global warming patterns. The record high temperature recorded in Cagliari is 43.8°C (110.8°F), while the record low is -4.8°C (23.4°F), illustrating the range of temperature extremes possible in this Mediterranean locale.
Precipitation Patterns and PCI Insights
The Precipitation Concentration Index (PCI) for Cagliari has shifted from a baseline of 16.3 to a current value of 21.6, indicating a significant increase in precipitation concentration. A PCI value above 20 suggests that rainfall is now more concentrated in fewer, more intense events, which can lead to challenges such as flash flooding and soil erosion. This change is critical for local water management and agricultural planning, as it affects water availability and crop resilience.
Regional Climate Considerations
Cagliari's climate trends are set against the backdrop of Italy's national climate goals, which aim to reduce greenhouse gas emissions and adapt to climate change impacts. The warming trends and increased precipitation concentration in Cagliari underscore the urgency of these initiatives. Recent weather events, such as heatwaves and heavy rainfall, have further emphasized the need for adaptive strategies to mitigate climate risks in the region.
Implications for Local Ecosystems and Economy
The warming trends and altered precipitation patterns have significant implications for Cagliari's ecosystems and economy. The region's biodiversity, particularly in coastal and mountainous areas, may be vulnerable to these changes. Additionally, the local economy, heavily reliant on agriculture and tourism, must adapt to the challenges posed by more extreme weather conditions. These shifts require strategic planning and investment in sustainable practices to ensure resilience in the face of ongoing climate change.
Station Statistics
10-Year Trend
High: +2.44 °F/decade
Low: +2.14 °F/decade
Rain: +0.011 in/decade
25-Year Trend
High: +0.84 °F/decade
Low: +0.65 °F/decade
Rain: +0.004 in/decade
50-Year Trend
High: +0.77 °F/decade
Low: +0.70 °F/decade
Rain: +0.001 in/decade
All-Time Trend
High: +0.74 °F/decade
Low: +0.35 °F/decade
Rain: -0.000 in/decade
Percentage Above-Average Days
Last 12 Months: 51.7%
This Year: 63.8%
Precipitation Concentration Index (PCI) ℹ️
Last 12 Months: 39.8
Historical Average: 16.1
Percentile Rank of Last 12 Months ℹ️
High: 96th percentile
Low: 99th percentile
Rain: 97th percentile
Change in Variance ℹ️
High: +9.5%
Low: +11.9%
Intraday: +3.6%
Data Coverage
89.4%
First Year of Data
1943
Station Location
Historical Weather Records
| Max High | Avg High | Min High | Max Avg | Avg Avg | Min Avg | Max Low | Avg Low | Min Low | Max Precipitation | Avg Precipitation | Max Snow | Avg Snow | |
|---|---|---|---|---|---|---|---|---|---|---|---|---|---|
| Record | 110.84 °F | — | 37.40 °F | 91.04 °F | — | 32.72 °F | 82.76 °F | — | 23.36 °F | 8.58 in | — | — | — |
| January | 71.24 °F | 57.78 °F | 37.40 °F | 63.68 °F | 49.84 °F | 32.72 °F | 59.00 °F | 42.09 °F | 23.36 °F | 1.86 in | 0.06 in | — | — |
| February | 82.58 °F | 58.64 °F | 39.56 °F | 62.42 °F | 50.38 °F | 34.88 °F | 60.80 °F | 42.55 °F | 26.24 °F | 4.31 in | 0.06 in | — | — |
| March | 81.14 °F | 62.08 °F | 41.00 °F | 69.08 °F | 53.62 °F | 37.04 °F | 60.80 °F | 45.32 °F | 28.04 °F | 8.58 in | 0.06 in | — | — |
| April | 83.48 °F | 66.39 °F | 50.00 °F | 69.08 °F | 57.82 °F | 44.60 °F | 64.04 °F | 49.06 °F | 31.28 °F | 1.45 in | 0.05 in | — | — |
| May | 94.28 °F | 73.78 °F | 54.68 °F | 78.44 °F | 64.73 °F | 51.08 °F | 70.16 °F | 55.17 °F | 38.30 °F | 2.01 in | 0.03 in | — | — |
| June | 102.20 °F | 81.71 °F | 64.04 °F | 87.08 °F | 72.25 °F | 58.46 °F | 78.98 °F | 62.29 °F | 44.60 °F | 1.77 in | 0.01 in | — | — |
| July | 110.84 °F | 87.21 °F | 71.96 °F | 91.04 °F | 77.18 °F | 65.48 °F | 79.88 °F | 66.85 °F | 48.92 °F | 0.87 in | 0.00 in | — | — |
| August | 107.24 °F | 87.43 °F | 68.00 °F | 90.68 °F | 77.57 °F | 64.76 °F | 82.76 °F | 67.58 °F | 54.32 °F | 1.31 in | 0.01 in | — | — |
| September | 98.42 °F | 81.57 °F | 66.92 °F | 85.28 °F | 72.37 °F | 60.08 °F | 78.44 °F | 63.39 °F | 48.20 °F | 3.09 in | 0.04 in | — | — |
| October | 92.12 °F | 74.21 °F | 53.96 °F | 78.08 °F | 65.79 °F | 45.68 °F | 75.56 °F | 57.14 °F | 36.68 °F | 3.02 in | 0.06 in | — | — |
| November | 86.00 °F | 65.48 °F | 46.76 °F | 70.88 °F | 57.51 °F | 40.64 °F | 68.00 °F | 49.77 °F | 28.40 °F | 2.76 in | 0.08 in | — | — |
| December | 74.12 °F | 59.84 °F | 42.80 °F | 64.94 °F | 51.98 °F | 35.78 °F | 62.24 °F | 44.48 °F | 25.88 °F | 4.03 in | 0.07 in | — | — |
Data Visualisations
Remove WatermarksCurrent Year Climate Trends vs Historical

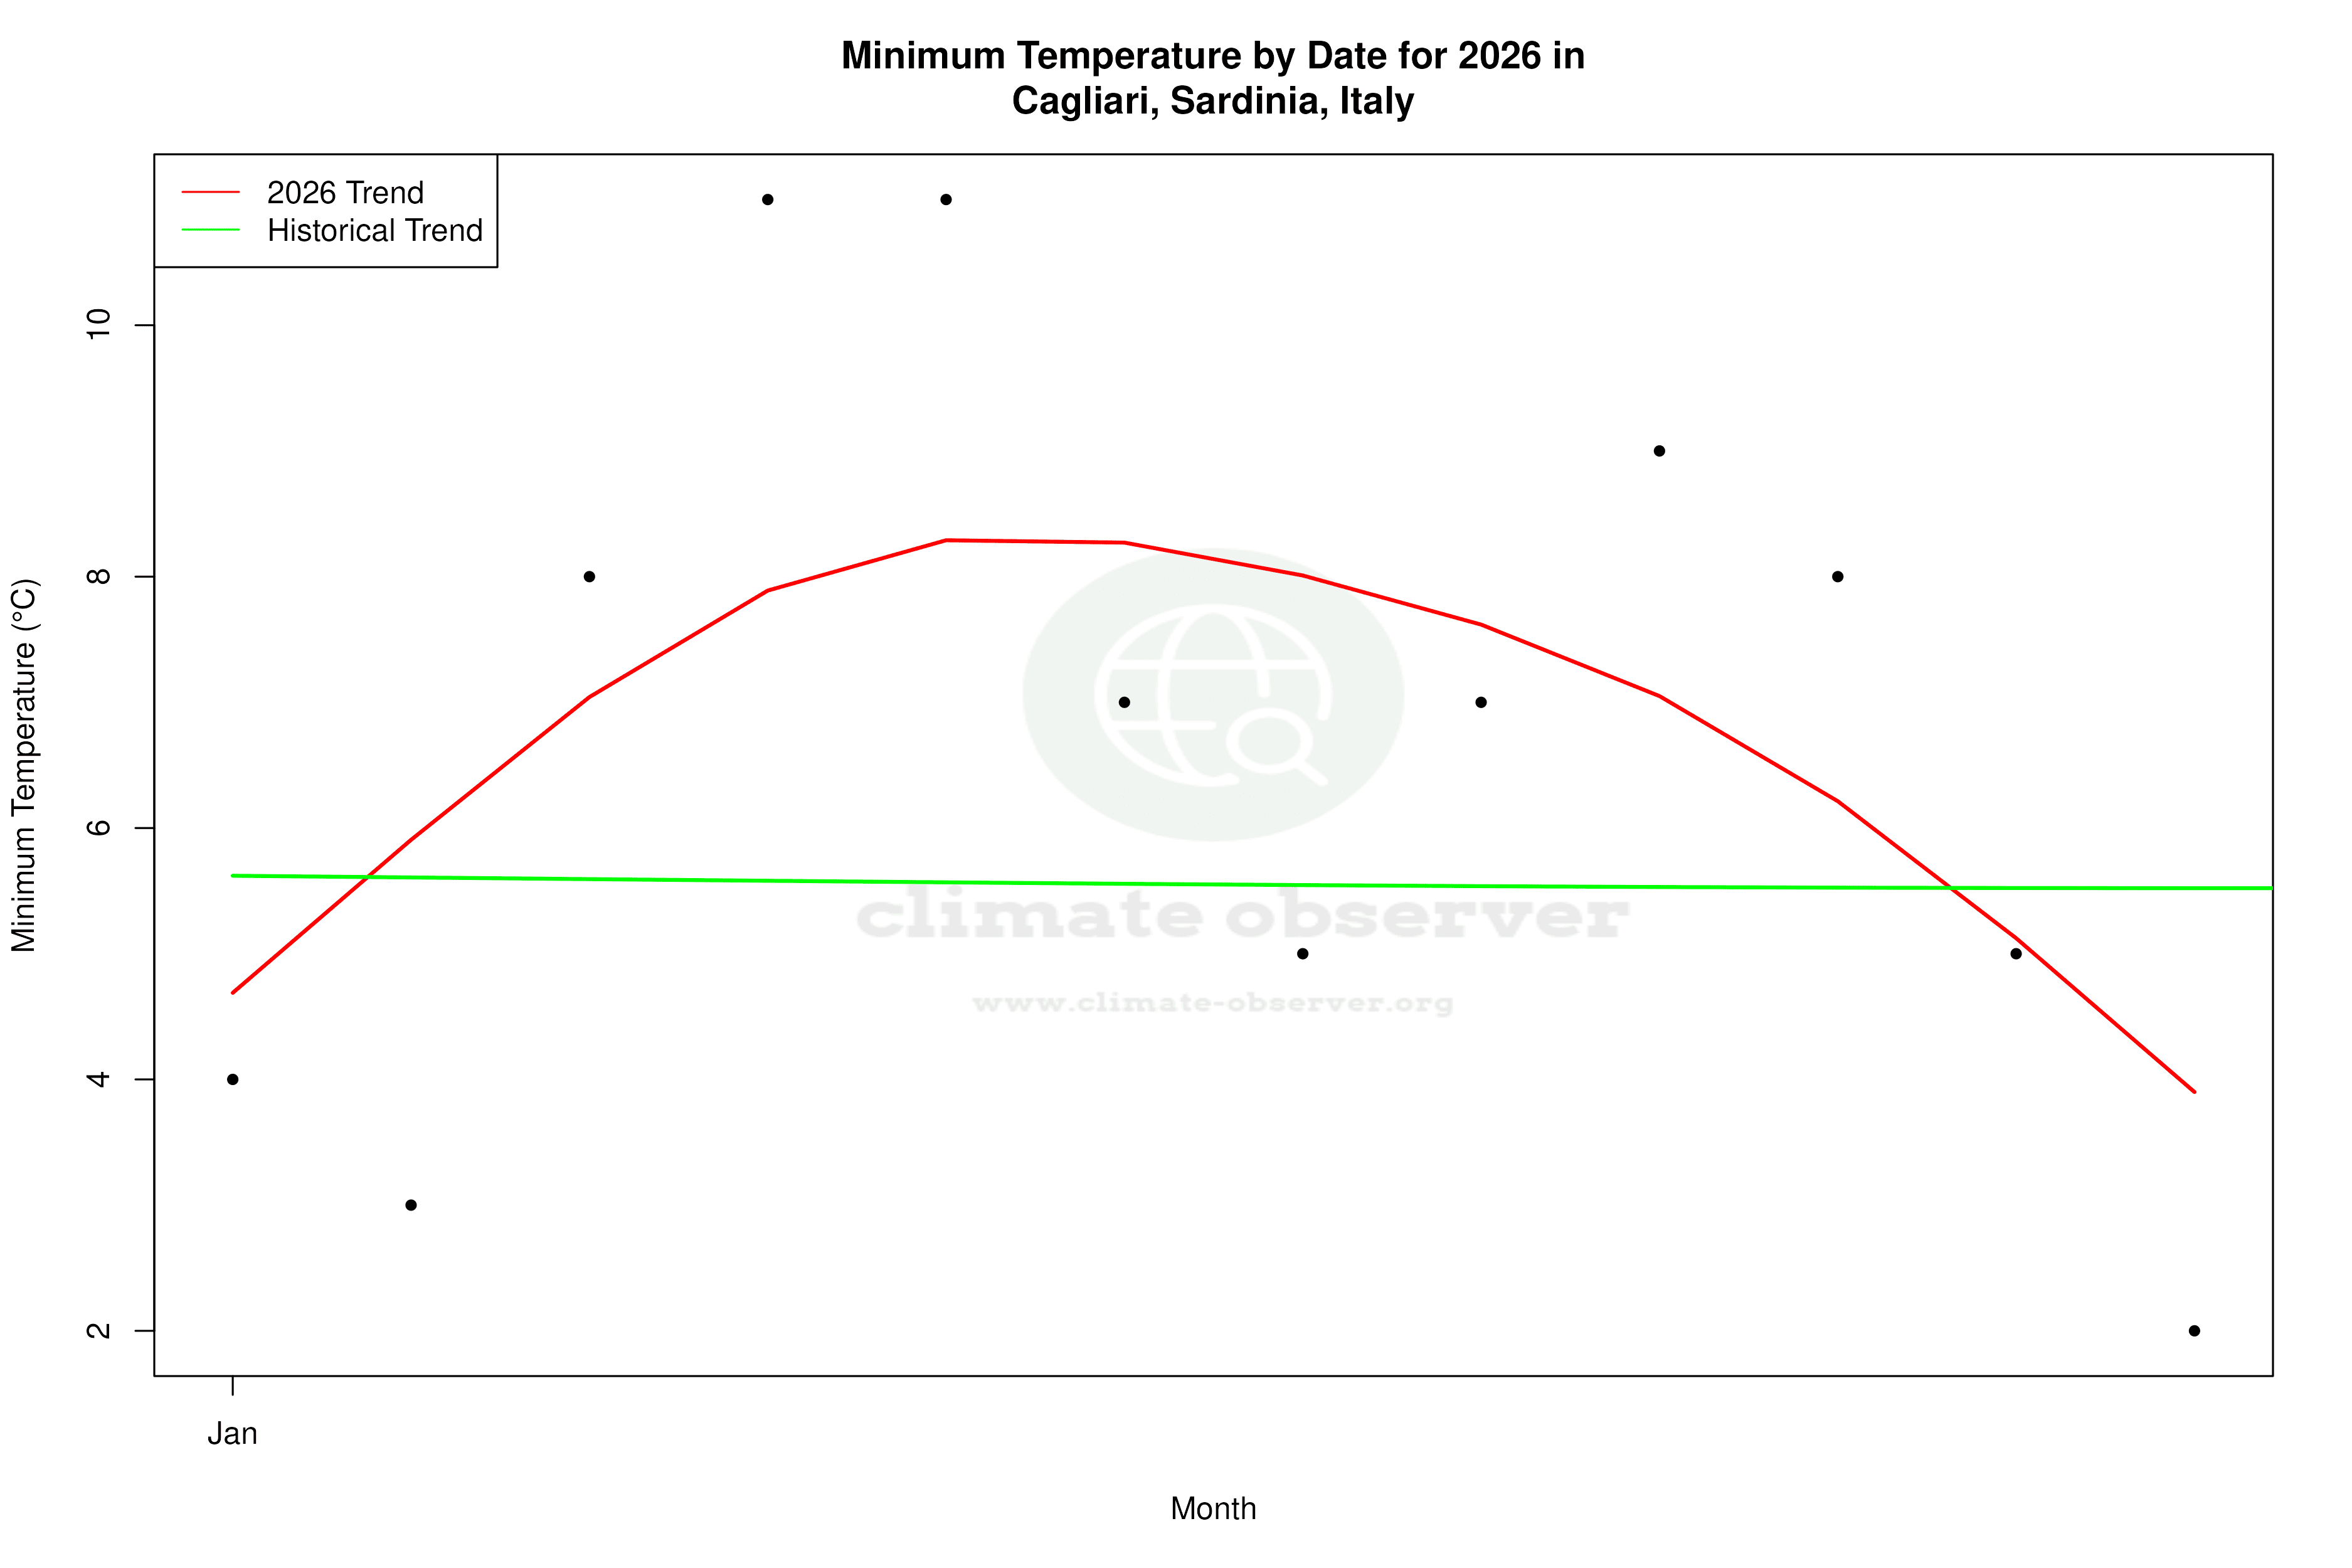


Max Temperature this Year | 1 of 6
Climate 12-Month Moving Averages


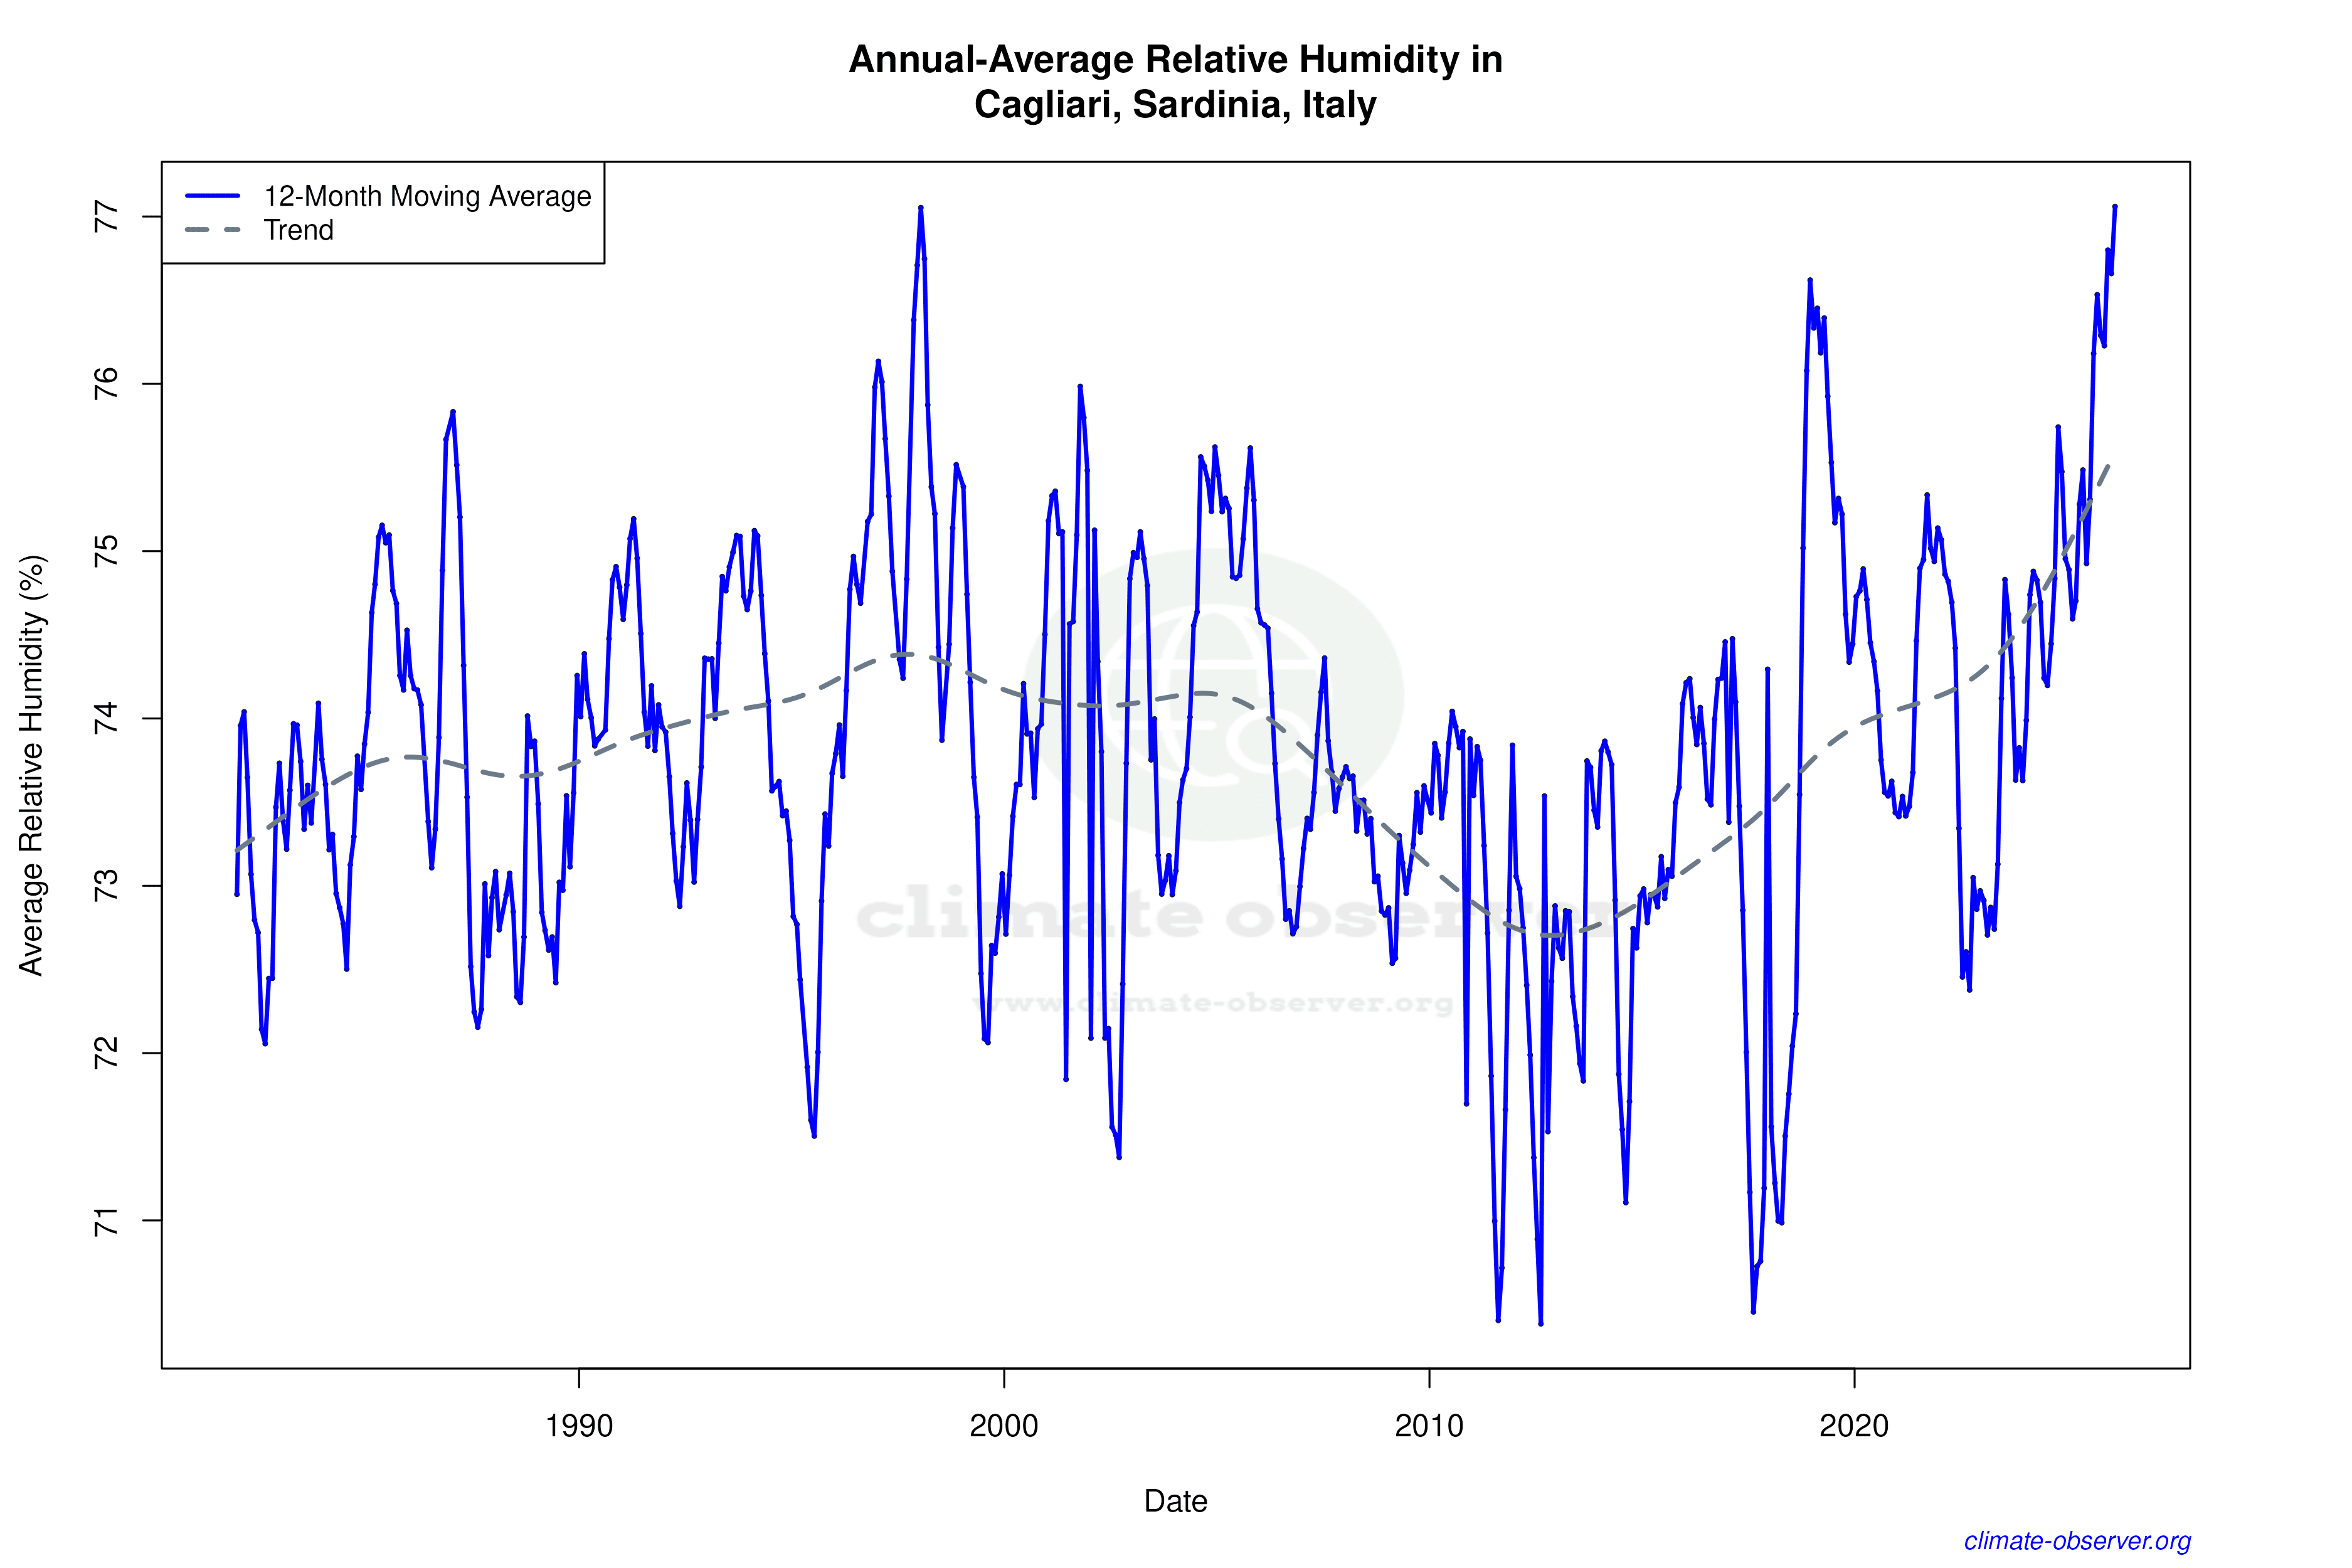

Max Temperature 12-Month MA | 1 of 6
Daily Data Points and Averages Throughout the Year


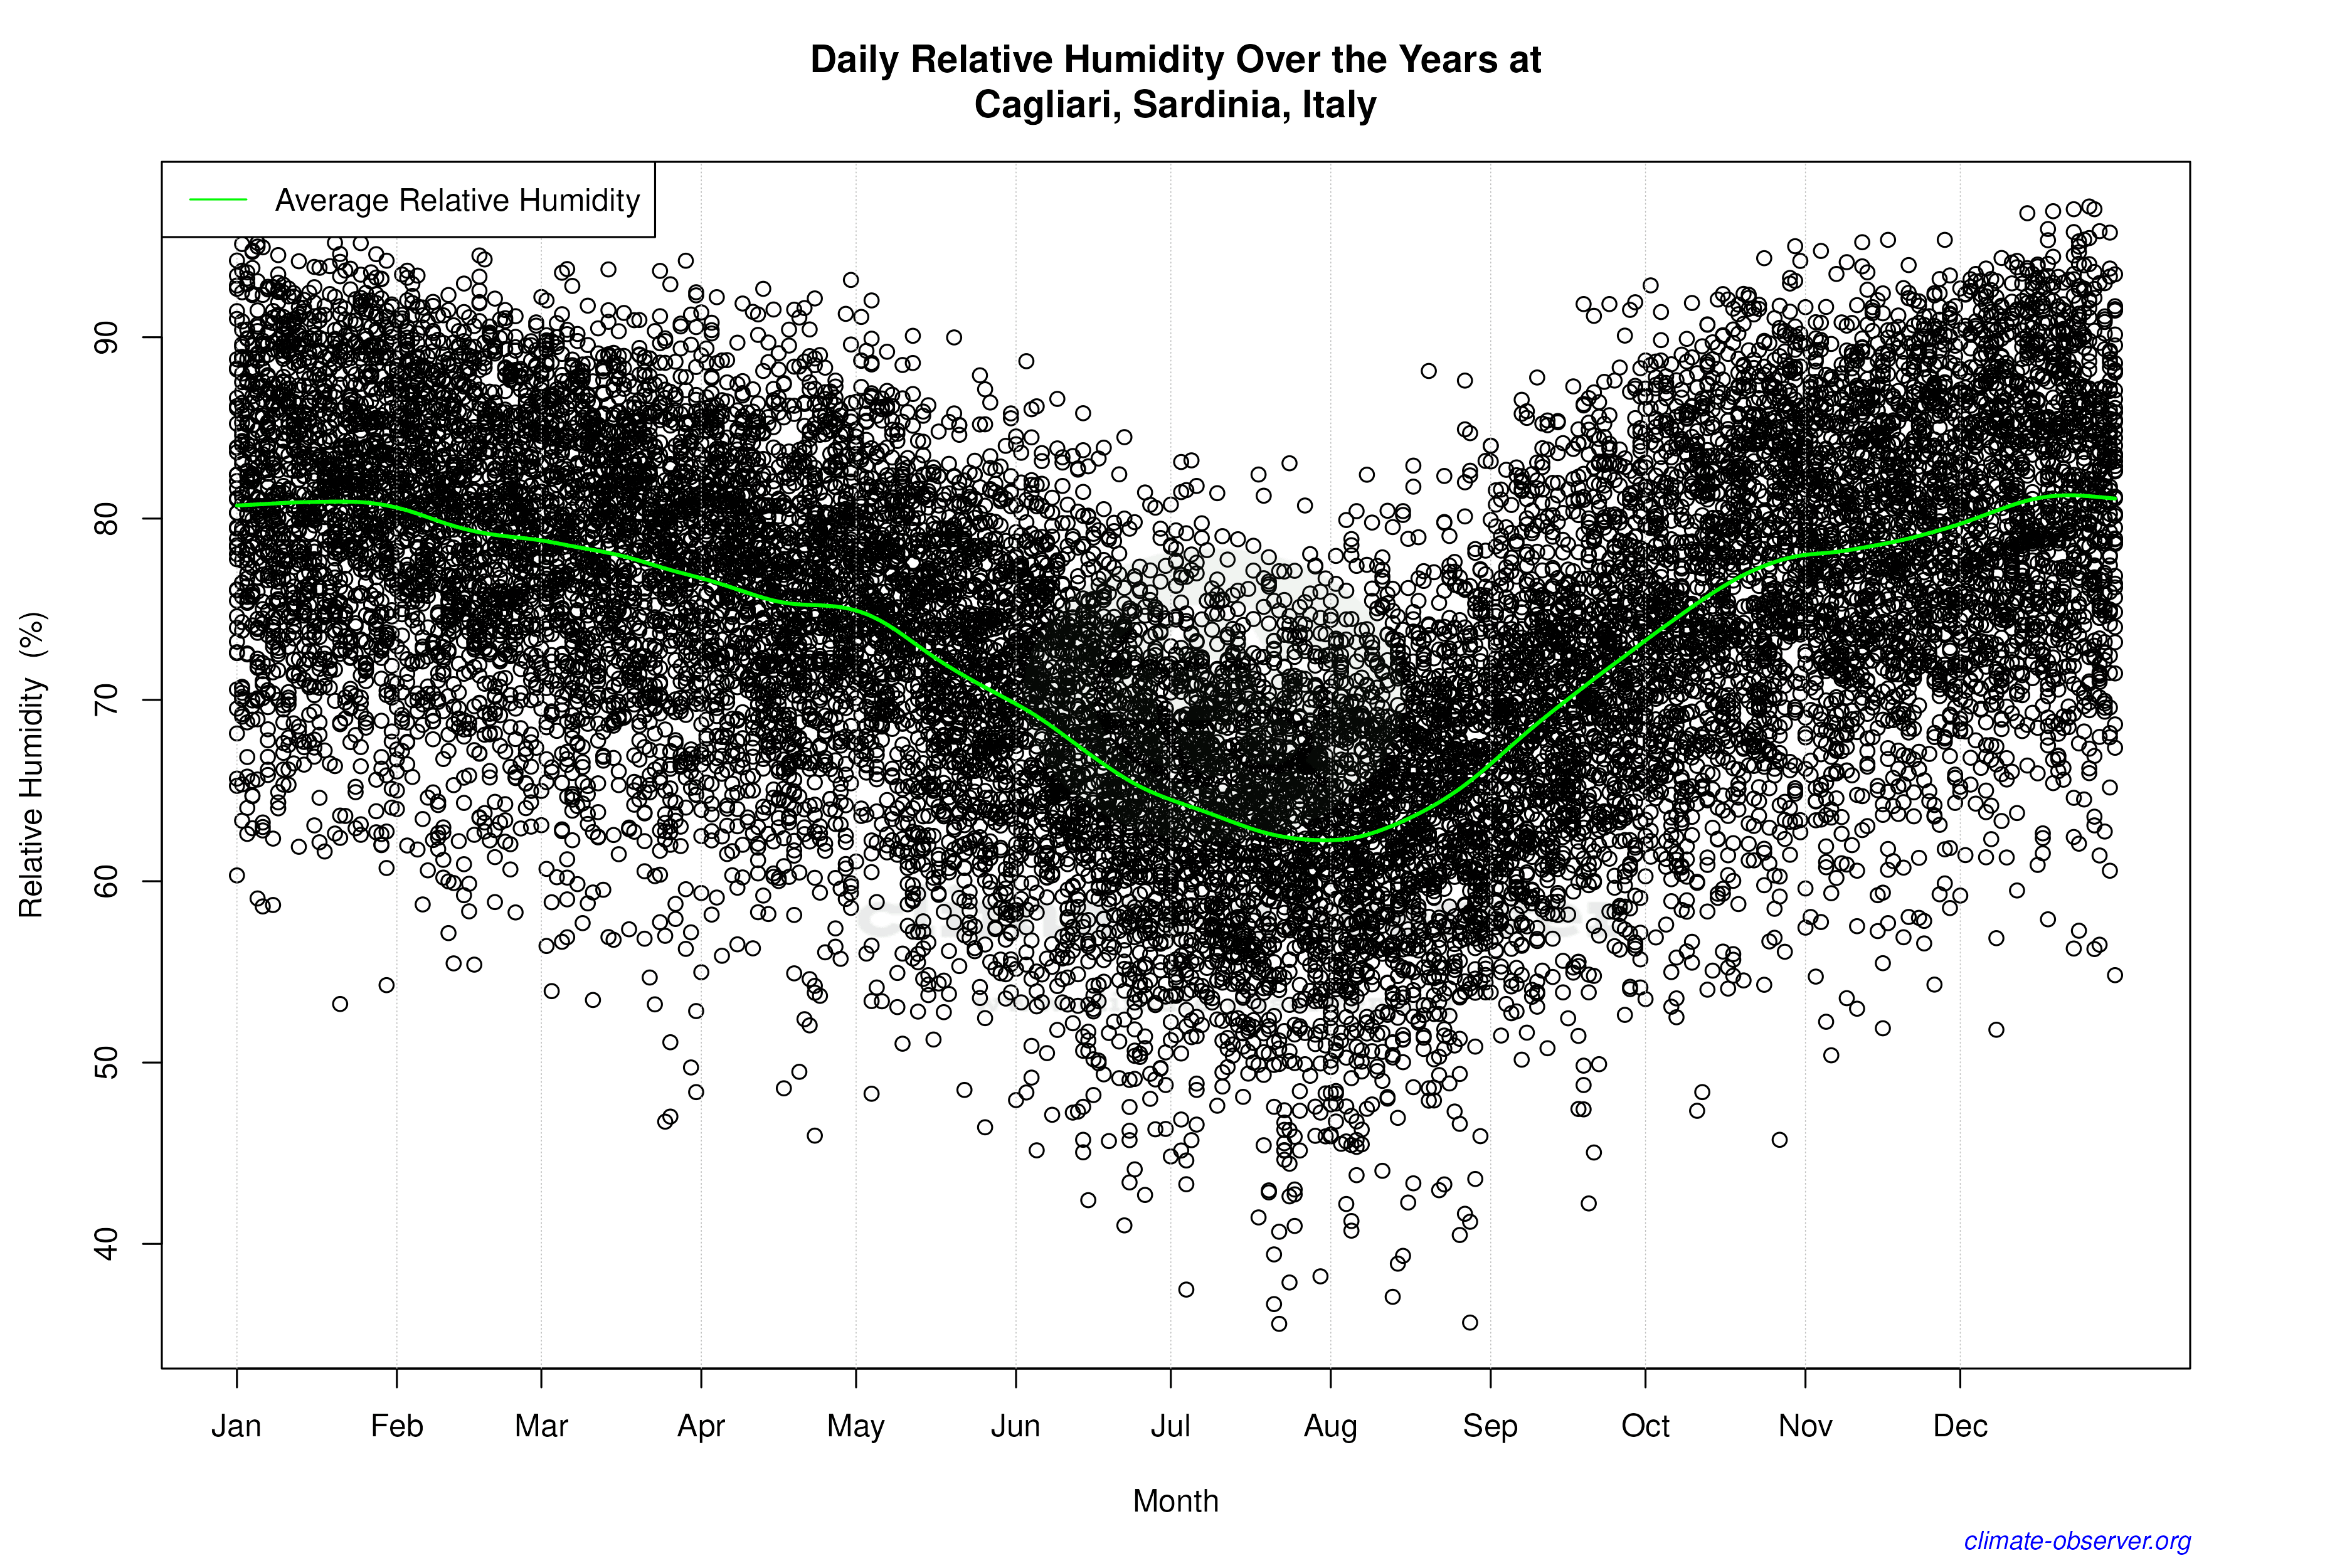

Average Max Temperature Throughout Year | 1 of 5
