Climate for Station: Man, Montagnes, Cote D'Ivoire
Loading live weather...
Climate Analysis & Overview
The climate profile of Bodrou, Côte d’Ivoire reveals a nuanced picture of warming trends, with a notable increase in high temperatures over the past decade. Meanwhile, precipitation patterns have become more evenly distributed, suggesting a shift in local weather dynamics.
Geographical Influence on Climate
Bodrou, located in the Guémon region of Côte d’Ivoire, is characterised by a tropical climate, specifically classified under the Köppen system as 'Aw'—a tropical savanna climate with a distinct wet and dry season. The region's geography, nestled between the Montagnes district's lush landscapes, plays a pivotal role in shaping its climatic conditions. The proximity to mountainous terrain can influence local weather patterns, contributing to variations in temperature and precipitation.
Temperature Trends: A Dual Narrative
Over the past decade, Bodrou has experienced a significant warming trend, with high temperatures rising by 0.92°C (1.66°F) and low temperatures by 0.35°C (0.63°F). This short-term trend suggests a notable increase in temperature extremes. In contrast, the all-time trends reveal a more modest warming, with highs increasing by 0.16°C (0.29°F) and lows by 0.16°C (0.30°F). This discrepancy between the 10-year and all-time data highlights a recent acceleration in temperature rise, which is crucial for understanding future climate scenarios.
Extreme Temperature Records
Bodrou's recorded temperatures exhibit significant variability, with an all-time maximum of 39.4°C (102.9°F) and a minimum of 6.0°C (42.8°F). These extremes underscore the region's capacity for both intense heat and cooler conditions, reflective of its tropical savanna classification. The maximum temperature, in particular, suggests occasional heatwaves that could impact local agriculture and water resources.
Precipitation Patterns: A Shift Towards Even Distribution
The Precipitation Concentration Index (PCI) for Bodrou has decreased from a baseline of 13.80 to a current value of 11.50. This change indicates a more even distribution of rainfall events, as a lower PCI suggests less concentration of precipitation in fewer events. Such a shift could have implications for water management and agricultural planning, as more evenly distributed rainfall can reduce the risk of flooding and drought.
Regional Climate Context
Côte d’Ivoire has been actively pursuing climate resilience and adaptation strategies, aiming to mitigate the impacts of climate change on its diverse ecosystems and economies. The trends observed in Bodrou align with broader regional efforts to understand and adapt to changing climatic conditions. Recent weather events, such as variable rainfall patterns and temperature fluctuations, highlight the importance of continuous monitoring and adaptive management strategies in the face of climate change.
Station Statistics
10-Year Trend
High: +1.27 °F/decade
Low: +1.08 °F/decade
Rain: -0.058 in/decade
25-Year Trend
High: +0.83 °F/decade
Low: +0.08 °F/decade
Rain: +0.034 in/decade
50-Year Trend
High: +0.47 °F/decade
Low: +0.42 °F/decade
Rain: -0.001 in/decade
All-Time Trend
High: +0.25 °F/decade
Low: +0.24 °F/decade
Rain: +0.000 in/decade
Percentage Above-Average Days
Last 12 Months: 64.6%
This Year: 72.5%
Precipitation Concentration Index (PCI) ℹ️
Last 12 Months: 12.0
Historical Average: 13.0
Percentile Rank of Last 12 Months ℹ️
High: 87th percentile
Low: 90th percentile
Rain: 22nd percentile
Change in Variance ℹ️
High: -10.0%
Low: +19.5%
Intraday: +24.3%
Data Coverage
89.9%
First Year of Data
1945
Station Location
Historical Weather Records
| Max High | Avg High | Min High | Max Avg | Avg Avg | Min Avg | Max Low | Avg Low | Min Low | Max Precipitation | Avg Precipitation | Max Snow | Avg Snow | |
|---|---|---|---|---|---|---|---|---|---|---|---|---|---|
| Record | 102.92 °F | — | 69.44 °F | 89.24 °F | — | 59.90 °F | 84.56 °F | — | 42.80 °F | 7.15 in | — | — | — |
| January | 100.60 °F | 89.86 °F | 74.91 °F | 86.18 °F | 75.60 °F | 59.90 °F | 74.89 °F | 62.58 °F | 42.80 °F | 2.11 in | 0.01 in | — | — |
| February | 102.38 °F | 92.29 °F | 73.85 °F | 89.24 °F | 79.24 °F | 62.42 °F | 77.00 °F | 67.21 °F | 48.20 °F | 3.07 in | 0.07 in | — | — |
| March | 102.92 °F | 91.07 °F | 75.38 °F | 88.88 °F | 80.16 °F | 71.51 °F | 77.18 °F | 70.34 °F | 55.76 °F | 3.90 in | 0.14 in | — | — |
| April | 100.54 °F | 89.18 °F | 75.18 °F | 89.24 °F | 79.63 °F | 69.80 °F | 76.64 °F | 70.89 °F | 60.44 °F | 6.30 in | 0.20 in | — | — |
| May | 95.90 °F | 87.36 °F | 74.48 °F | 87.62 °F | 78.71 °F | 72.14 °F | 77.00 °F | 70.79 °F | 63.14 °F | 4.56 in | 0.20 in | — | — |
| June | 94.44 °F | 84.46 °F | 72.50 °F | 88.16 °F | 76.79 °F | 70.54 °F | 75.56 °F | 69.84 °F | 60.80 °F | 5.59 in | 0.27 in | — | — |
| July | 98.60 °F | 81.83 °F | 70.88 °F | 82.58 °F | 74.98 °F | 67.10 °F | 74.12 °F | 68.81 °F | 59.18 °F | 3.85 in | 0.25 in | — | — |
| August | 92.30 °F | 81.48 °F | 69.44 °F | 81.32 °F | 74.78 °F | 69.57 °F | 75.20 °F | 68.68 °F | 59.90 °F | 5.59 in | 0.33 in | — | — |
| September | 95.00 °F | 83.29 °F | 70.88 °F | 83.48 °F | 75.58 °F | 69.26 °F | 74.12 °F | 69.05 °F | 61.88 °F | 7.15 in | 0.37 in | — | — |
| October | 95.00 °F | 85.07 °F | 74.12 °F | 84.56 °F | 76.50 °F | 69.98 °F | 74.12 °F | 69.04 °F | 62.06 °F | 4.76 in | 0.22 in | — | — |
| November | 95.63 °F | 86.58 °F | 73.45 °F | 83.66 °F | 76.92 °F | 68.90 °F | 73.58 °F | 68.01 °F | 55.40 °F | 2.11 in | 0.08 in | — | — |
| December | 98.60 °F | 87.33 °F | 74.88 °F | 84.20 °F | 74.95 °F | 60.08 °F | 84.56 °F | 63.73 °F | 46.04 °F | 2.14 in | 0.02 in | — | — |
Data Visualisations
Remove WatermarksCurrent Year Climate Trends vs Historical

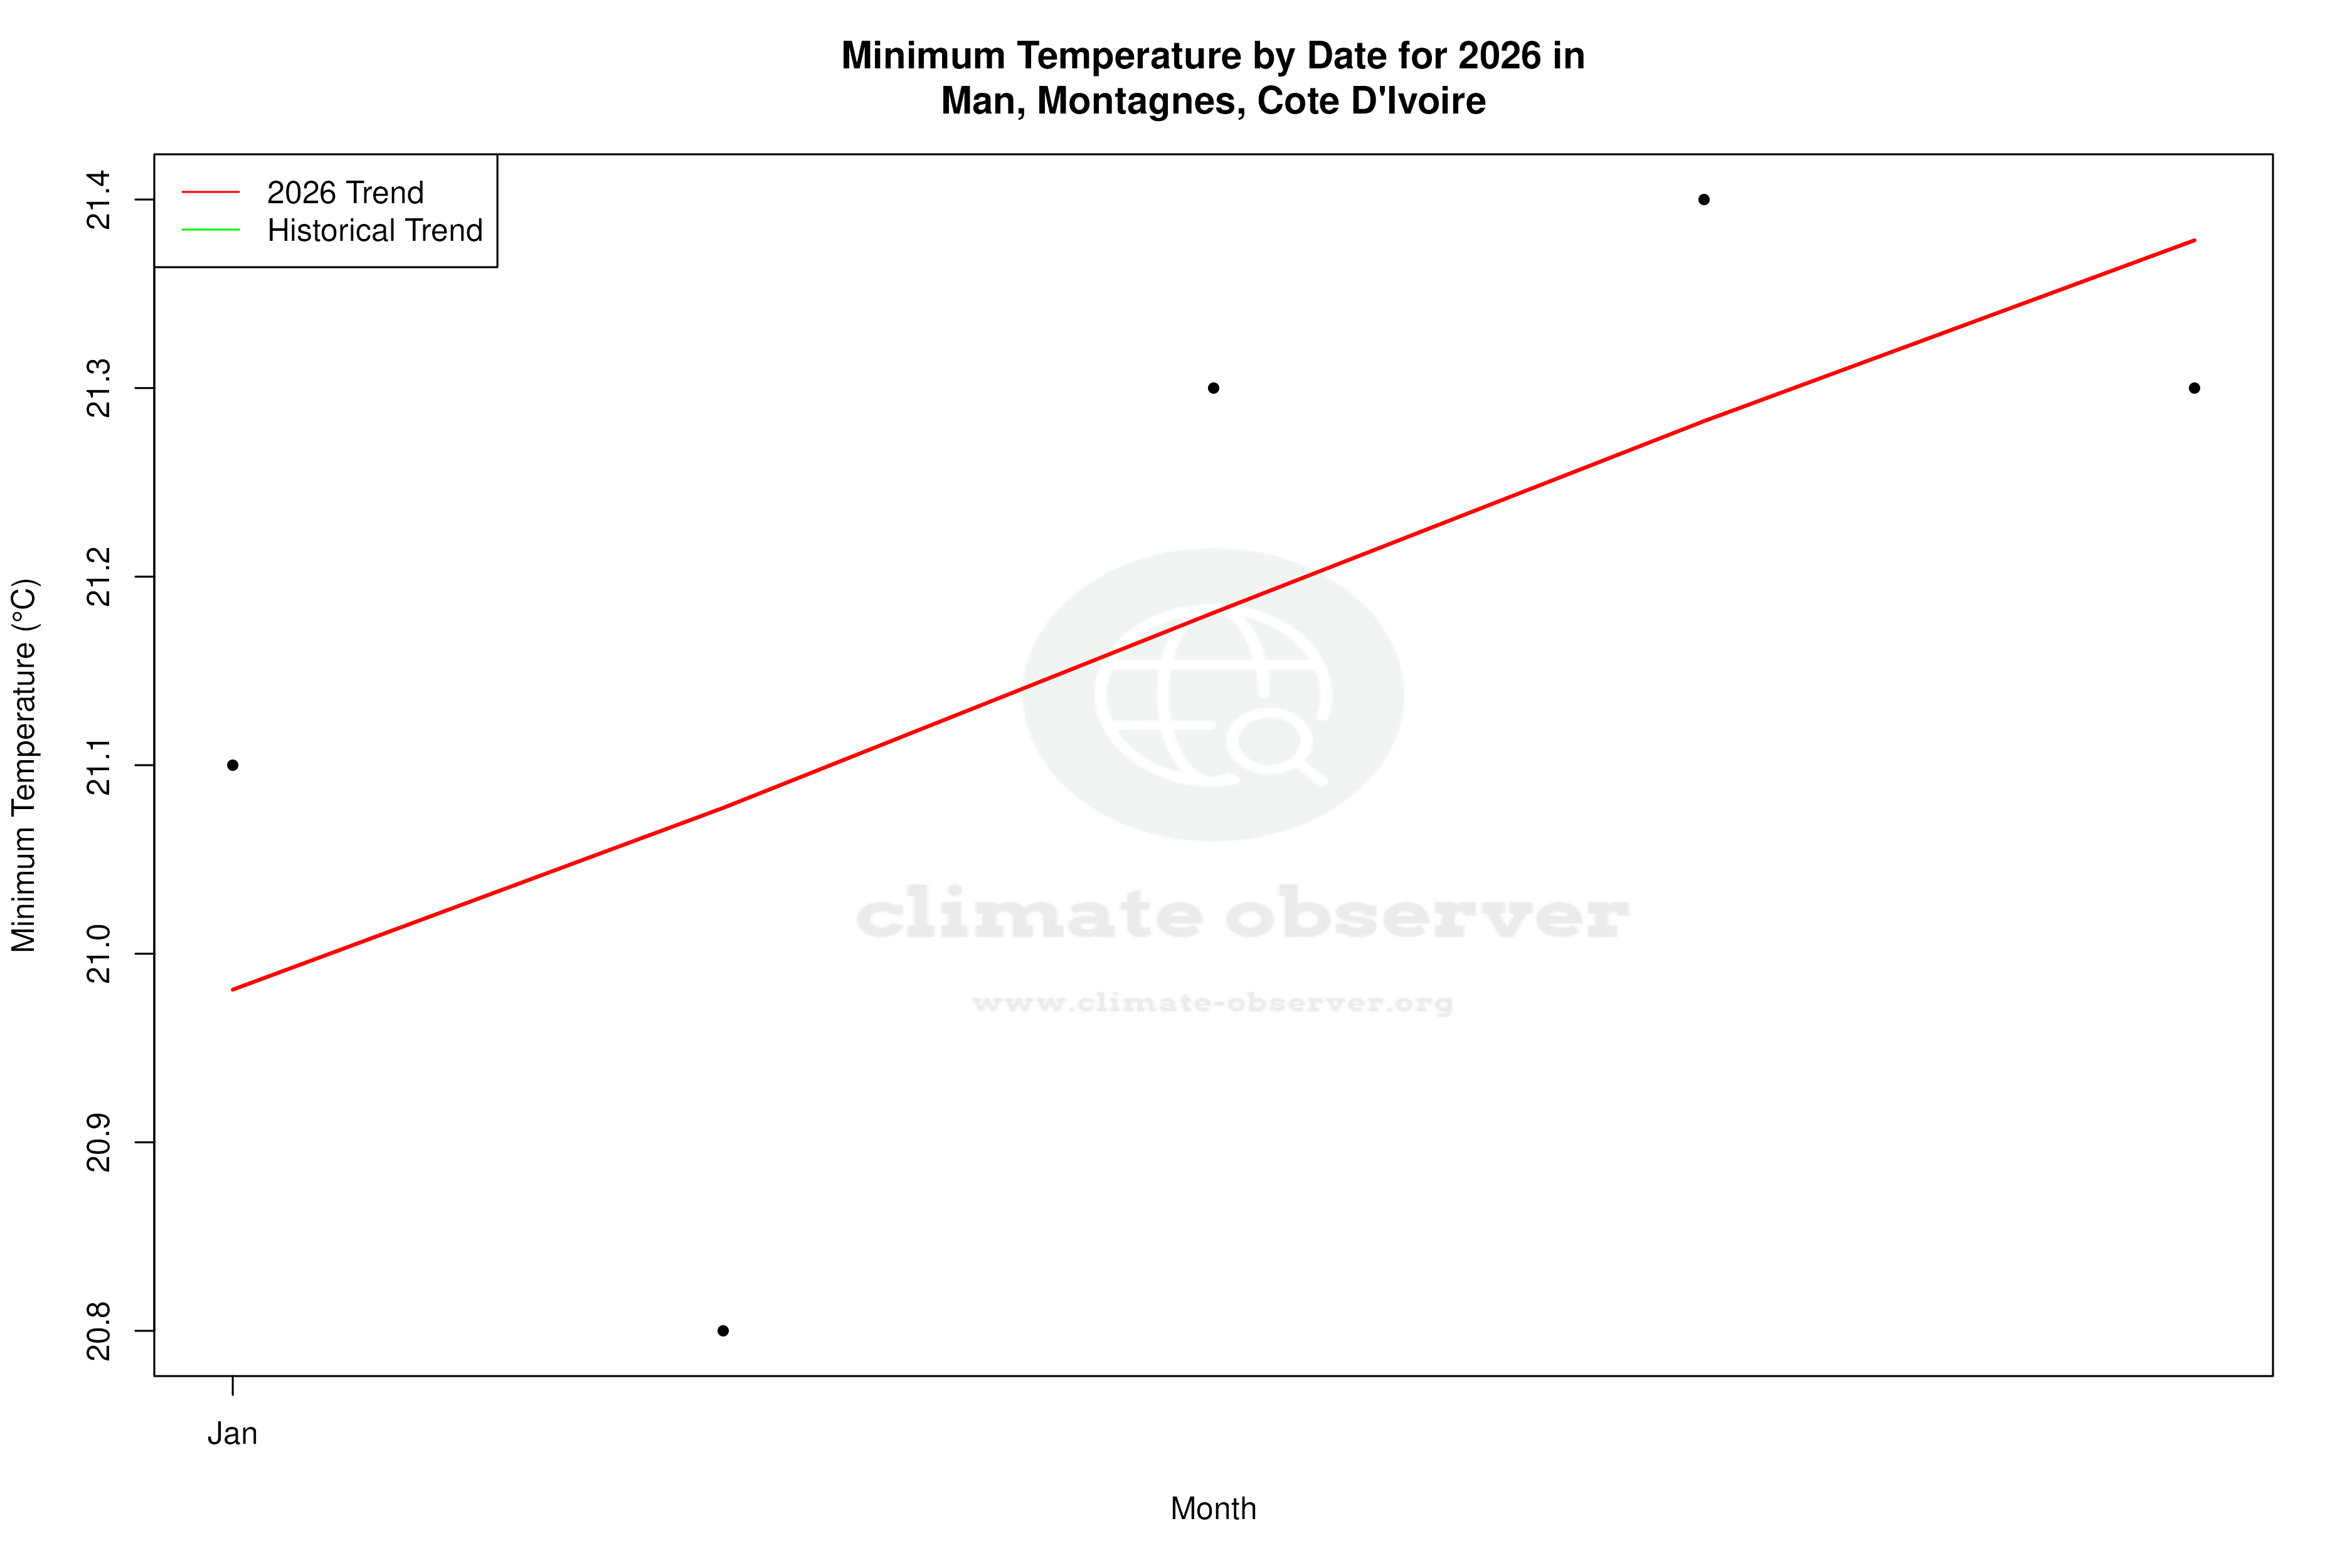


Max Temperature this Year | 1 of 6
Climate 12-Month Moving Averages


Max Temperature 12-Month MA | 1 of 6
Daily Data Points and Averages Throughout the Year


Average Max Temperature Throughout Year | 1 of 5
