Climate for Station: Abidjan Felix Houphouet Boign, Abidjan, Cote D'Ivoire
Loading live weather...
Climate Analysis & Overview
Abidjan's climate is experiencing a warming trend, with both high and low temperatures rising over the past decade and longer-term records. The precipitation pattern is showing a more even distribution, indicating a shift towards less concentrated rainfall events.
Tropical Climate Dynamics
Abidjan, located at 5.261°N, -3.926°W, experiences a tropical monsoon climate (Köppen classification Am), characterised by high humidity and significant rainfall. Its position along the coast of the Gulf of Guinea influences its weather patterns, with the Atlantic Ocean moderating temperatures and contributing to high precipitation levels. The all-time temperature trends reveal a warming pattern, with highs increasing by 0.12°C (0.22°F) and lows by 0.26°C (0.46°F). This warming is consistent with broader regional trends observed in West Africa, where climate change impacts are becoming increasingly evident.
Temperature Trends: A Warming Reality
Over the past decade, Abidjan has seen a notable increase in temperature. Highs have risen by 0.10°C (0.17°F), while lows have increased by 0.20°C (0.36°F). These figures, though slightly lower than the all-time trends, still indicate a persistent warming trend. The record temperatures for Abidjan stand at a maximum of 40.0°C (104.0°F) and a minimum of 16.0°C (60.8°F), showcasing the range of thermal conditions experienced in this coastal city. The consistent rise in both high and low temperatures suggests a shift towards warmer conditions, which could have implications for local agriculture and water resources.
Precipitation Patterns: More Even Distribution
The Precipitation Concentration Index (PCI) for Abidjan has decreased from a baseline of 13.12 to a current value of 11.68. This decrease indicates a more even distribution of rainfall throughout the year, as opposed to being concentrated in a few intense events. A PCI under 10 signifies very even rainfall, so while Abidjan's current value is slightly above this threshold, the trend towards more evenly spread precipitation is clear. This could mitigate some flood risks associated with heavy rainfall events, aligning with Côte d'Ivoire's climate adaptation goals to manage water resources effectively.
Regional Implications and Climate Goals
The warming trends and changes in precipitation patterns in Abidjan reflect larger regional climate dynamics. Côte d'Ivoire has been proactive in addressing climate change, aiming to enhance resilience in sectors like agriculture and water management. The observed climatic shifts could impact these efforts, necessitating adaptive strategies to cope with warmer temperatures and altered rainfall patterns. As the city continues to grow and develop, understanding these climate trends will be crucial for sustainable urban planning and infrastructure development.
Station Statistics
10-Year Trend
High: +0.02 °F/decade
Low: +0.27 °F/decade
Rain: -0.037 in/decade
25-Year Trend
High: -0.65 °F/decade
Low: +0.84 °F/decade
Rain: +0.014 in/decade
50-Year Trend
High: +0.24 °F/decade
Low: +0.46 °F/decade
Rain: +0.001 in/decade
All-Time Trend
High: +0.24 °F/decade
Low: +0.46 °F/decade
Rain: +0.001 in/decade
Percentage Above-Average Days
Last 12 Months: 45.5%
This Year: 42.8%
Precipitation Concentration Index (PCI) ℹ️
Last 12 Months: 13.0
Historical Average: 14.2
Percentile Rank of Last 12 Months ℹ️
High: 34th percentile
Low: 91st percentile
Rain: 39th percentile
Change in Variance ℹ️
High: -25.0%
Low: -13.7%
Intraday: -21.9%
Data Coverage
96.2%
First Year of Data
1973
Station Location
Historical Weather Records
| Max High | Avg High | Min High | Max Avg | Avg Avg | Min Avg | Max Low | Avg Low | Min Low | Max Precipitation | Avg Precipitation | Max Snow | Avg Snow | |
|---|---|---|---|---|---|---|---|---|---|---|---|---|---|
| Record | 104.00 °F | — | 71.60 °F | 88.34 °F | — | 70.34 °F | 85.46 °F | — | 60.80 °F | 15.98 in | — | — | — |
| January | 98.60 °F | 88.74 °F | 80.60 °F | 86.00 °F | 81.03 °F | 71.42 °F | 82.40 °F | 75.56 °F | 63.10 °F | 1.97 in | 0.04 in | — | — |
| February | 100.40 °F | 89.32 °F | 78.80 °F | 88.34 °F | 82.39 °F | 73.58 °F | 84.20 °F | 77.37 °F | 65.48 °F | 3.19 in | 0.09 in | — | — |
| March | 104.00 °F | 89.04 °F | 79.70 °F | 88.34 °F | 82.73 °F | 75.20 °F | 84.20 °F | 77.56 °F | 64.40 °F | 3.15 in | 0.16 in | — | — |
| April | 100.40 °F | 88.93 °F | 79.70 °F | 88.34 °F | 82.94 °F | 75.38 °F | 85.46 °F | 77.53 °F | 66.20 °F | 5.59 in | 0.22 in | — | — |
| May | 98.96 °F | 87.45 °F | 77.00 °F | 87.26 °F | 81.97 °F | 73.76 °F | 83.30 °F | 76.92 °F | 68.00 °F | 12.20 in | 0.33 in | — | — |
| June | 100.40 °F | 84.33 °F | 75.20 °F | 84.74 °F | 79.52 °F | 74.12 °F | 81.68 °F | 75.45 °F | 68.00 °F | 15.98 in | 0.53 in | — | — |
| July | 89.60 °F | 82.35 °F | 73.40 °F | 81.68 °F | 77.45 °F | 70.34 °F | 78.80 °F | 73.85 °F | 67.10 °F | 6.00 in | 0.17 in | — | — |
| August | 89.94 °F | 81.44 °F | 71.60 °F | 80.06 °F | 76.17 °F | 70.52 °F | 77.90 °F | 72.53 °F | 66.20 °F | 10.12 in | 0.07 in | — | — |
| September | 91.40 °F | 82.76 °F | 75.20 °F | 81.68 °F | 77.16 °F | 70.34 °F | 78.80 °F | 73.43 °F | 66.20 °F | 15.35 in | 0.15 in | — | — |
| October | 93.56 °F | 85.28 °F | 77.00 °F | 83.66 °F | 79.56 °F | 72.68 °F | 80.24 °F | 75.25 °F | 68.90 °F | 6.22 in | 0.23 in | — | — |
| November | 101.48 °F | 87.67 °F | 78.80 °F | 85.46 °F | 81.56 °F | 75.20 °F | 82.40 °F | 76.21 °F | 65.66 °F | 5.16 in | 0.19 in | — | — |
| December | 100.04 °F | 88.22 °F | 79.16 °F | 87.26 °F | 81.49 °F | 72.68 °F | 82.40 °F | 75.93 °F | 60.80 °F | 3.70 in | 0.10 in | — | — |
Data Visualisations
Remove WatermarksCurrent Year Climate Trends vs Historical


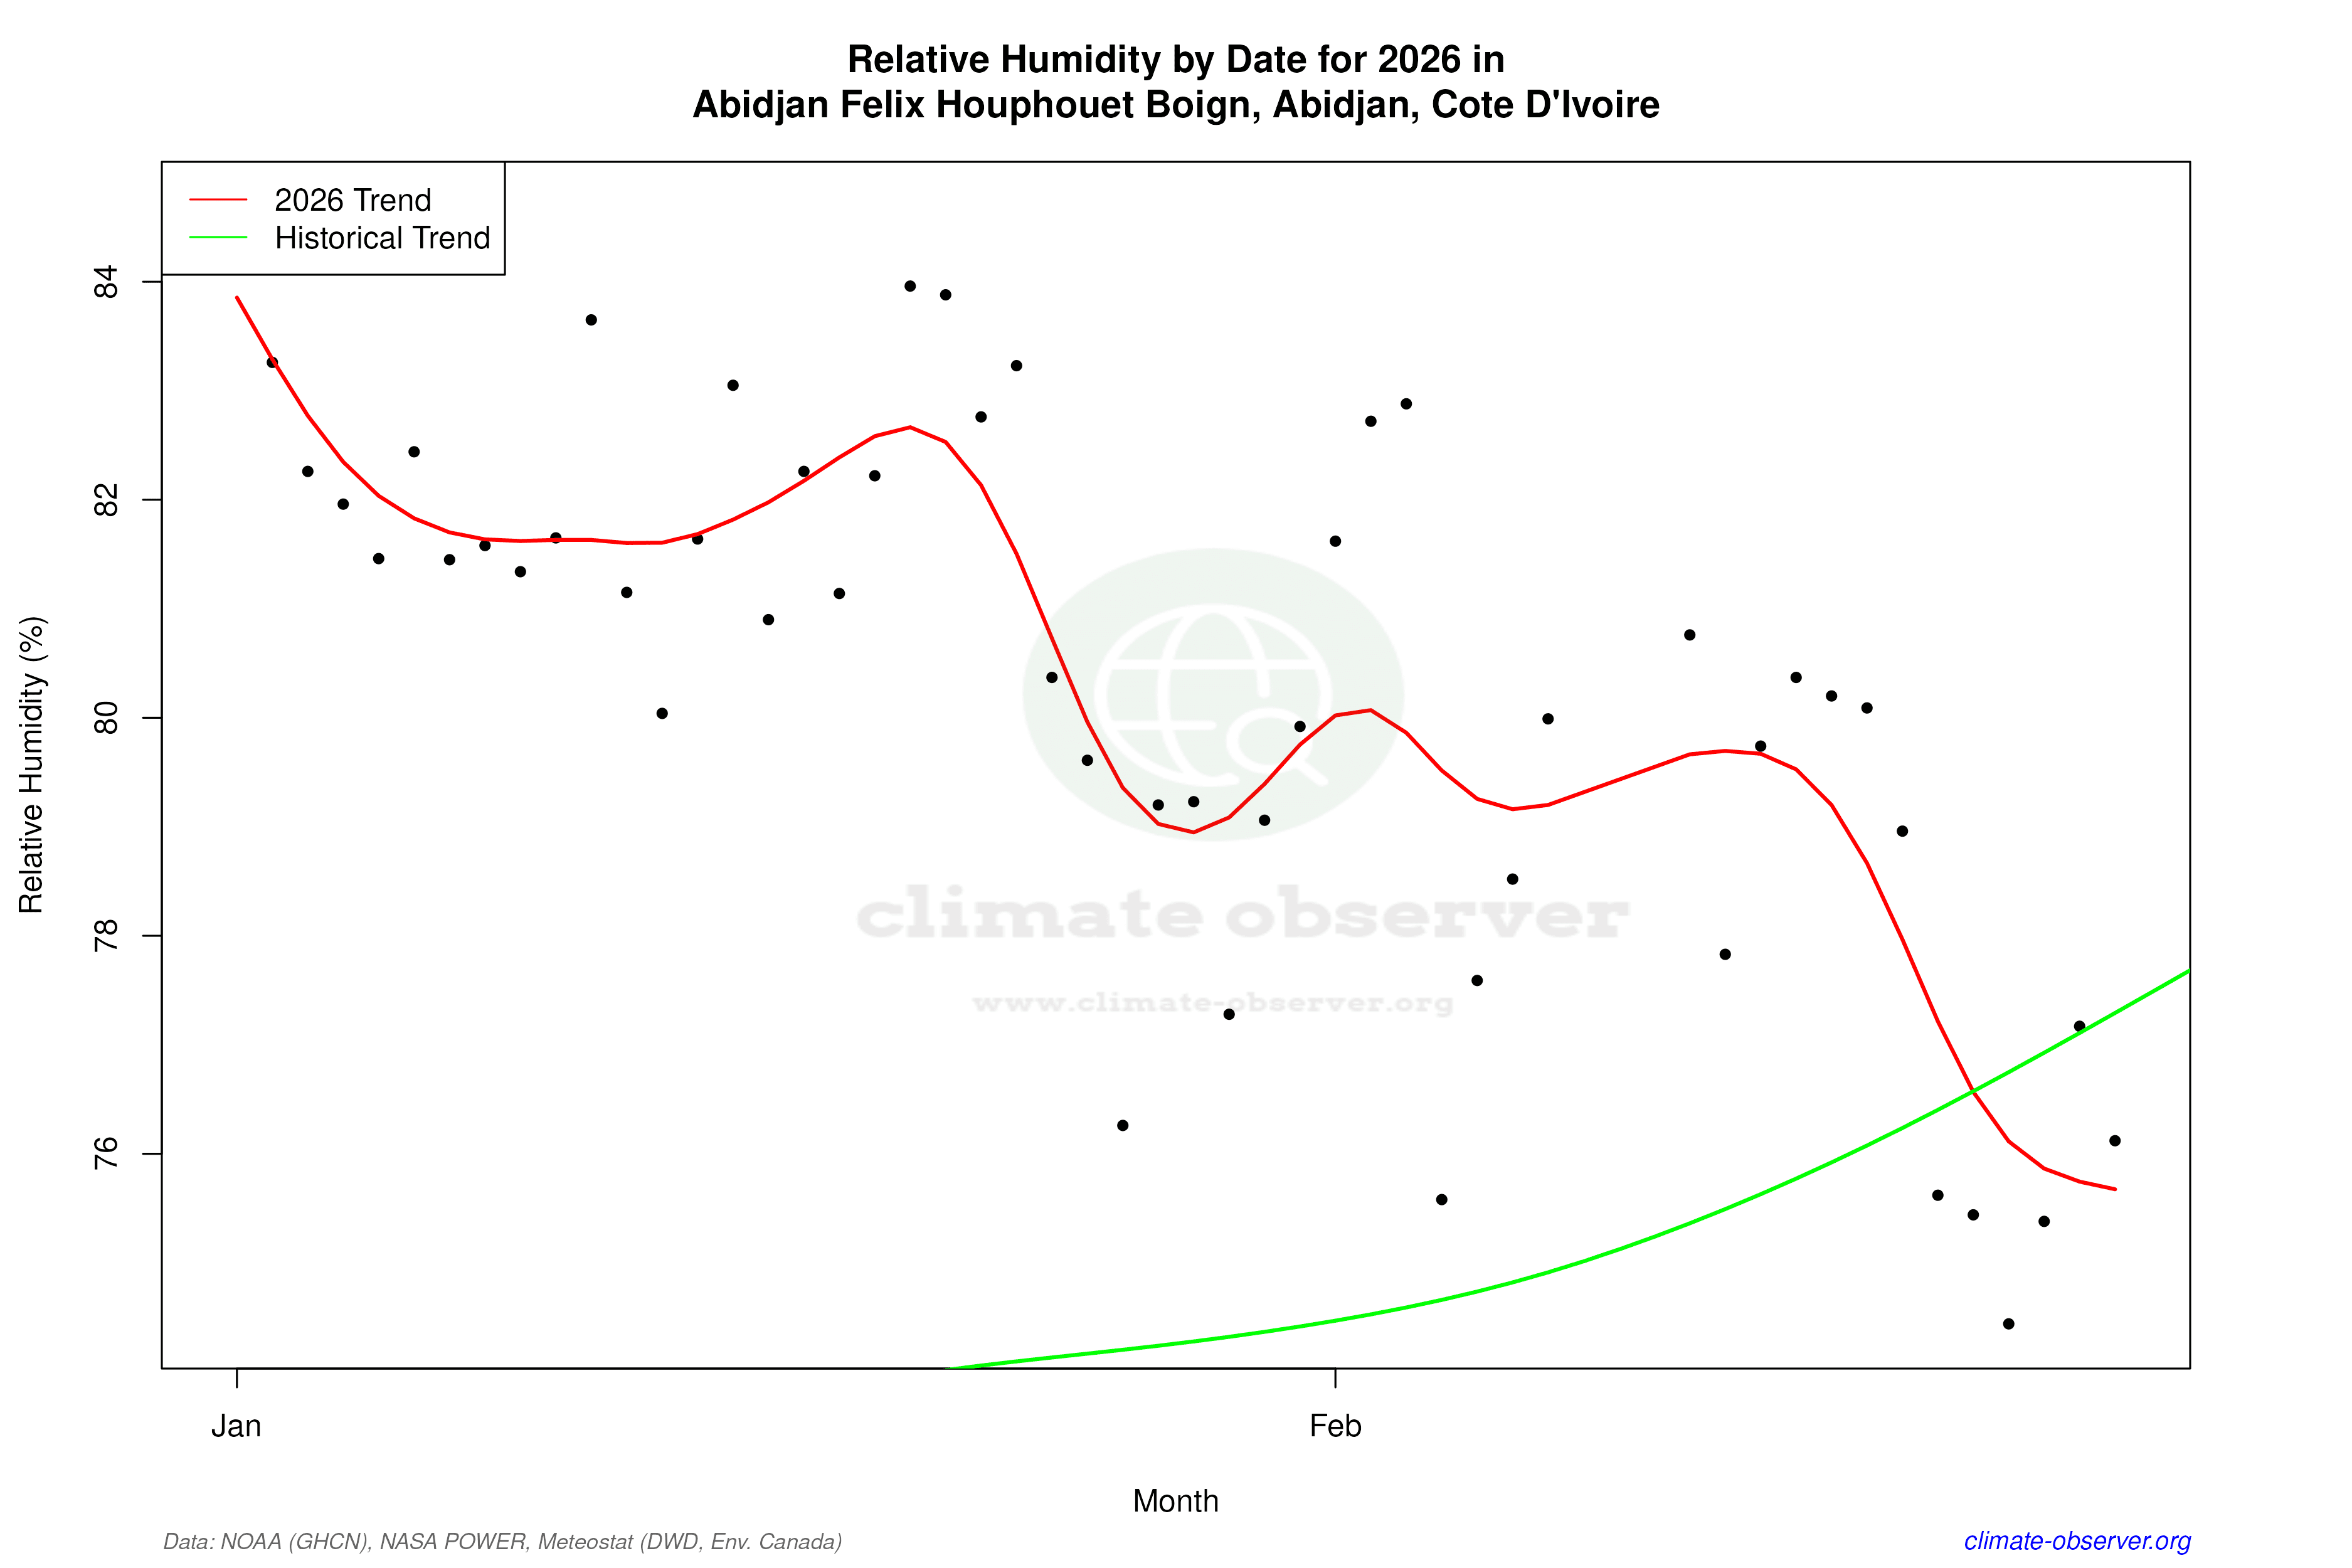

Max Temperature this Year | 1 of 6
Climate 12-Month Moving Averages


Max Temperature 12-Month MA | 1 of 6
Daily Data Points and Averages Throughout the Year


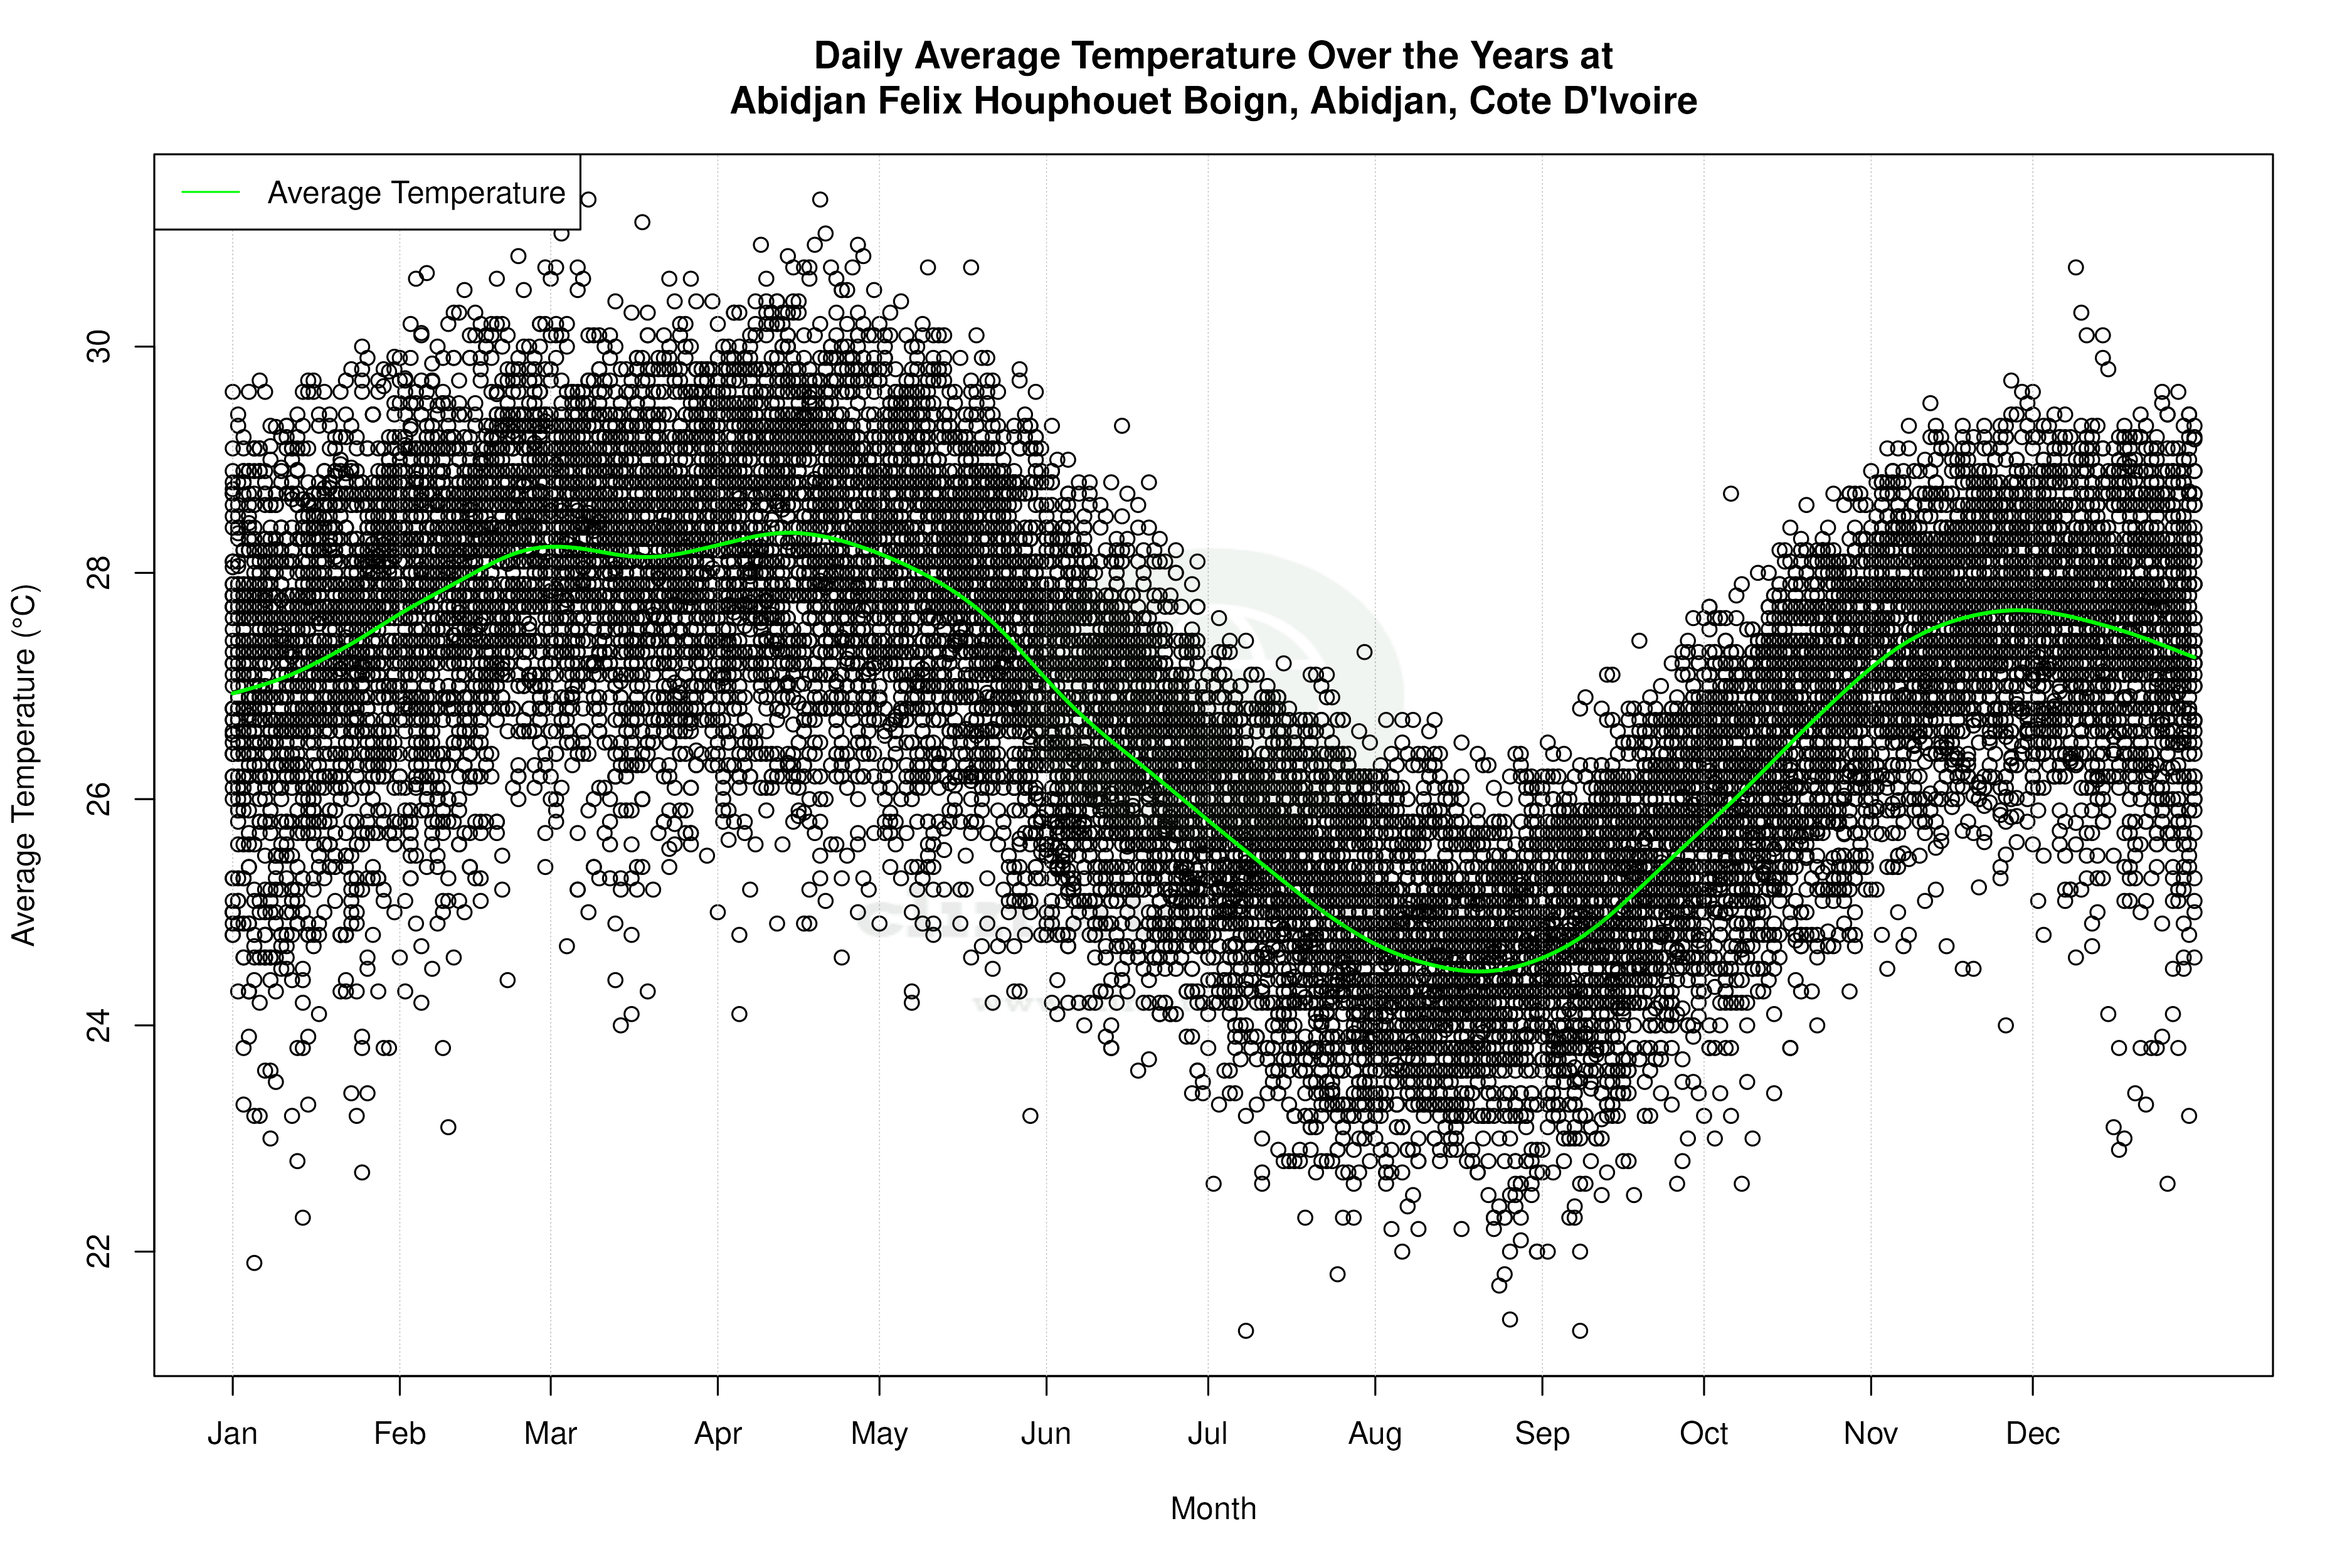


Average Max Temperature Throughout Year | 1 of 5
