Climate for Station: Wakkanai, Hokkaido, Japan
Loading live weather...
Climate Analysis & Overview
Wakkanai, Japan, experiences a warming trend, with notable increases in both high and low temperatures over the past decade, despite more modest long-term changes. Precipitation patterns have become slightly more even, indicating a shift towards a more consistent distribution of rainfall events.
Warming Trends in Northern Hokkaido
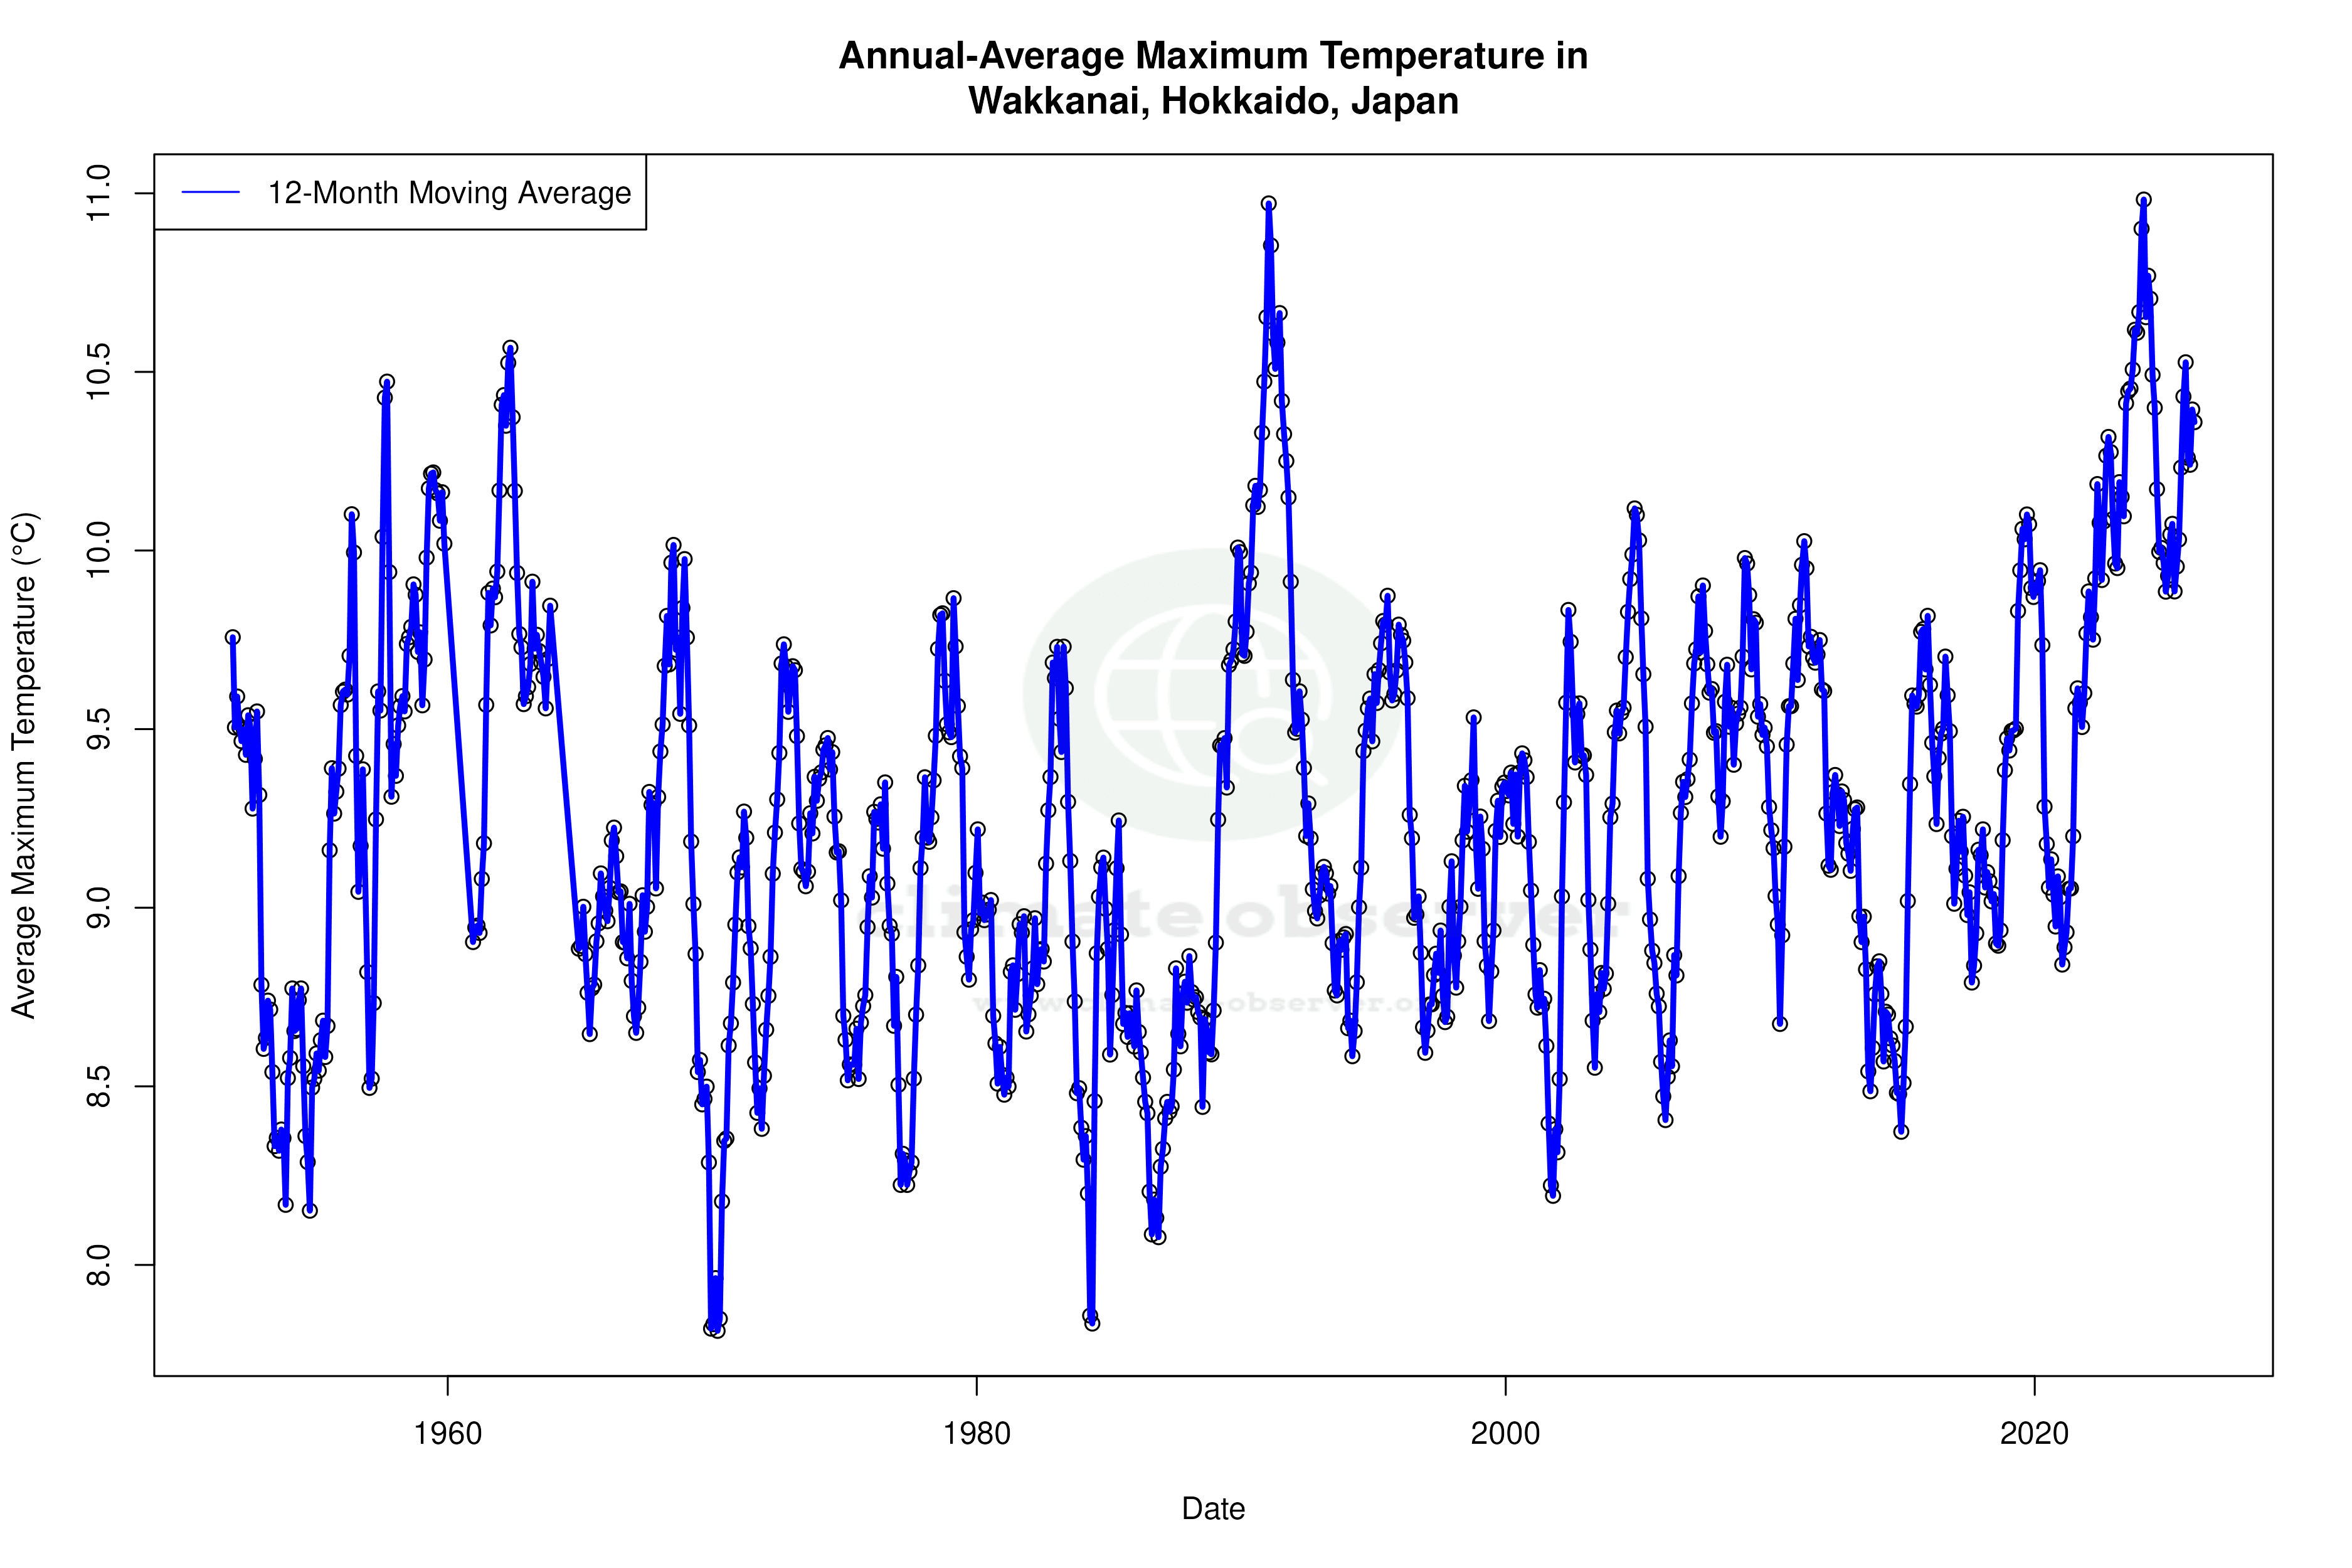
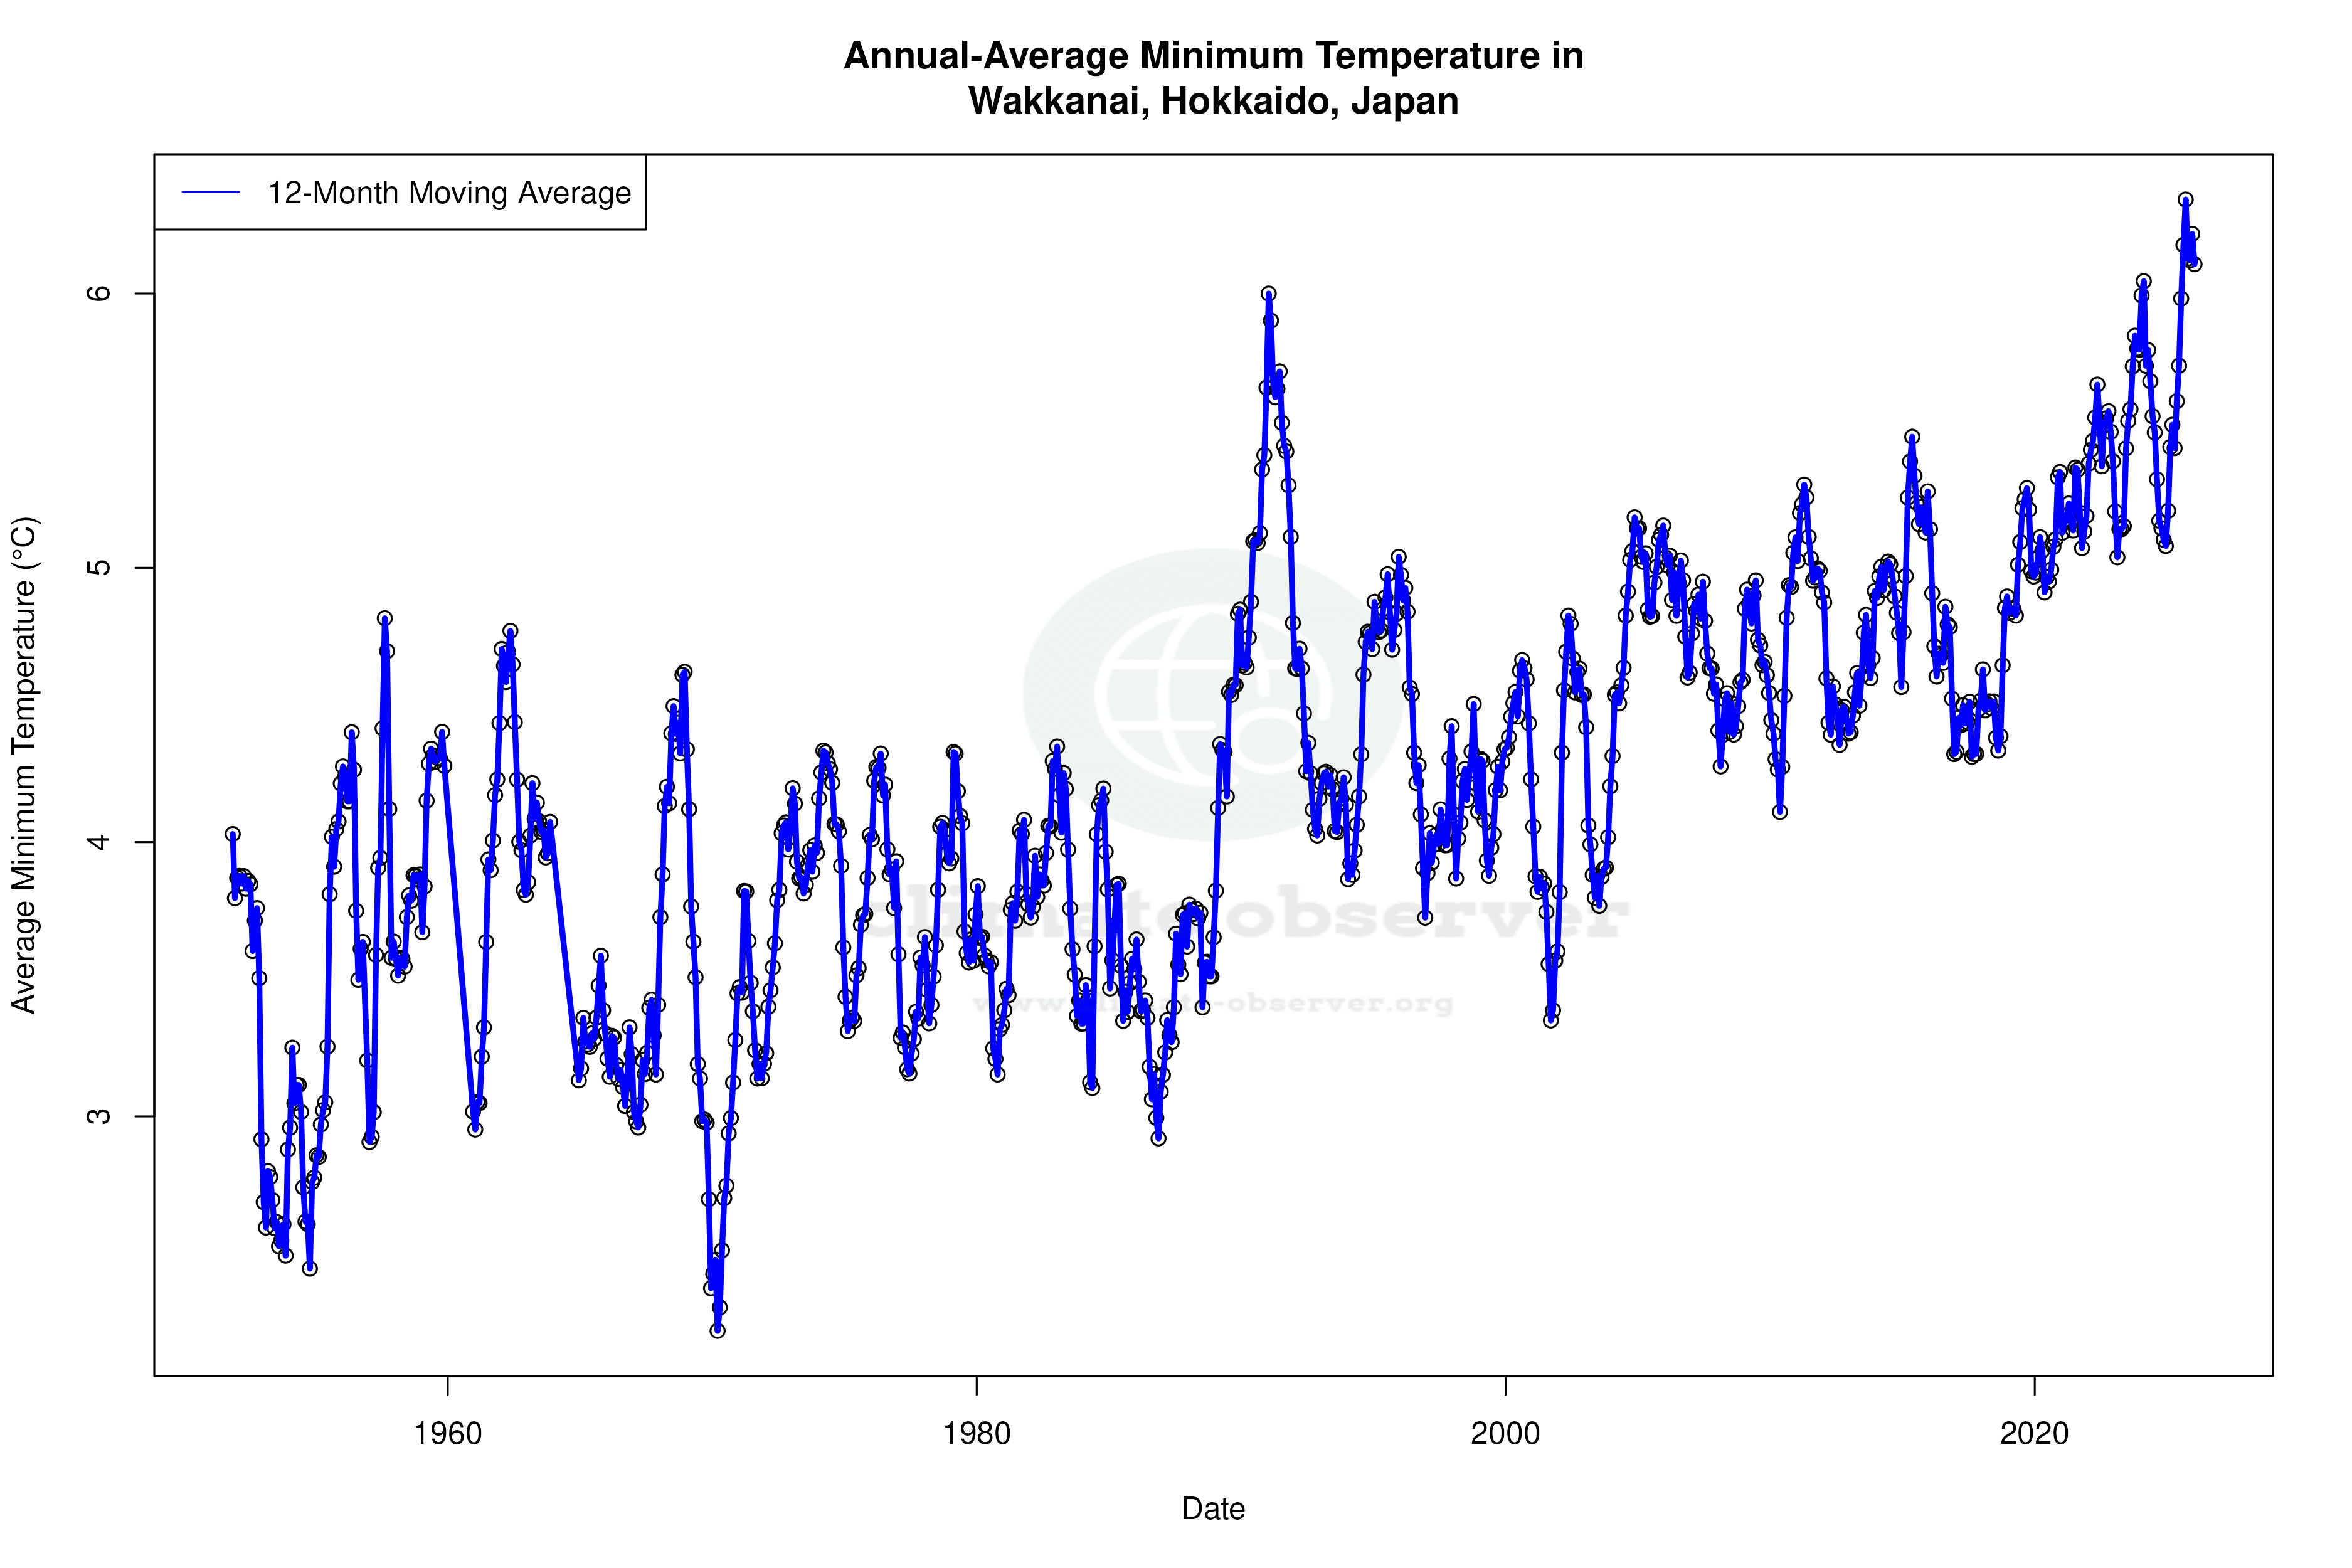
Wakkanai, located at the northern tip of Hokkaido, Japan, is characterised by a humid continental climate, influenced by its coastal position along the Sea of Japan. Over the past decade, the region has experienced a noticeable warming trend, with average high temperatures rising by 1.70°C (3.06°F) and lows by 1.72°C (3.09°F). This short-term warming is significant compared to the all-time trends, which show a more modest increase of 0.07°C (0.13°F) for highs and 0.27°C (0.49°F) for lows. This discrepancy highlights a recent acceleration in temperature changes, possibly linked to broader regional climate patterns and global warming.
Temperature Extremes and Records
Wakkanai's temperature records reveal the extremes the region can experience, with an all-time high of 30.8°C (87.4°F) and a low of -19.1°C (-2.4°F). These records underscore the variability inherent in the area's climate, shaped by its latitude and maritime influences. The warming trends observed may lead to more frequent occurrences of such extremes, challenging local ecosystems and infrastructure.
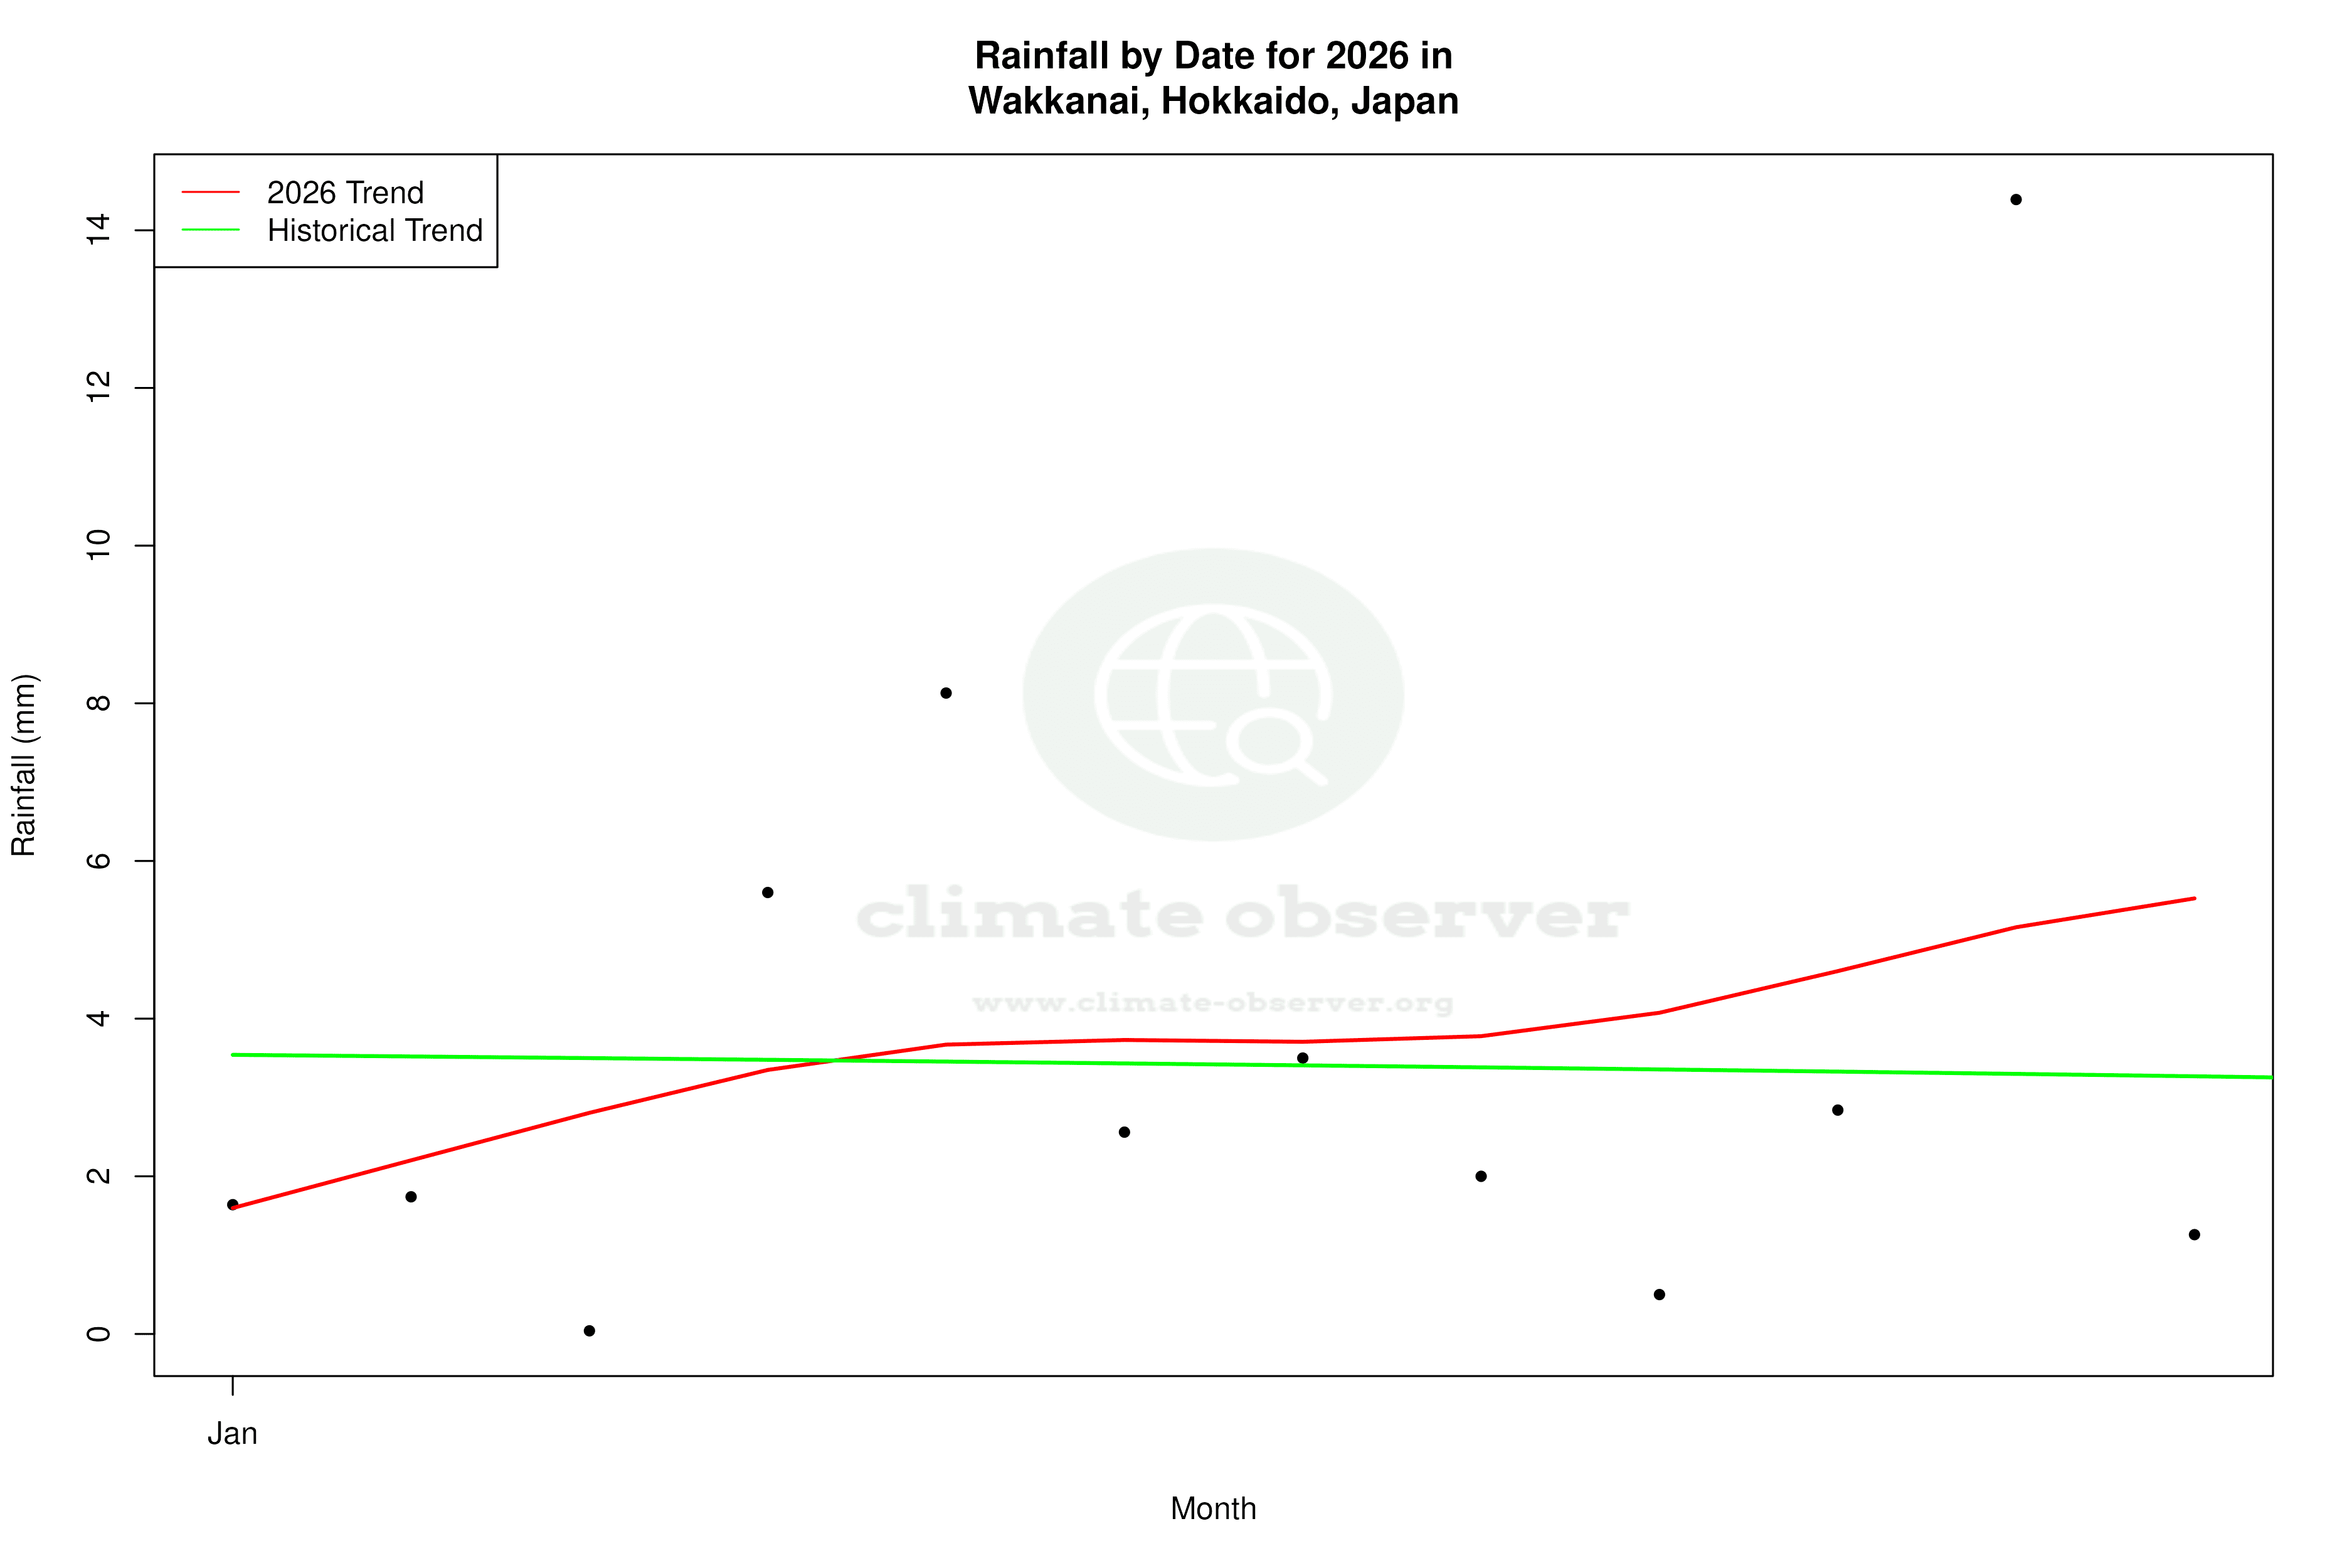
Precipitation Patterns: A Subtle Shift
The Precipitation Concentration Index (PCI) for Wakkanai has shown a slight decrease from a baseline of 11.04 to a current value of 10.74. This indicates a marginal shift towards more evenly distributed precipitation events. A lower PCI suggests that rainfall is less concentrated in intense storms and more spread out over time, which could benefit agriculture and reduce flood risks. However, the change is subtle, reflecting a stable yet evolving precipitation regime.
Implications for Regional Climate Goals
Japan's commitment to reducing greenhouse gas emissions and adapting to climate change aligns with the trends observed in Wakkanai. The warming trends and evolving precipitation patterns necessitate adaptive strategies to mitigate potential impacts on agriculture, fisheries, and local communities. As Wakkanai continues to experience these climatic shifts, monitoring and adaptation will be crucial in aligning with national and global climate objectives.
Geographical Influence on Climate
Wakkanai's geographical positioning plays a critical role in its climate profile. The proximity to the Sea of Japan moderates temperatures, contributing to the relatively mild extremes compared to inland areas. The surrounding oceanic currents and winds also influence precipitation patterns, reinforcing the need for integrated climate models that account for these localised factors. As climate change progresses, understanding these geographical influences will be key to predicting future climate scenarios for Wakkanai and similar regions.
Station Statistics
10-Year Trend
High: +2.83 °F/decade
Low: +3.04 °F/decade
Rain: +0.014 in/decade
25-Year Trend
High: +0.77 °F/decade
Low: +1.01 °F/decade
Rain: +0.002 in/decade
50-Year Trend
High: +0.34 °F/decade
Low: +0.67 °F/decade
Rain: +0.004 in/decade
All-Time Trend
High: +0.17 °F/decade
Low: +0.51 °F/decade
Rain: -0.001 in/decade
Percentage Above-Average Days
Last 12 Months: 50.7%
This Year: 44.7%
Precipitation Concentration Index (PCI) ℹ️
Last 12 Months: 10.9
Historical Average: 10.8
Percentile Rank of Last 12 Months ℹ️
High: 81st percentile
Low: 88th percentile
Rain: 81st percentile
Change in Variance ℹ️
High: +2.2%
Low: +1.4%
Intraday: -10.8%
Data Coverage
95.2%
First Year of Data
1951
Station Location
Historical Weather Records
| Max High | Avg High | Min High | Max Avg | Avg Avg | Min Avg | Max Low | Avg Low | Min Low | Max Precipitation | Avg Precipitation | Max Snow | Avg Snow | |
|---|---|---|---|---|---|---|---|---|---|---|---|---|---|
| Record | 87.44 °F | — | 6.26 °F | 80.78 °F | — | 2.66 °F | 75.56 °F | — | -2.38 °F | 6.12 in | — | — | — |
| January | 45.32 °F | 26.32 °F | 6.26 °F | 39.02 °F | 23.22 °F | 4.28 °F | 36.14 °F | 19.22 °F | -2.38 °F | 2.43 in | 0.12 in | — | — |
| February | 48.74 °F | 26.92 °F | 7.52 °F | 41.90 °F | 23.68 °F | 2.66 °F | 37.76 °F | 18.78 °F | -0.94 °F | 1.52 in | 0.09 in | — | — |
| March | 55.58 °F | 34.10 °F | 13.46 °F | 48.56 °F | 30.57 °F | 10.04 °F | 43.34 °F | 25.53 °F | 0.68 °F | 1.63 in | 0.08 in | — | — |
| April | 68.36 °F | 44.85 °F | 26.01 °F | 59.36 °F | 40.38 °F | 25.34 °F | 52.34 °F | 35.18 °F | 17.60 °F | 1.81 in | 0.08 in | — | — |
| May | 80.42 °F | 53.63 °F | 35.06 °F | 65.48 °F | 48.29 °F | 31.82 °F | 59.54 °F | 42.64 °F | 27.32 °F | 2.26 in | 0.09 in | — | — |
| June | 80.24 °F | 60.23 °F | 39.74 °F | 71.42 °F | 55.07 °F | 39.02 °F | 67.10 °F | 49.92 °F | 35.96 °F | 2.30 in | 0.09 in | — | — |
| July | 85.82 °F | 67.95 °F | 49.82 °F | 80.78 °F | 63.19 °F | 47.48 °F | 74.66 °F | 58.49 °F | 43.52 °F | 3.21 in | 0.13 in | — | — |
| August | 87.44 °F | 71.80 °F | 55.22 °F | 80.78 °F | 67.09 °F | 53.78 °F | 75.56 °F | 62.60 °F | 48.02 °F | 5.44 in | 0.15 in | — | — |
| September | 85.46 °F | 67.49 °F | 50.36 °F | 78.98 °F | 62.77 °F | 47.84 °F | 71.60 °F | 57.49 °F | 39.56 °F | 4.41 in | 0.18 in | — | — |
| October | 74.30 °F | 56.45 °F | 35.96 °F | 70.34 °F | 51.83 °F | 32.36 °F | 68.36 °F | 46.59 °F | 29.12 °F | 6.12 in | 0.16 in | — | — |
| November | 63.14 °F | 42.48 °F | 16.88 °F | 58.64 °F | 38.49 °F | 15.44 °F | 54.50 °F | 33.94 °F | 11.48 °F | 3.24 in | 0.17 in | — | — |
| December | 53.06 °F | 31.74 °F | 9.50 °F | 48.56 °F | 28.33 °F | 11.66 °F | 45.68 °F | 24.31 °F | 3.20 °F | 2.81 in | 0.15 in | — | — |
Data Visualisations
Remove WatermarksCurrent Year Climate Trends vs Historical


Max Temperature this Year | 1 of 6
Climate 12-Month Moving Averages


Max Temperature 12-Month MA | 1 of 6
Daily Data Points and Averages Throughout the Year


Average Max Temperature Throughout Year | 1 of 5
