Climate for Station: Suttsu, Hokkaido, Japan
Loading live weather...
Climate Analysis & Overview
Suttsu, located on the western coast of Hokkaido, Japan, is experiencing significant warming trends over the past decade, with both high and low temperatures increasing by over 1.30°C (2.34°F). This is set against a backdrop of more evenly distributed precipitation, as indicated by a decrease in the Precipitation Concentration Index. These changes highlight the ongoing climate shifts in this region, which may impact local ecosystems and communities.
Coastal Climate Dynamics of Suttsu
Suttsu, situated at 42.8°N, 140.217°E, is characterised by a humid continental climate (Köppen classification Dfb), marked by warm summers and cold, snowy winters. The town's proximity to the Sea of Japan influences its climate, often leading to heavy snowfall in winter due to the cold Siberian winds. Over the past decade, Suttsu has seen a notable warming trend, with high temperatures rising by 1.35°C (2.43°F) and low temperatures by 1.30°C (2.34°F). This trend is more pronounced than the all-time warming, where highs have increased by a modest 0.15°C (0.27°F), and lows by 0.28°C (0.50°F). This recent acceleration in temperature rise could have profound implications for local agriculture and natural habitats.
Temperature Extremes and Historical Records
Suttsu's temperature records reveal an absolute maximum of 33.5°C (92.3°F) and a minimum of -14.9°C (5.2°F). These extremes illustrate the significant seasonal variability characteristic of the region. While the all-time trends show a gradual warming, the recent decade's data suggests an intensified warming pattern, which could lead to more frequent heatwaves and milder winters. The implications of these shifts are critical for local infrastructure and energy demands, particularly in adapting to potential increases in summer cooling needs.
Precipitation Patterns: A Shift Towards Even Distribution
The Precipitation Concentration Index (PCI) for Suttsu has decreased from a baseline of 10.89 to a current value of 9.12, indicating a more even distribution of rainfall throughout the year. A PCI under 10 suggests that precipitation events are becoming more evenly spread, reducing the risk of extreme weather events such as flash floods. This shift could be beneficial for agriculture, as it may lead to more consistent water availability for crops, aligning with Japan's regional climate goals of enhancing food security.
Implications of Regional Warming
The warming trends observed in Suttsu are consistent with broader climate patterns across Japan, where rising temperatures are prompting shifts in agricultural practices and biodiversity. The increase in both high and low temperatures over the past decade is notable, as it suggests a narrowing of the temperature range, potentially affecting species that rely on seasonal cues. As Japan works towards its climate goals, understanding these localised changes is crucial for developing adaptive strategies that mitigate the impacts of climate change on both human and natural systems.
Station Statistics
10-Year Trend
High: +1.55 °F/decade
Low: +1.44 °F/decade
Rain: +0.070 in/decade
25-Year Trend
High: +0.26 °F/decade
Low: +0.26 °F/decade
Rain: +0.017 in/decade
50-Year Trend
High: +0.32 °F/decade
Low: +0.66 °F/decade
Rain: +0.009 in/decade
All-Time Trend
High: +0.24 °F/decade
Low: +0.46 °F/decade
Rain: +0.004 in/decade
Percentage Above-Average Days
Last 12 Months: 49.9%
This Year: 54.1%
Precipitation Concentration Index (PCI) ℹ️
Last 12 Months: 9.1
Historical Average: 10.6
Percentile Rank of Last 12 Months ℹ️
High: 86th percentile
Low: 90th percentile
Rain: 97th percentile
Change in Variance ℹ️
High: +7.6%
Low: +5.3%
Intraday: +2.1%
Data Coverage
95.7%
First Year of Data
1951
Station Location
Historical Weather Records
| Max High | Avg High | Min High | Max Avg | Avg Avg | Min Avg | Max Low | Avg Low | Min Low | Max Precipitation | Avg Precipitation | Max Snow | Avg Snow | |
|---|---|---|---|---|---|---|---|---|---|---|---|---|---|
| Record | 92.30 °F | — | 11.66 °F | 83.12 °F | — | 11.30 °F | 78.08 °F | — | 5.18 °F | 8.12 in | — | — | — |
| January | 47.84 °F | 31.22 °F | 11.66 °F | 44.42 °F | 27.60 °F | 11.30 °F | 38.12 °F | 23.44 °F | 5.18 °F | 1.71 in | 0.15 in | — | — |
| February | 52.16 °F | 31.91 °F | 14.72 °F | 44.96 °F | 28.45 °F | 12.20 °F | 43.14 °F | 23.80 °F | 6.62 °F | 1.81 in | 0.12 in | — | — |
| March | 63.50 °F | 38.06 °F | 19.94 °F | 51.98 °F | 34.18 °F | 19.76 °F | 44.56 °F | 29.19 °F | 12.20 °F | 1.73 in | 0.09 in | — | — |
| April | 81.86 °F | 49.33 °F | 32.72 °F | 66.56 °F | 43.76 °F | 28.76 °F | 52.88 °F | 37.19 °F | 23.18 °F | 1.93 in | 0.09 in | — | — |
| May | 84.20 °F | 58.68 °F | 39.56 °F | 72.32 °F | 52.37 °F | 37.40 °F | 61.70 °F | 45.44 °F | 30.38 °F | 2.99 in | 0.09 in | — | — |
| June | 84.56 °F | 64.97 °F | 48.20 °F | 75.02 °F | 59.21 °F | 46.40 °F | 71.60 °F | 53.51 °F | 39.02 °F | 1.91 in | 0.09 in | — | — |
| July | 90.32 °F | 72.29 °F | 52.16 °F | 81.50 °F | 66.92 °F | 51.62 °F | 74.66 °F | 62.06 °F | 46.58 °F | 6.20 in | 0.12 in | — | — |
| August | 92.30 °F | 75.75 °F | 61.70 °F | 83.12 °F | 70.33 °F | 59.54 °F | 78.08 °F | 65.61 °F | 51.44 °F | 8.12 in | 0.18 in | — | — |
| September | 89.96 °F | 70.18 °F | 53.60 °F | 78.26 °F | 64.52 °F | 48.38 °F | 75.51 °F | 58.91 °F | 40.64 °F | 4.96 in | 0.19 in | — | — |
| October | 80.24 °F | 59.48 °F | 39.92 °F | 68.72 °F | 53.71 °F | 35.96 °F | 64.74 °F | 47.72 °F | 31.10 °F | 3.46 in | 0.18 in | — | — |
| November | 69.08 °F | 46.70 °F | 23.00 °F | 60.62 °F | 41.81 °F | 19.58 °F | 56.88 °F | 36.64 °F | 16.34 °F | 2.17 in | 0.19 in | — | — |
| December | 59.18 °F | 35.77 °F | 16.16 °F | 49.82 °F | 31.77 °F | 11.84 °F | 47.64 °F | 27.40 °F | 8.60 °F | 1.33 in | 0.17 in | — | — |
Data Visualisations
Remove WatermarksCurrent Year Climate Trends vs Historical


Max Temperature this Year | 1 of 6
Climate 12-Month Moving Averages


Max Temperature 12-Month MA | 1 of 6
Daily Data Points and Averages Throughout the Year

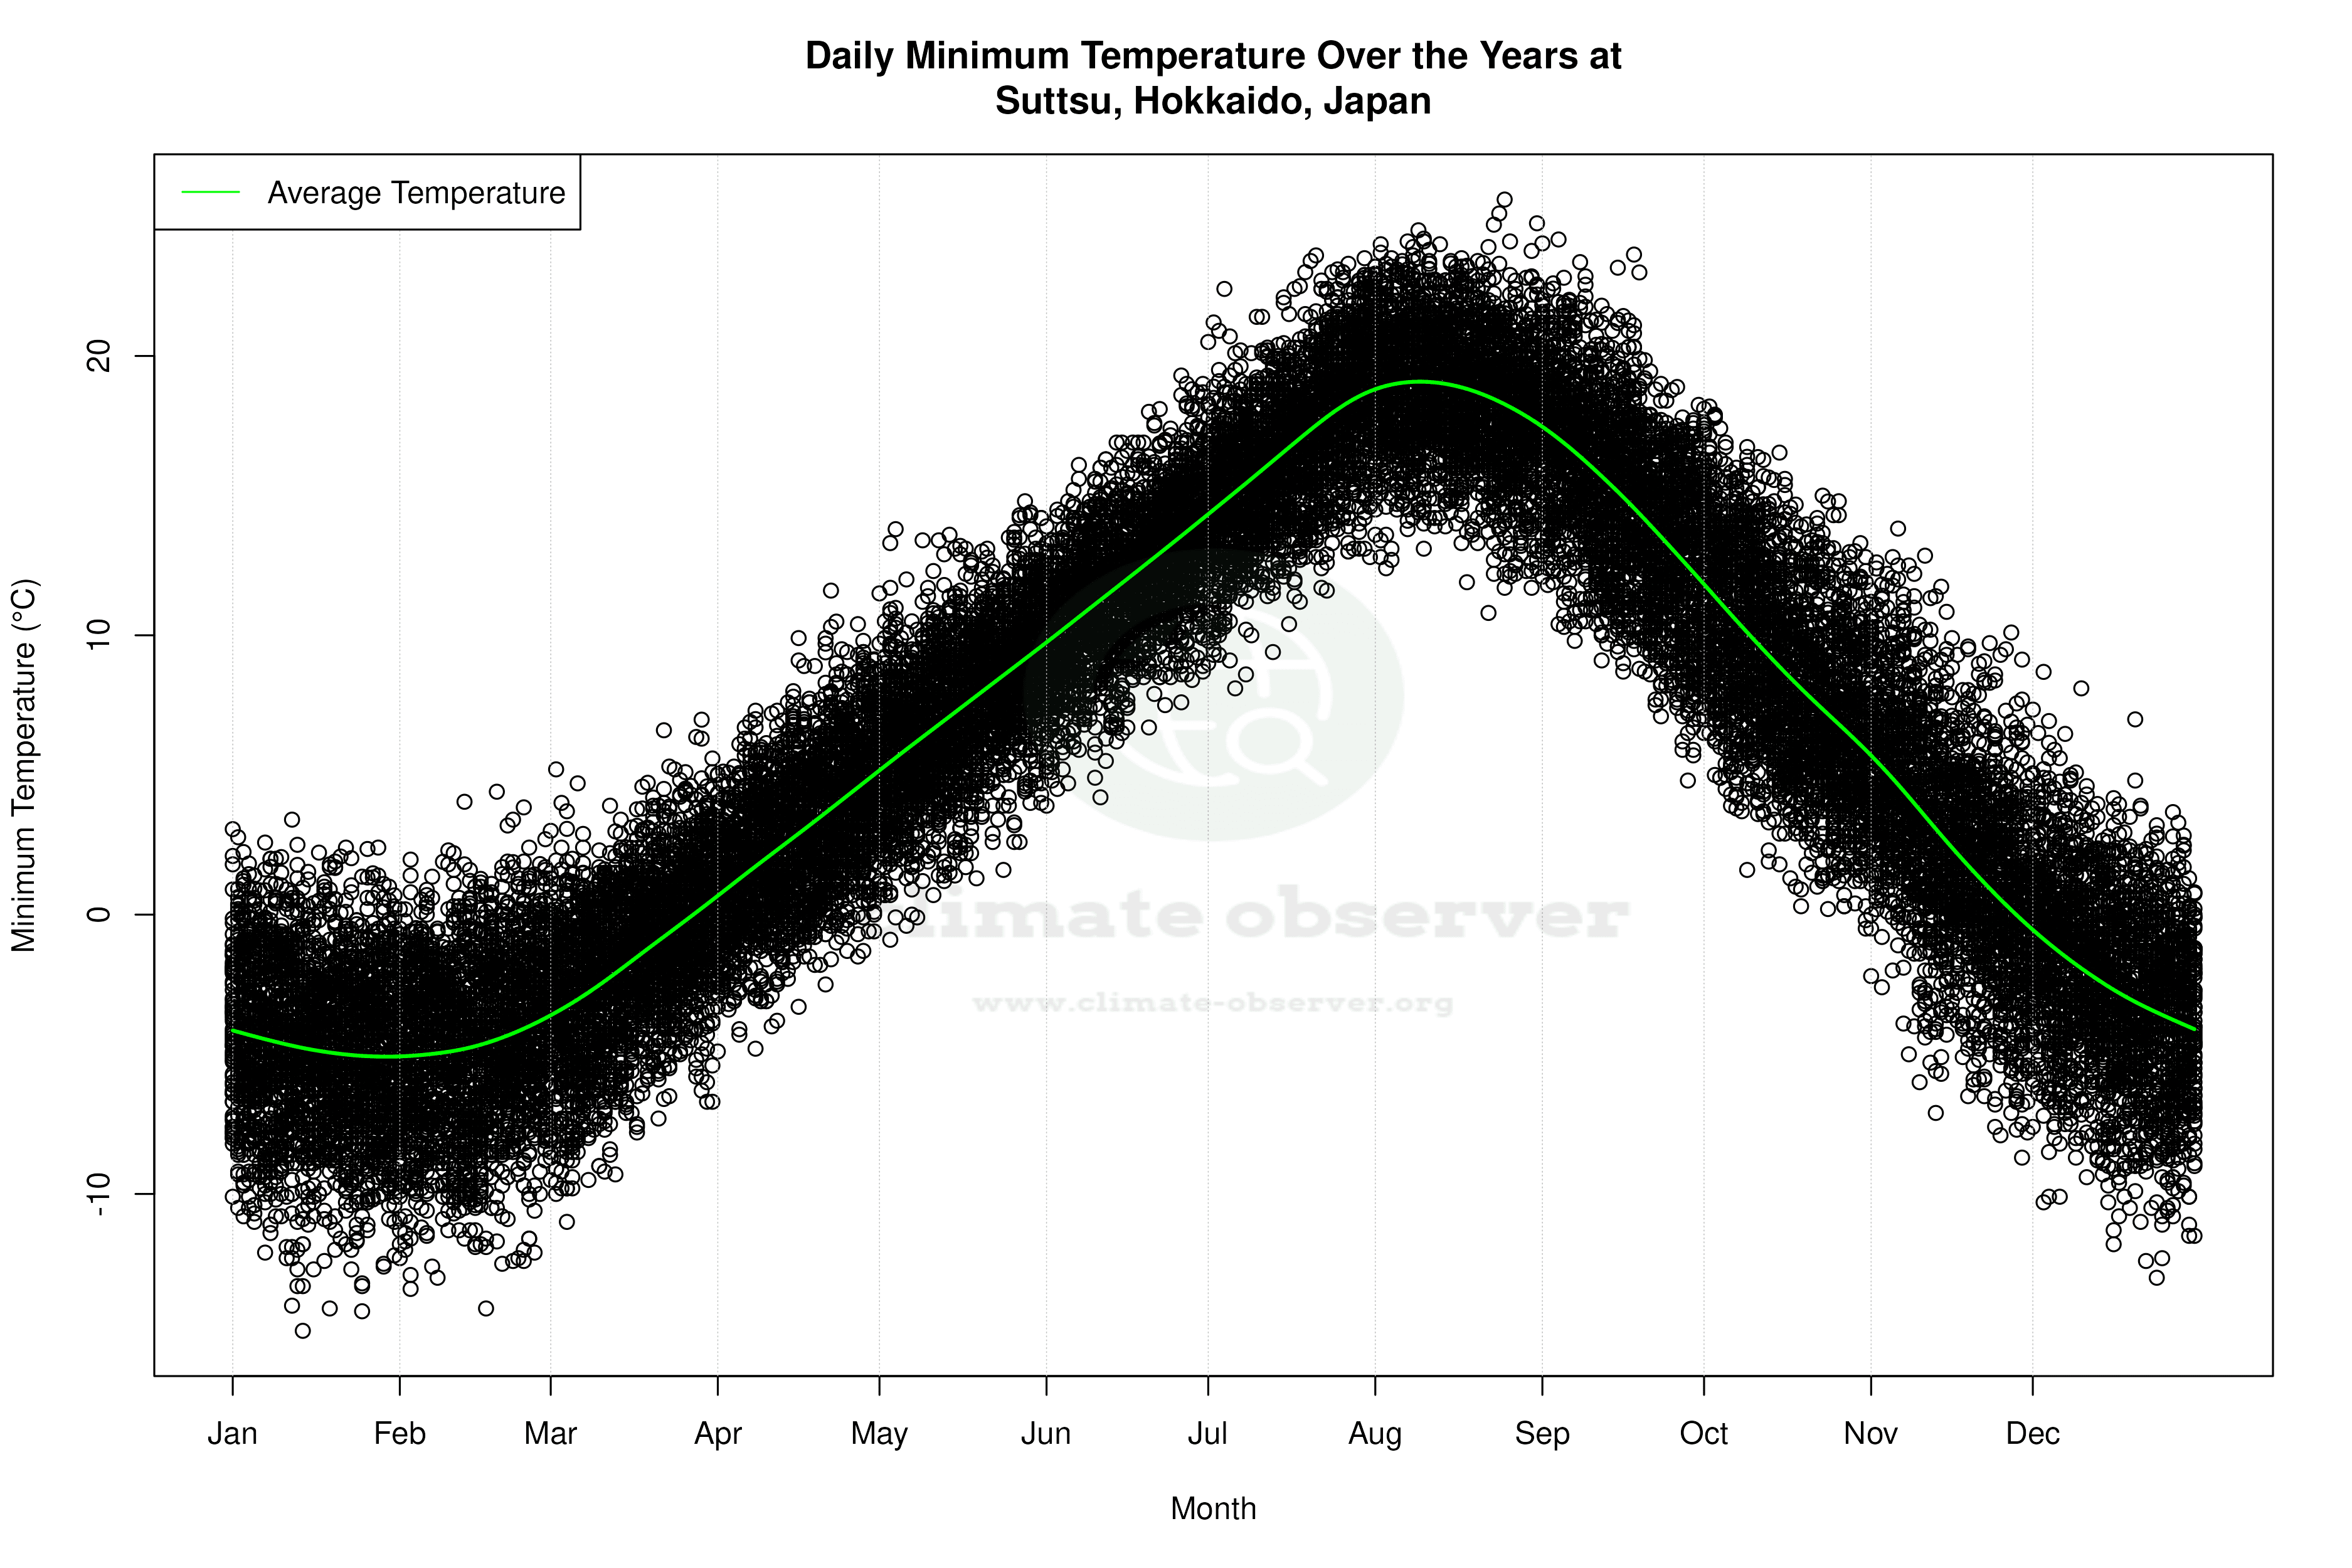

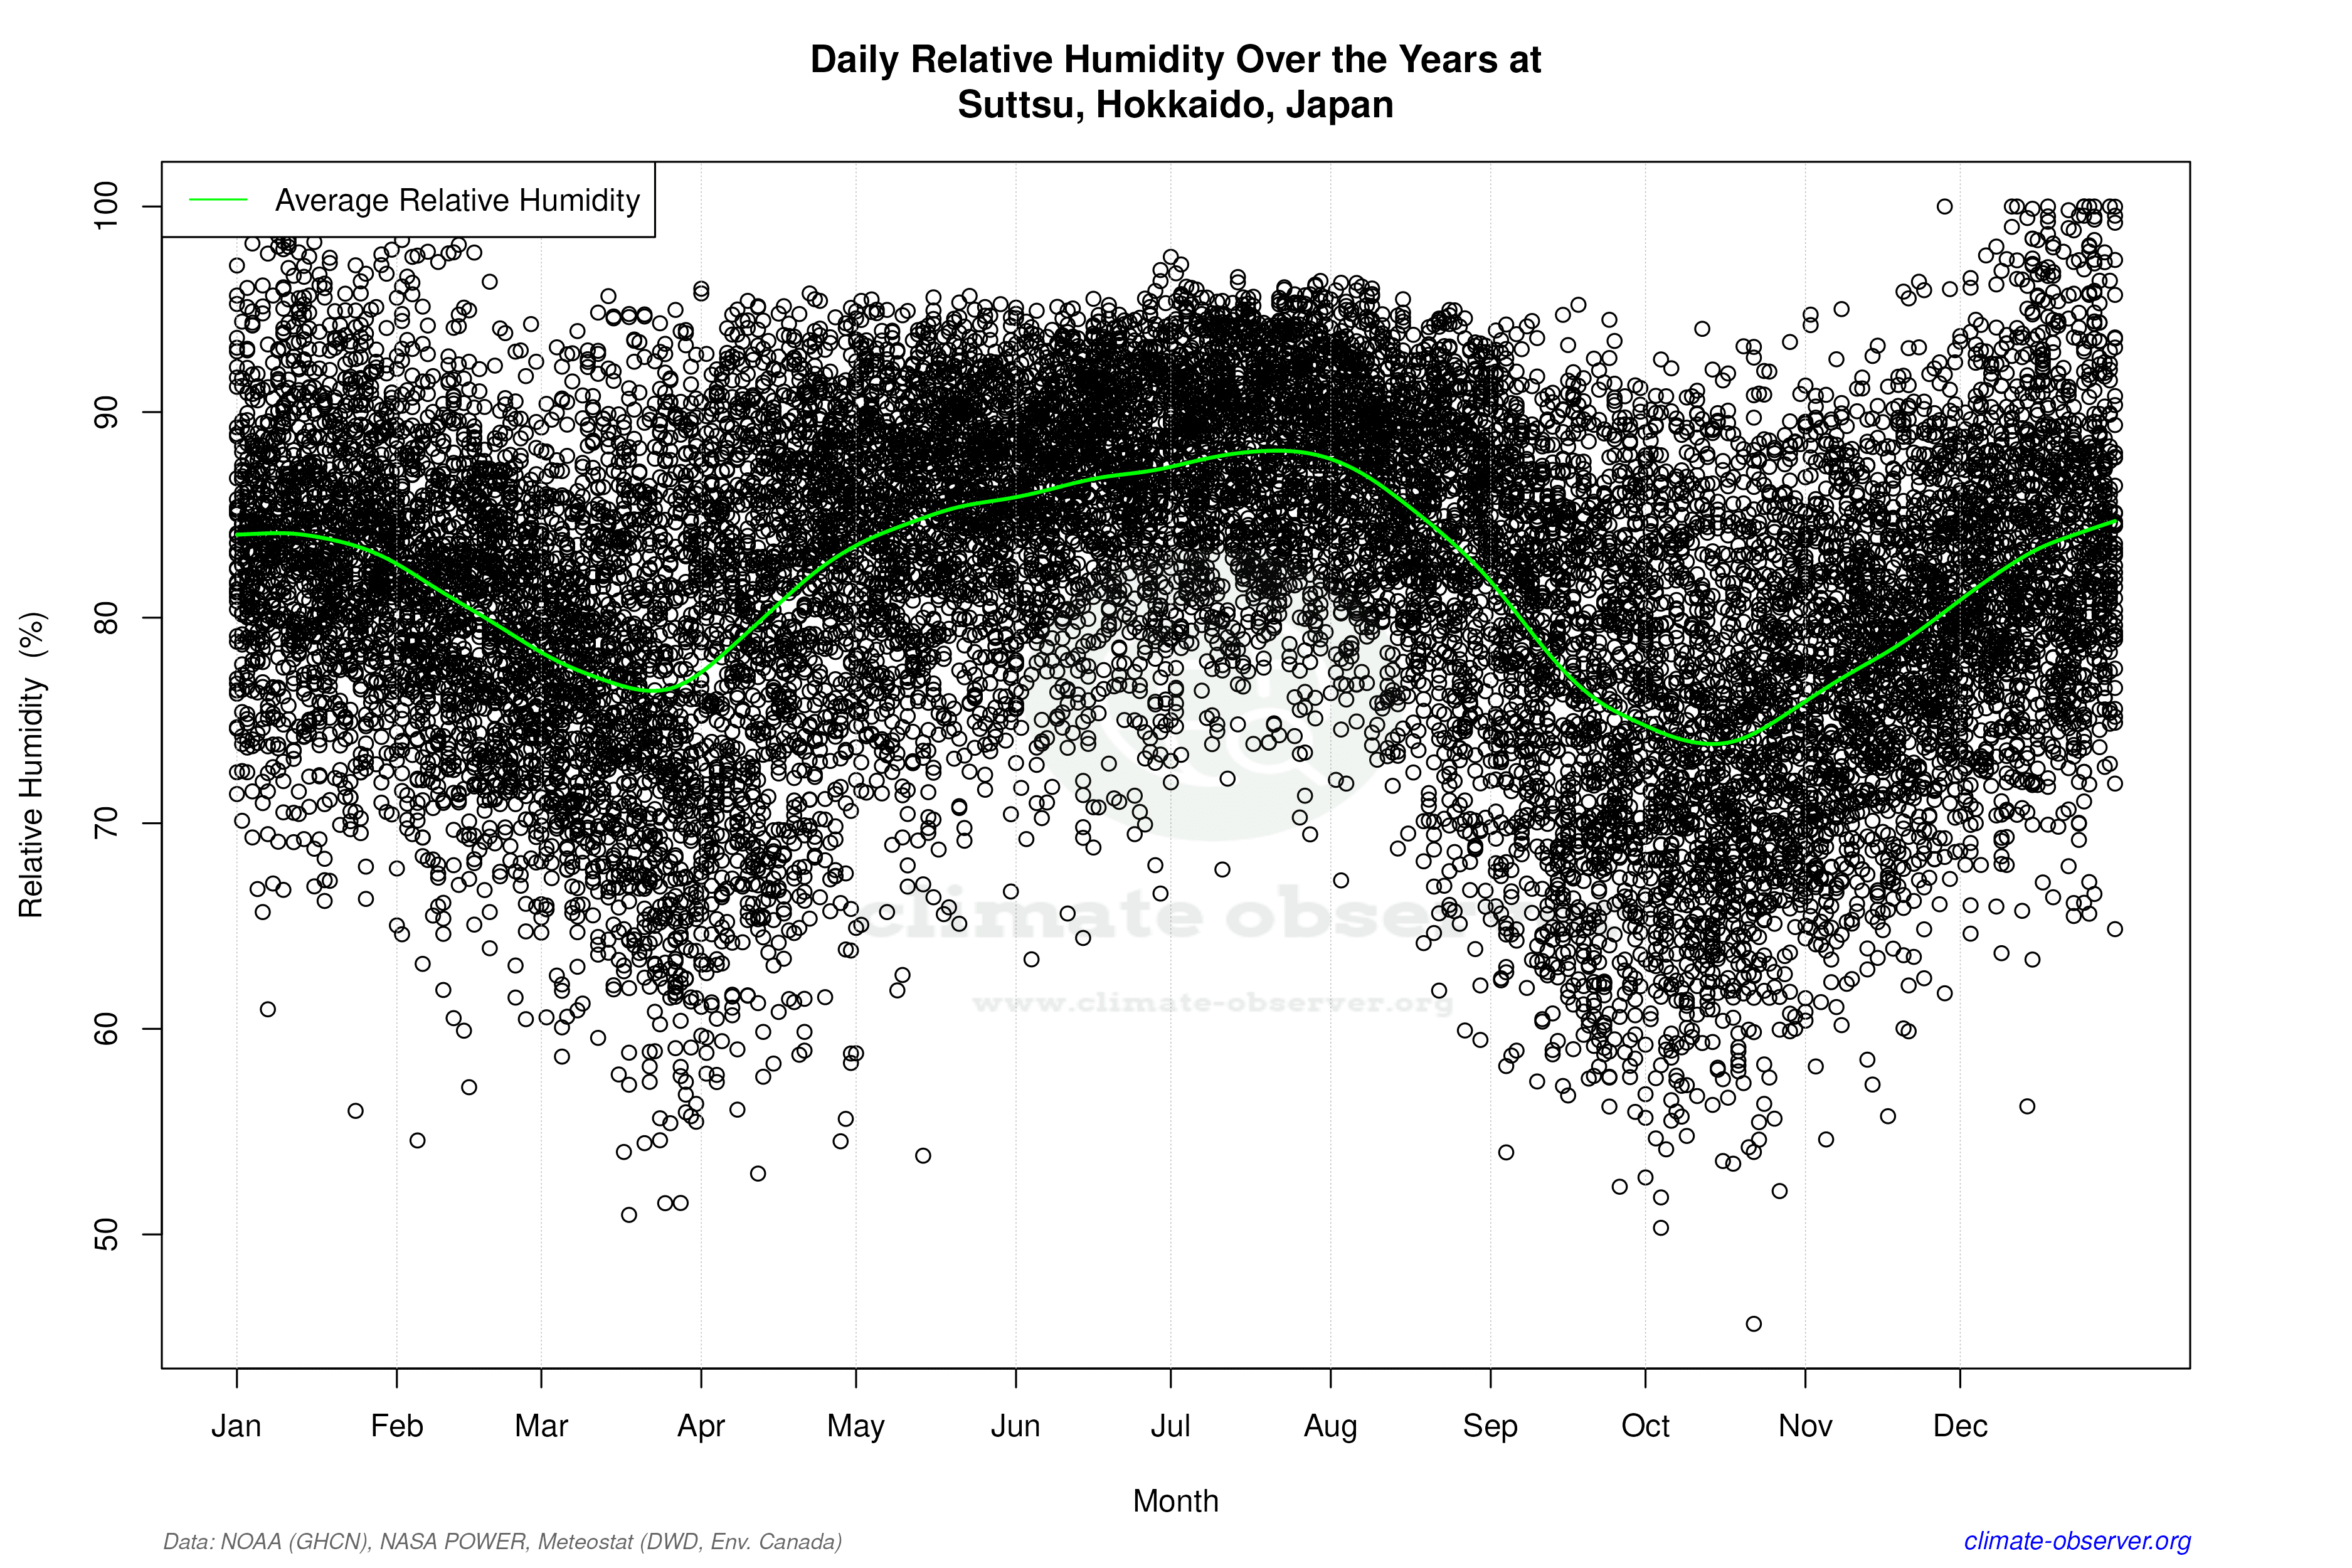

Average Max Temperature Throughout Year | 1 of 5
