Climate for Station: Akita, Japan
Loading live weather...
Climate Analysis & Overview
Akita is experiencing a warming trend, with significant increases in both high and low temperatures over the past decade. Precipitation patterns have become more evenly distributed, indicating a shift in local climate dynamics. These changes align with Japan's broader climate goals and recent weather events.
Thermal Shifts in Akita
Akita, located at 39.717°N, 140.1°E in Japan, falls under the Köppen climate classification of Cfa, which denotes a humid subtropical climate. This classification is characterised by hot, humid summers and mild winters, influenced by its proximity to the Sea of Japan and surrounding mountainous terrain. Over the past decade, Akita has experienced a notable warming trend. The average high temperatures have risen by 0.36°C (0.64°F), while the lows have increased even more significantly by 1.50°C (2.70°F). This trend is more pronounced than the all-time warming trend, where highs have increased by 0.12°C (0.22°F) and lows by 0.40°C (0.72°F). The disparity between the 10-year and all-time trends suggests a recent acceleration in warming, aligning with global climate patterns.
Precipitation Patterns and PCI Dynamics
The Precipitation Concentration Index (PCI) provides insights into how rainfall is distributed over time. Akita's PCI has decreased from a baseline of 11.29 to a current value of 10.20. This marginal change indicates that precipitation events have become more evenly distributed throughout the year. Such a shift can mitigate the risks of flooding and drought, contributing to more stable agricultural conditions. A PCI under 10 is considered very even, and Akita's current value suggests a trend towards more consistent rainfall patterns.
Record Extremes and Local Impact
Akita's climate extremes are marked by a record high of 38.2°C (100.8°F) and a record low of -13.8°C (7.0°F). These extremes highlight the potential volatility in weather patterns, which can impact local agriculture, infrastructure, and daily life. The warming trend, particularly in winter lows, may reduce heating costs and alter the growing season for local crops. However, increased summer highs could exacerbate heat stress and demand for cooling.
Contextualising Within Japan's Climate Goals
Japan has been actively working towards reducing greenhouse gas emissions and adapting to climate change impacts. Akita's warming trend and changing precipitation patterns are reflective of the broader national goals to achieve climate resilience. Recent weather events, such as typhoons and heatwaves, have underscored the urgency of these initiatives. By understanding and adapting to these local climate changes, Akita can contribute to Japan's overall climate strategy while ensuring the well-being of its residents.
Station Statistics
10-Year Trend
High: +1.44 °F/decade
Low: +2.82 °F/decade
Rain: +0.033 in/decade
25-Year Trend
High: +0.38 °F/decade
Low: +0.62 °F/decade
Rain: +0.013 in/decade
50-Year Trend
High: +0.38 °F/decade
Low: +0.72 °F/decade
Rain: +0.006 in/decade
All-Time Trend
High: +0.17 °F/decade
Low: +0.64 °F/decade
Rain: +0.001 in/decade
Percentage Above-Average Days
Last 12 Months: 51.0%
This Year: 55.3%
Precipitation Concentration Index (PCI) ℹ️
Last 12 Months: 11.3
Historical Average: 10.2
Percentile Rank of Last 12 Months ℹ️
High: 69th percentile
Low: 84th percentile
Rain: 79th percentile
Change in Variance ℹ️
High: +1.1%
Low: +5.2%
Intraday: -25.2%
Data Coverage
95.6%
First Year of Data
1951
Station Location
Historical Weather Records
| Max High | Avg High | Min High | Max Avg | Avg Avg | Min Avg | Max Low | Avg Low | Min Low | Max Precipitation | Avg Precipitation | Max Snow | Avg Snow | |
|---|---|---|---|---|---|---|---|---|---|---|---|---|---|
| Record | 100.76 °F | — | 20.84 °F | 90.68 °F | — | 18.86 °F | 83.66 °F | — | 7.16 °F | 5.01 in | — | — | — |
| January | 54.68 °F | 36.85 °F | 20.84 °F | 48.02 °F | 32.13 °F | 18.86 °F | 42.98 °F | 27.51 °F | 7.16 °F | 2.76 in | 0.17 in | — | — |
| February | 67.64 °F | 37.99 °F | 23.18 °F | 55.58 °F | 32.96 °F | 19.76 °F | 50.00 °F | 27.44 °F | 8.96 °F | 2.26 in | 0.14 in | — | — |
| March | 69.62 °F | 44.93 °F | 25.70 °F | 61.70 °F | 38.73 °F | 24.62 °F | 52.70 °F | 31.83 °F | 10.76 °F | 2.36 in | 0.14 in | — | — |
| April | 82.76 °F | 56.72 °F | 37.04 °F | 69.98 °F | 49.34 °F | 31.82 °F | 59.00 °F | 40.58 °F | 23.54 °F | 3.38 in | 0.17 in | — | — |
| May | 89.24 °F | 66.24 °F | 45.14 °F | 77.54 °F | 58.61 °F | 41.54 °F | 66.02 °F | 50.01 °F | 29.84 °F | 3.11 in | 0.15 in | — | — |
| June | 92.66 °F | 73.62 °F | 54.32 °F | 81.68 °F | 66.74 °F | 50.18 °F | 76.10 °F | 59.30 °F | 42.08 °F | 3.60 in | 0.16 in | — | — |
| July | 100.22 °F | 80.16 °F | 60.62 °F | 88.16 °F | 73.89 °F | 59.90 °F | 81.50 °F | 67.41 °F | 48.02 °F | 4.98 in | 0.25 in | — | — |
| August | 100.76 °F | 83.89 °F | 66.56 °F | 90.68 °F | 76.77 °F | 62.96 °F | 83.66 °F | 70.00 °F | 53.78 °F | 5.01 in | 0.24 in | — | — |
| September | 96.98 °F | 76.44 °F | 56.30 °F | 87.62 °F | 68.79 °F | 51.44 °F | 79.88 °F | 61.69 °F | 42.26 °F | 4.27 in | 0.23 in | — | — |
| October | 86.18 °F | 65.31 °F | 47.12 °F | 76.82 °F | 57.17 °F | 40.28 °F | 69.26 °F | 49.68 °F | 31.64 °F | 3.39 in | 0.21 in | — | — |
| November | 73.58 °F | 53.34 °F | 31.64 °F | 67.28 °F | 46.35 °F | 29.12 °F | 59.18 °F | 39.86 °F | 22.28 °F | 2.93 in | 0.24 in | — | — |
| December | 65.30 °F | 42.26 °F | 24.44 °F | 57.02 °F | 36.97 °F | 20.30 °F | 55.69 °F | 32.07 °F | 12.38 °F | 2.76 in | 0.22 in | — | — |
Data Visualisations
Remove WatermarksCurrent Year Climate Trends vs Historical


Max Temperature this Year | 1 of 6
Climate 12-Month Moving Averages
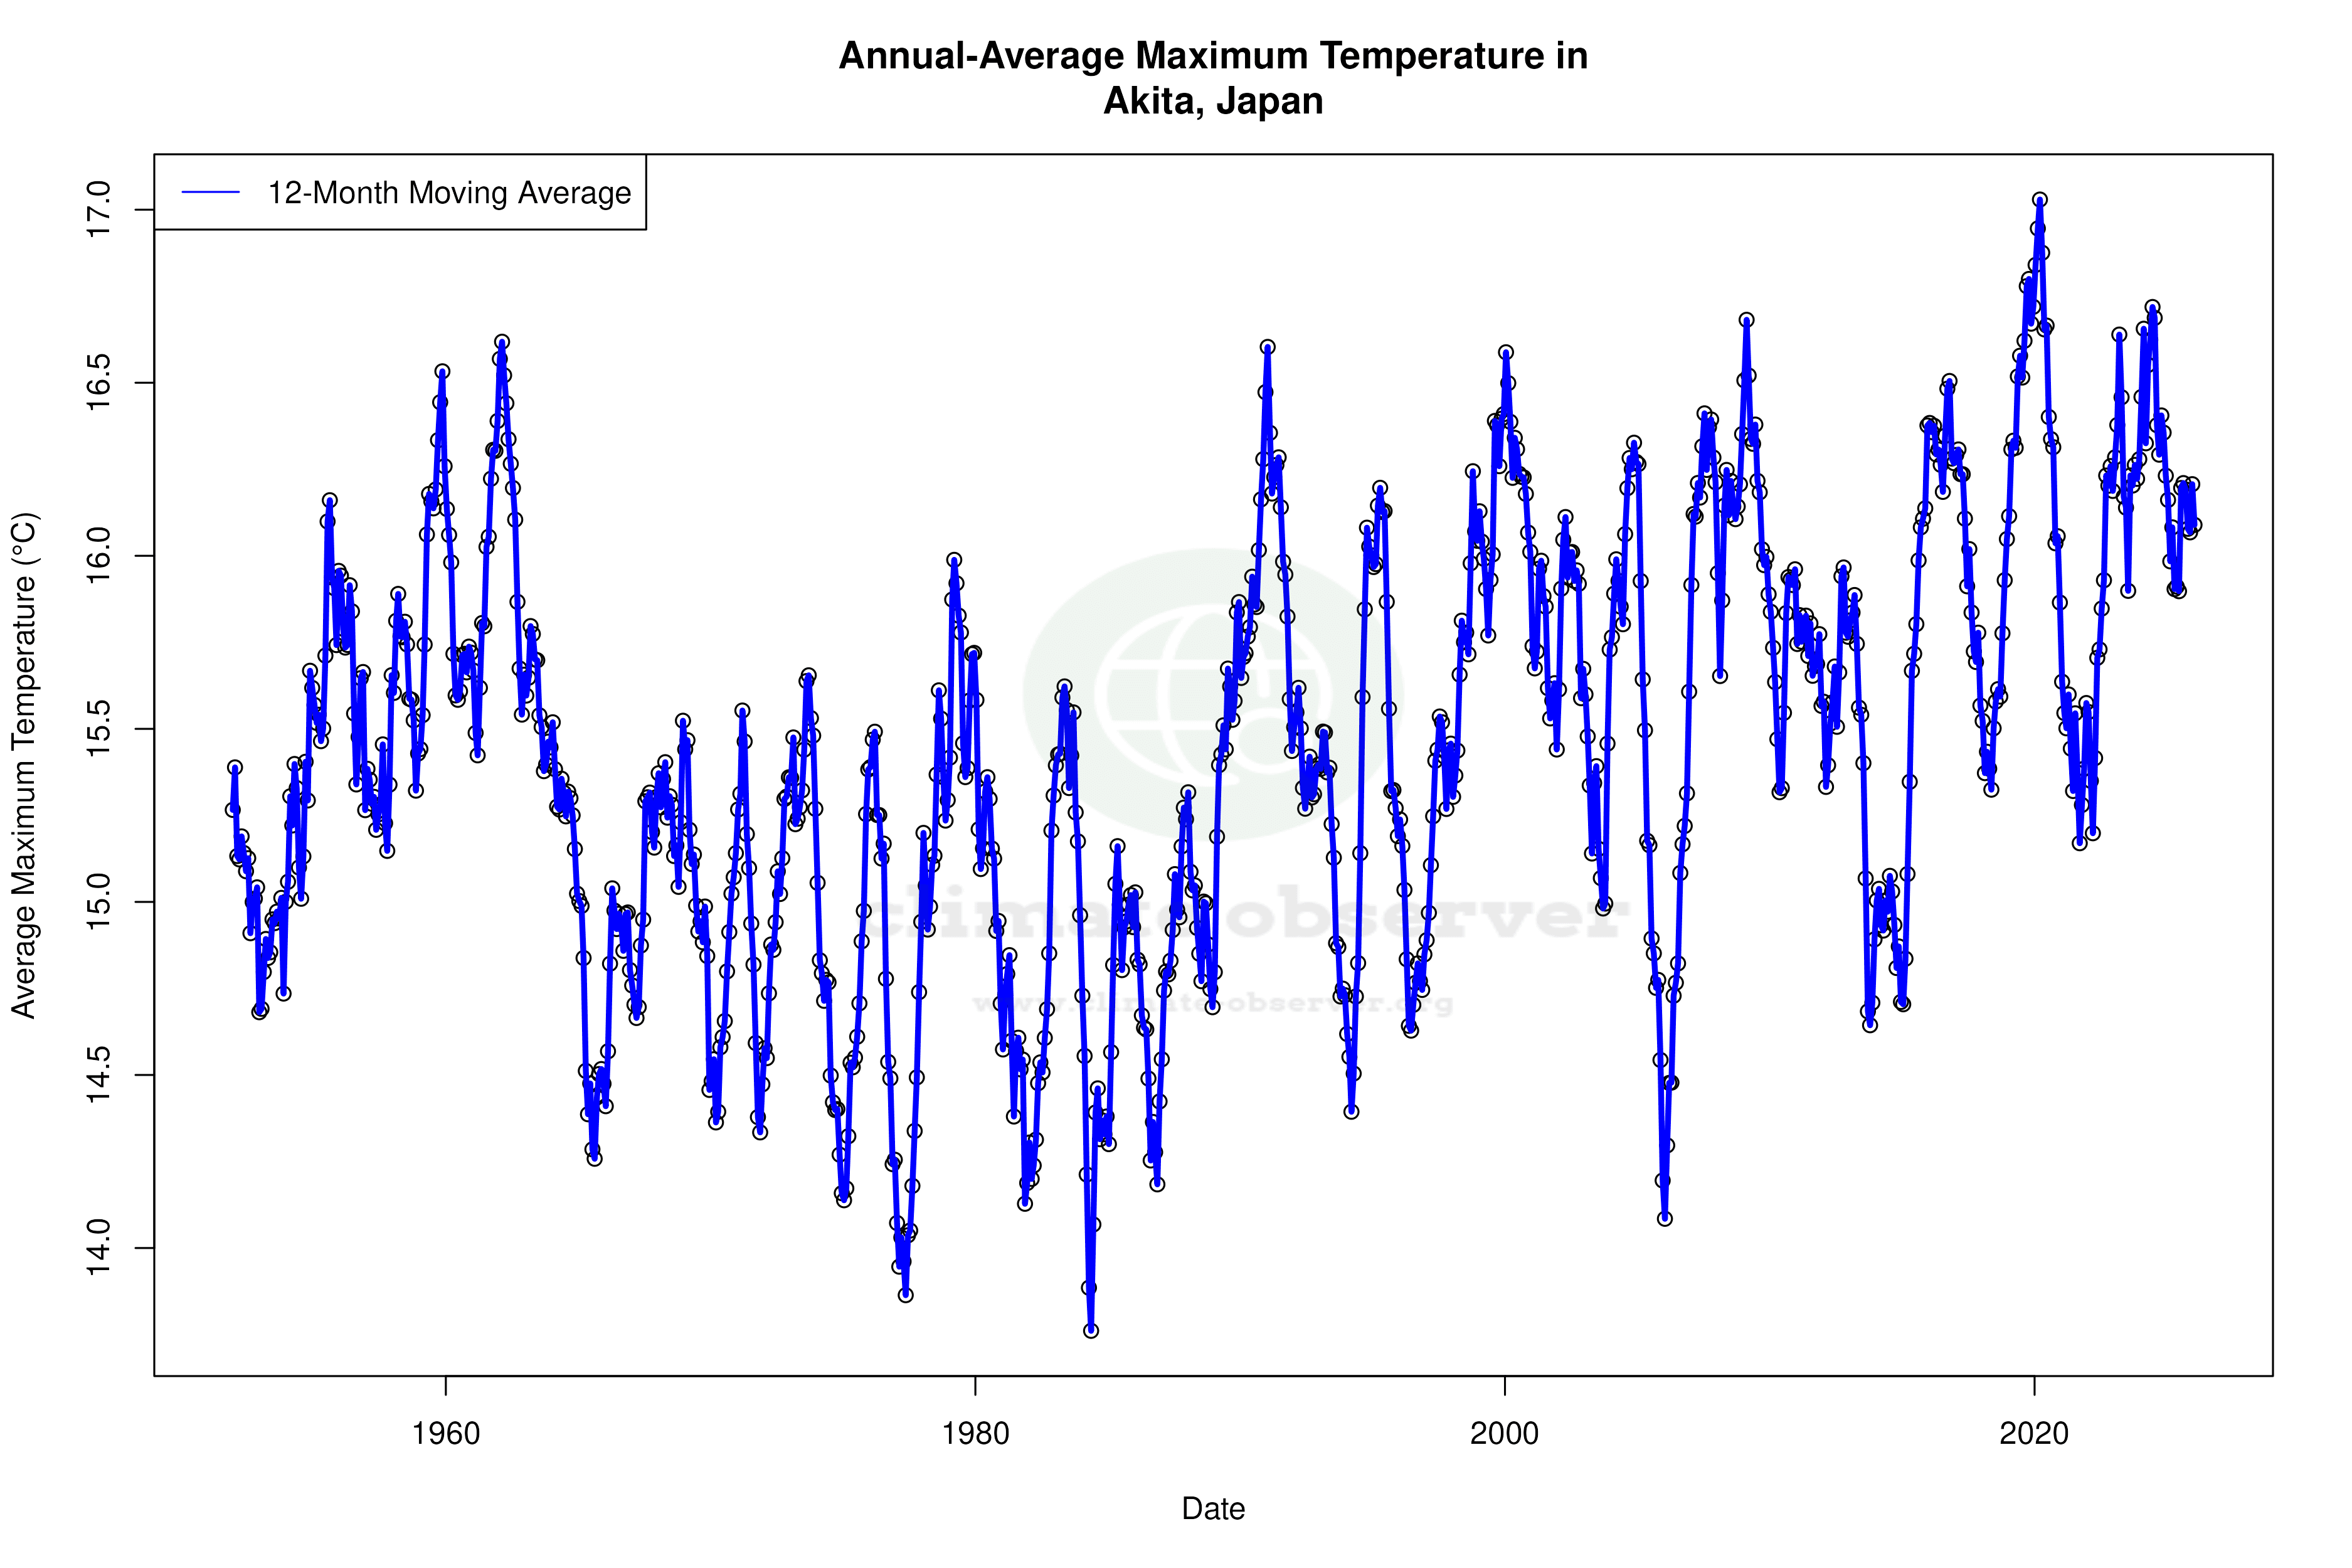


Max Temperature 12-Month MA | 1 of 6
Daily Data Points and Averages Throughout the Year


Average Max Temperature Throughout Year | 1 of 5
