Climate for Station: Kyoto, Japan
Loading live weather...
Climate Analysis & Overview
Kyoto's climate is marked by a notable warming trend, particularly in nighttime temperatures, with a significant 10-year rise in lows. Recent data indicate a more even distribution of precipitation, aligning with Japan's climate adaptation goals.
Kyoto's Warming Nights
Kyoto, nestled in a basin surrounded by mountains, experiences a humid subtropical climate (Köppen Cfa) characterized by hot summers and mild winters. The city's geography contributes to its distinct temperature patterns, with mountains trapping heat and influencing local weather conditions. Over the past decade, Kyoto has seen a dramatic increase in nighttime temperatures, with lows rising by 3.00°C (5.40°F). In contrast, the all-time trend shows a more moderate warming of 0.20°C (0.36°F). This discrepancy highlights a recent acceleration in warming, particularly during the night, which could have implications for energy use and public health.
Daytime Temperature Dynamics
While the nighttime temperatures exhibit a pronounced rise, the daytime highs have increased more modestly. Over the past ten years, highs have risen by 0.52°C (0.94°F), while the all-time trend shows a smaller increase of 0.14°C (0.25°F). This suggests a consistent warming pattern, albeit at a slower pace compared to nighttime temperatures. The record high of 39.8°C (103.6°F) underscores the potential for extreme heat events, which are becoming more common in the region.
Precipitation Patterns and Distribution
Kyoto's precipitation patterns have shown a slight shift towards more even distribution. The Precipitation Concentration Index (PCI), which measures how rainfall is spread over time, has decreased from a baseline of 11.46 to a current value of 10.35. This indicates a slight trend towards more evenly distributed rainfall events, which can reduce the risk of flooding and support water management efforts. Such changes align with Japan's broader goals of enhancing climate resilience and adapting to changing weather patterns.
Temperature Extremes and Climate Implications
The record low temperature of -8.1°C (17.4°F) highlights the city's capacity for cold extremes, despite the general warming trend. This duality of temperature extremes poses challenges for infrastructure and public services, necessitating adaptive strategies to cope with both heatwaves and cold spells. As Kyoto continues to warm, understanding these patterns is crucial for developing effective climate policies and ensuring the well-being of its residents.
Station Statistics
10-Year Trend
High: +0.84 °F/decade
Low: +5.24 °F/decade
Rain: -0.004 in/decade
25-Year Trend
High: +0.96 °F/decade
Low: +2.28 °F/decade
Rain: +0.003 in/decade
50-Year Trend
High: +0.51 °F/decade
Low: +0.50 °F/decade
Rain: +0.002 in/decade
All-Time Trend
High: +0.22 °F/decade
Low: +0.34 °F/decade
Rain: -0.002 in/decade
Percentage Above-Average Days
Last 12 Months: 49.6%
This Year: 41.5%
Precipitation Concentration Index (PCI) ℹ️
Last 12 Months: 10.7
Historical Average: 12.5
Percentile Rank of Last 12 Months ℹ️
High: 77th percentile
Low: 92nd percentile
Rain: 45th percentile
Change in Variance ℹ️
High: +4.8%
Low: +2.4%
Intraday: -14.3%
Data Coverage
89.8%
First Year of Data
1945
Station Location
Historical Weather Records
| Max High | Avg High | Min High | Max Avg | Avg Avg | Min Avg | Max Low | Avg Low | Min Low | Max Precipitation | Avg Precipitation | Max Snow | Avg Snow | |
|---|---|---|---|---|---|---|---|---|---|---|---|---|---|
| Record | 103.64 °F | — | 30.06 °F | 94.82 °F | — | 24.75 °F | 85.10 °F | — | 17.42 °F | 11.36 in | — | — | — |
| January | 65.12 °F | 47.71 °F | 32.41 °F | 56.48 °F | 39.94 °F | 24.75 °F | 52.16 °F | 32.52 °F | 17.42 °F | 2.32 in | 0.07 in | — | — |
| February | 73.04 °F | 49.41 °F | 30.06 °F | 62.42 °F | 41.23 °F | 26.60 °F | 53.82 °F | 33.19 °F | 19.40 °F | 2.58 in | 0.10 in | — | — |
| March | 77.90 °F | 56.27 °F | 34.88 °F | 68.18 °F | 47.30 °F | 28.40 °F | 61.16 °F | 37.54 °F | 23.36 °F | 3.05 in | 0.14 in | — | — |
| April | 87.08 °F | 67.54 °F | 45.86 °F | 73.04 °F | 57.79 °F | 39.74 °F | 66.92 °F | 47.04 °F | 28.22 °F | 3.74 in | 0.18 in | — | — |
| May | 93.56 °F | 76.12 °F | 54.50 °F | 82.22 °F | 66.28 °F | 49.28 °F | 74.84 °F | 55.90 °F | 35.42 °F | 6.02 in | 0.20 in | — | — |
| June | 98.96 °F | 81.54 °F | 63.68 °F | 87.80 °F | 73.23 °F | 59.34 °F | 82.40 °F | 64.60 °F | 47.30 °F | 5.45 in | 0.30 in | — | — |
| July | 103.64 °F | 88.90 °F | 69.62 °F | 91.40 °F | 80.65 °F | 66.96 °F | 83.84 °F | 72.88 °F | 56.30 °F | 7.23 in | 0.29 in | — | — |
| August | 103.64 °F | 91.65 °F | 70.70 °F | 94.82 °F | 82.57 °F | 67.82 °F | 85.10 °F | 74.56 °F | 59.18 °F | 11.36 in | 0.21 in | — | — |
| September | 100.58 °F | 83.64 °F | 60.58 °F | 88.88 °F | 75.29 °F | 58.28 °F | 82.94 °F | 67.42 °F | 46.76 °F | 7.26 in | 0.25 in | — | — |
| October | 92.48 °F | 73.08 °F | 54.34 °F | 81.68 °F | 64.23 °F | 48.02 °F | 73.94 °F | 55.52 °F | 38.30 °F | 5.53 in | 0.16 in | — | — |
| November | 80.42 °F | 62.74 °F | 42.62 °F | 73.04 °F | 53.66 °F | 38.46 °F | 68.72 °F | 44.90 °F | 28.94 °F | 3.35 in | 0.10 in | — | — |
| December | 72.86 °F | 52.64 °F | 31.80 °F | 64.22 °F | 44.29 °F | 29.14 °F | 58.64 °F | 36.26 °F | 22.64 °F | 2.03 in | 0.07 in | — | — |
Data Visualisations
Remove WatermarksCurrent Year Climate Trends vs Historical


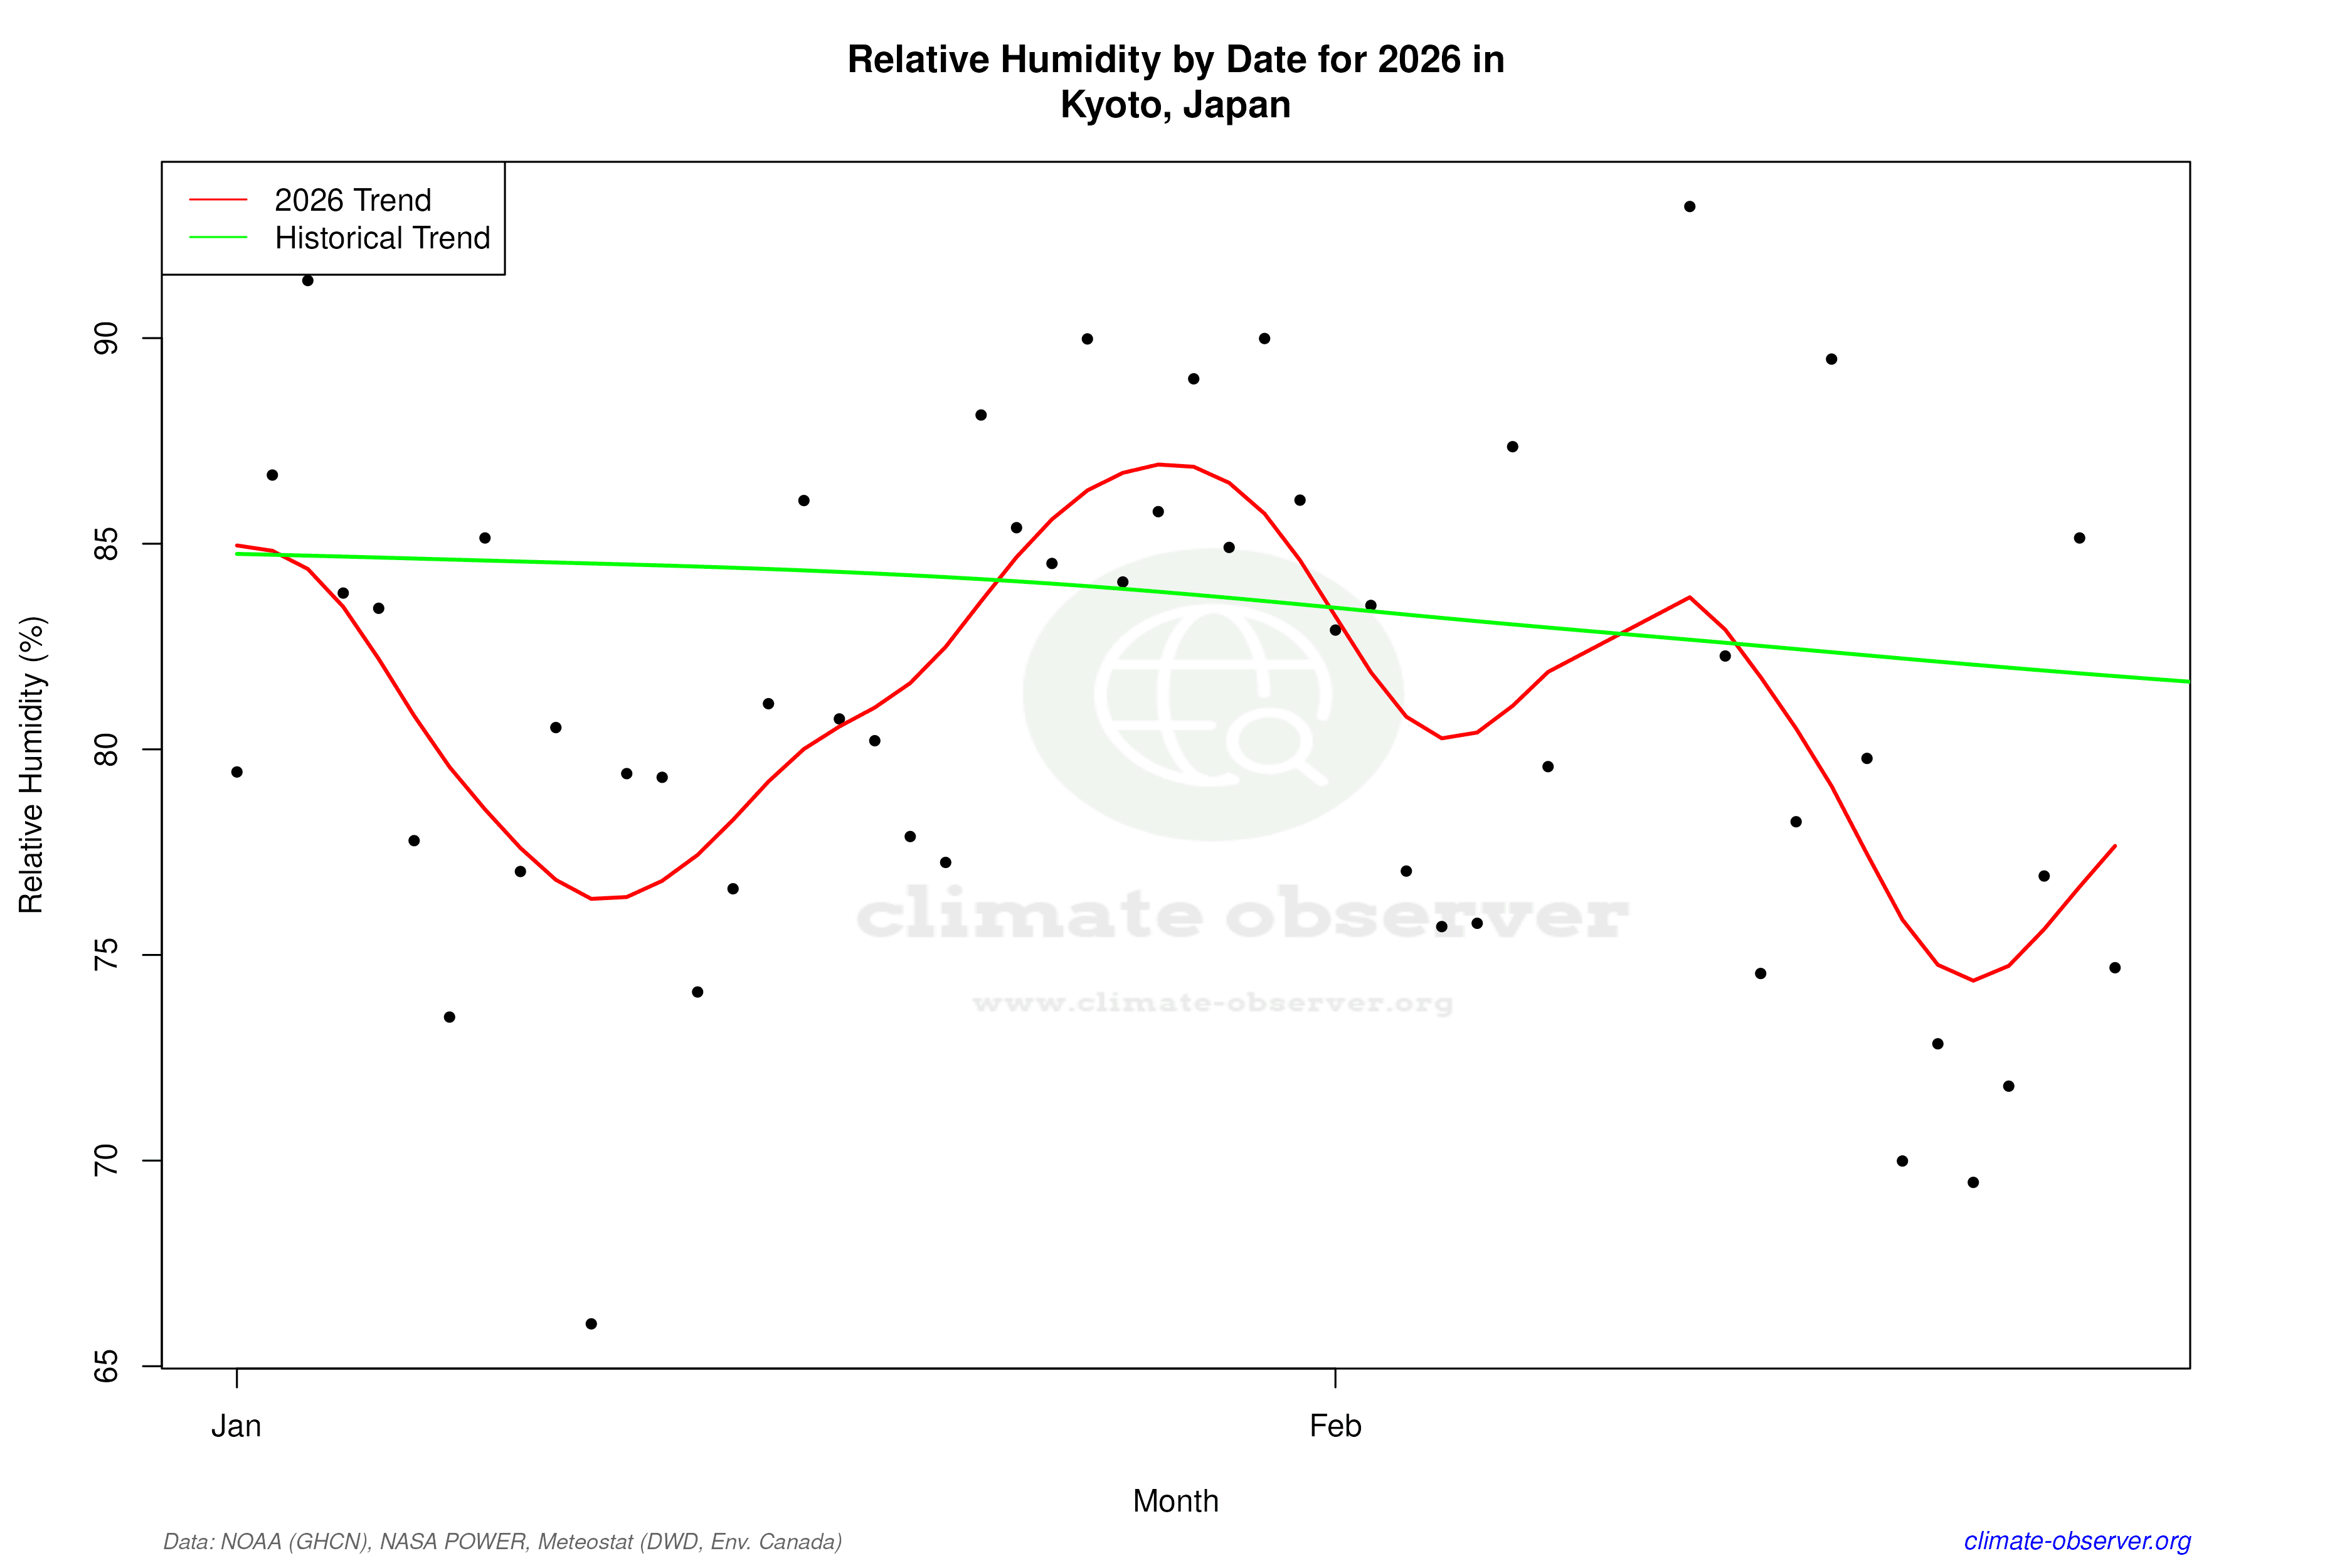

Max Temperature this Year | 1 of 6
Climate 12-Month Moving Averages


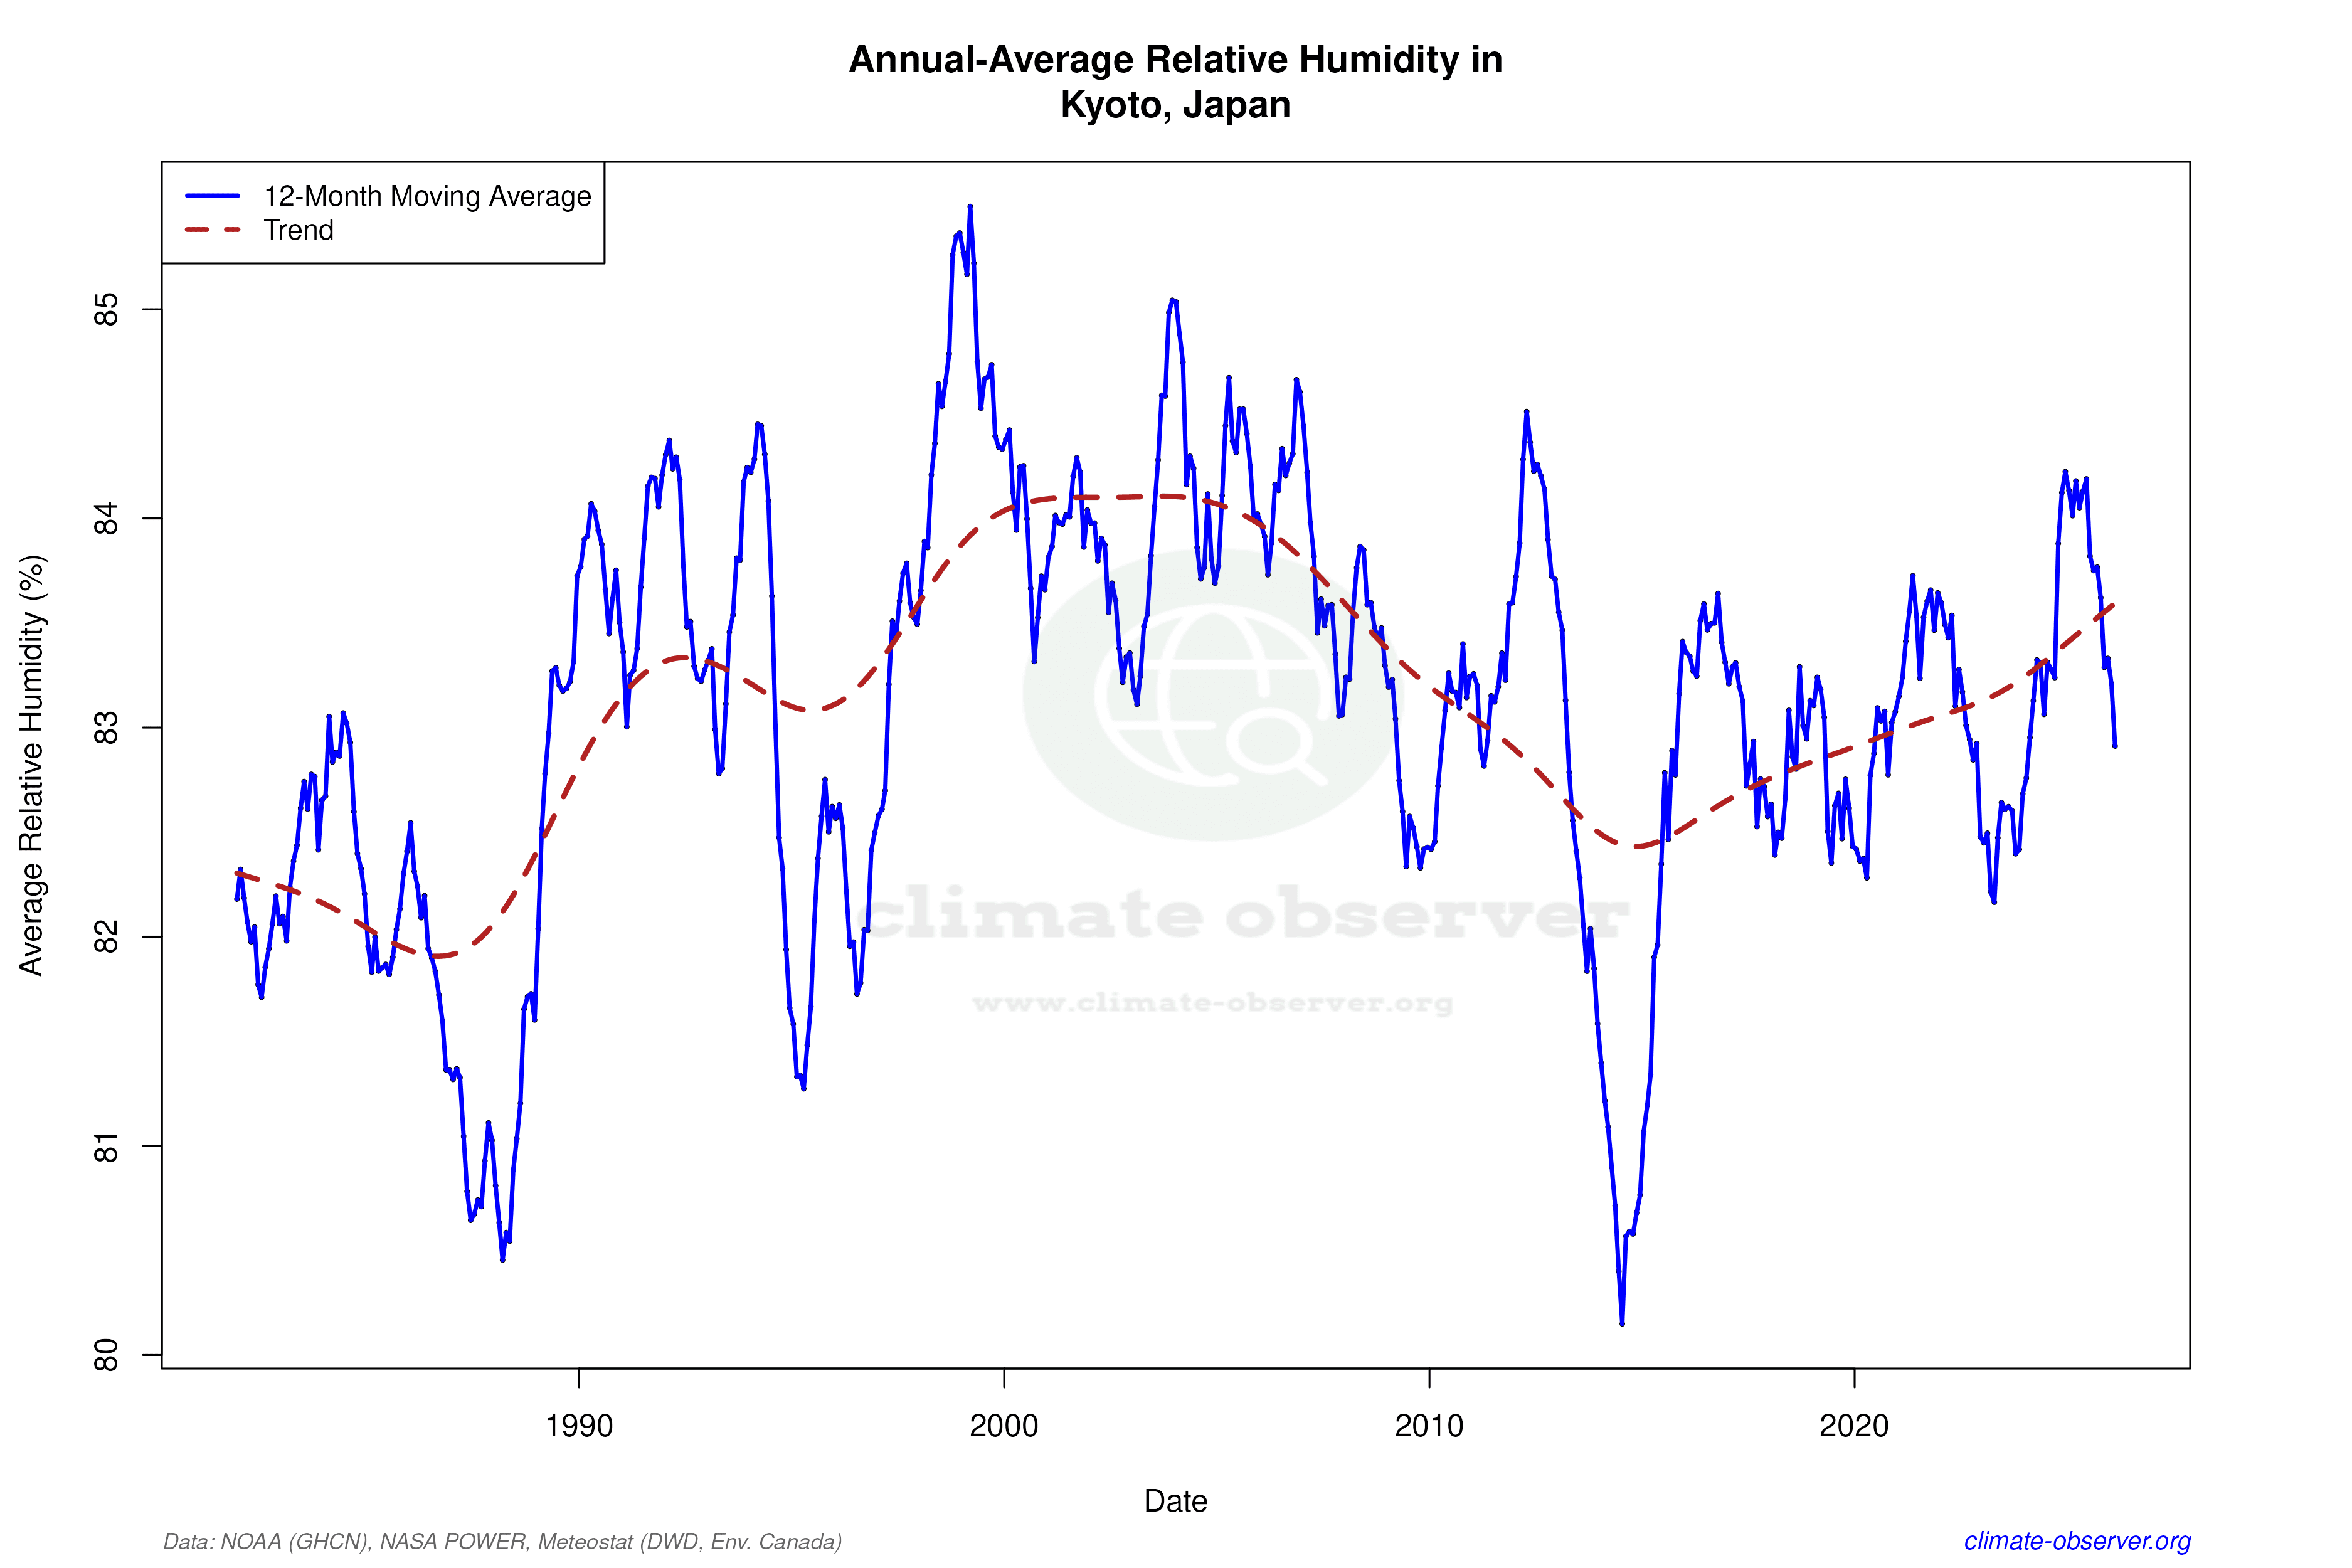

Max Temperature 12-Month MA | 1 of 6
Daily Data Points and Averages Throughout the Year


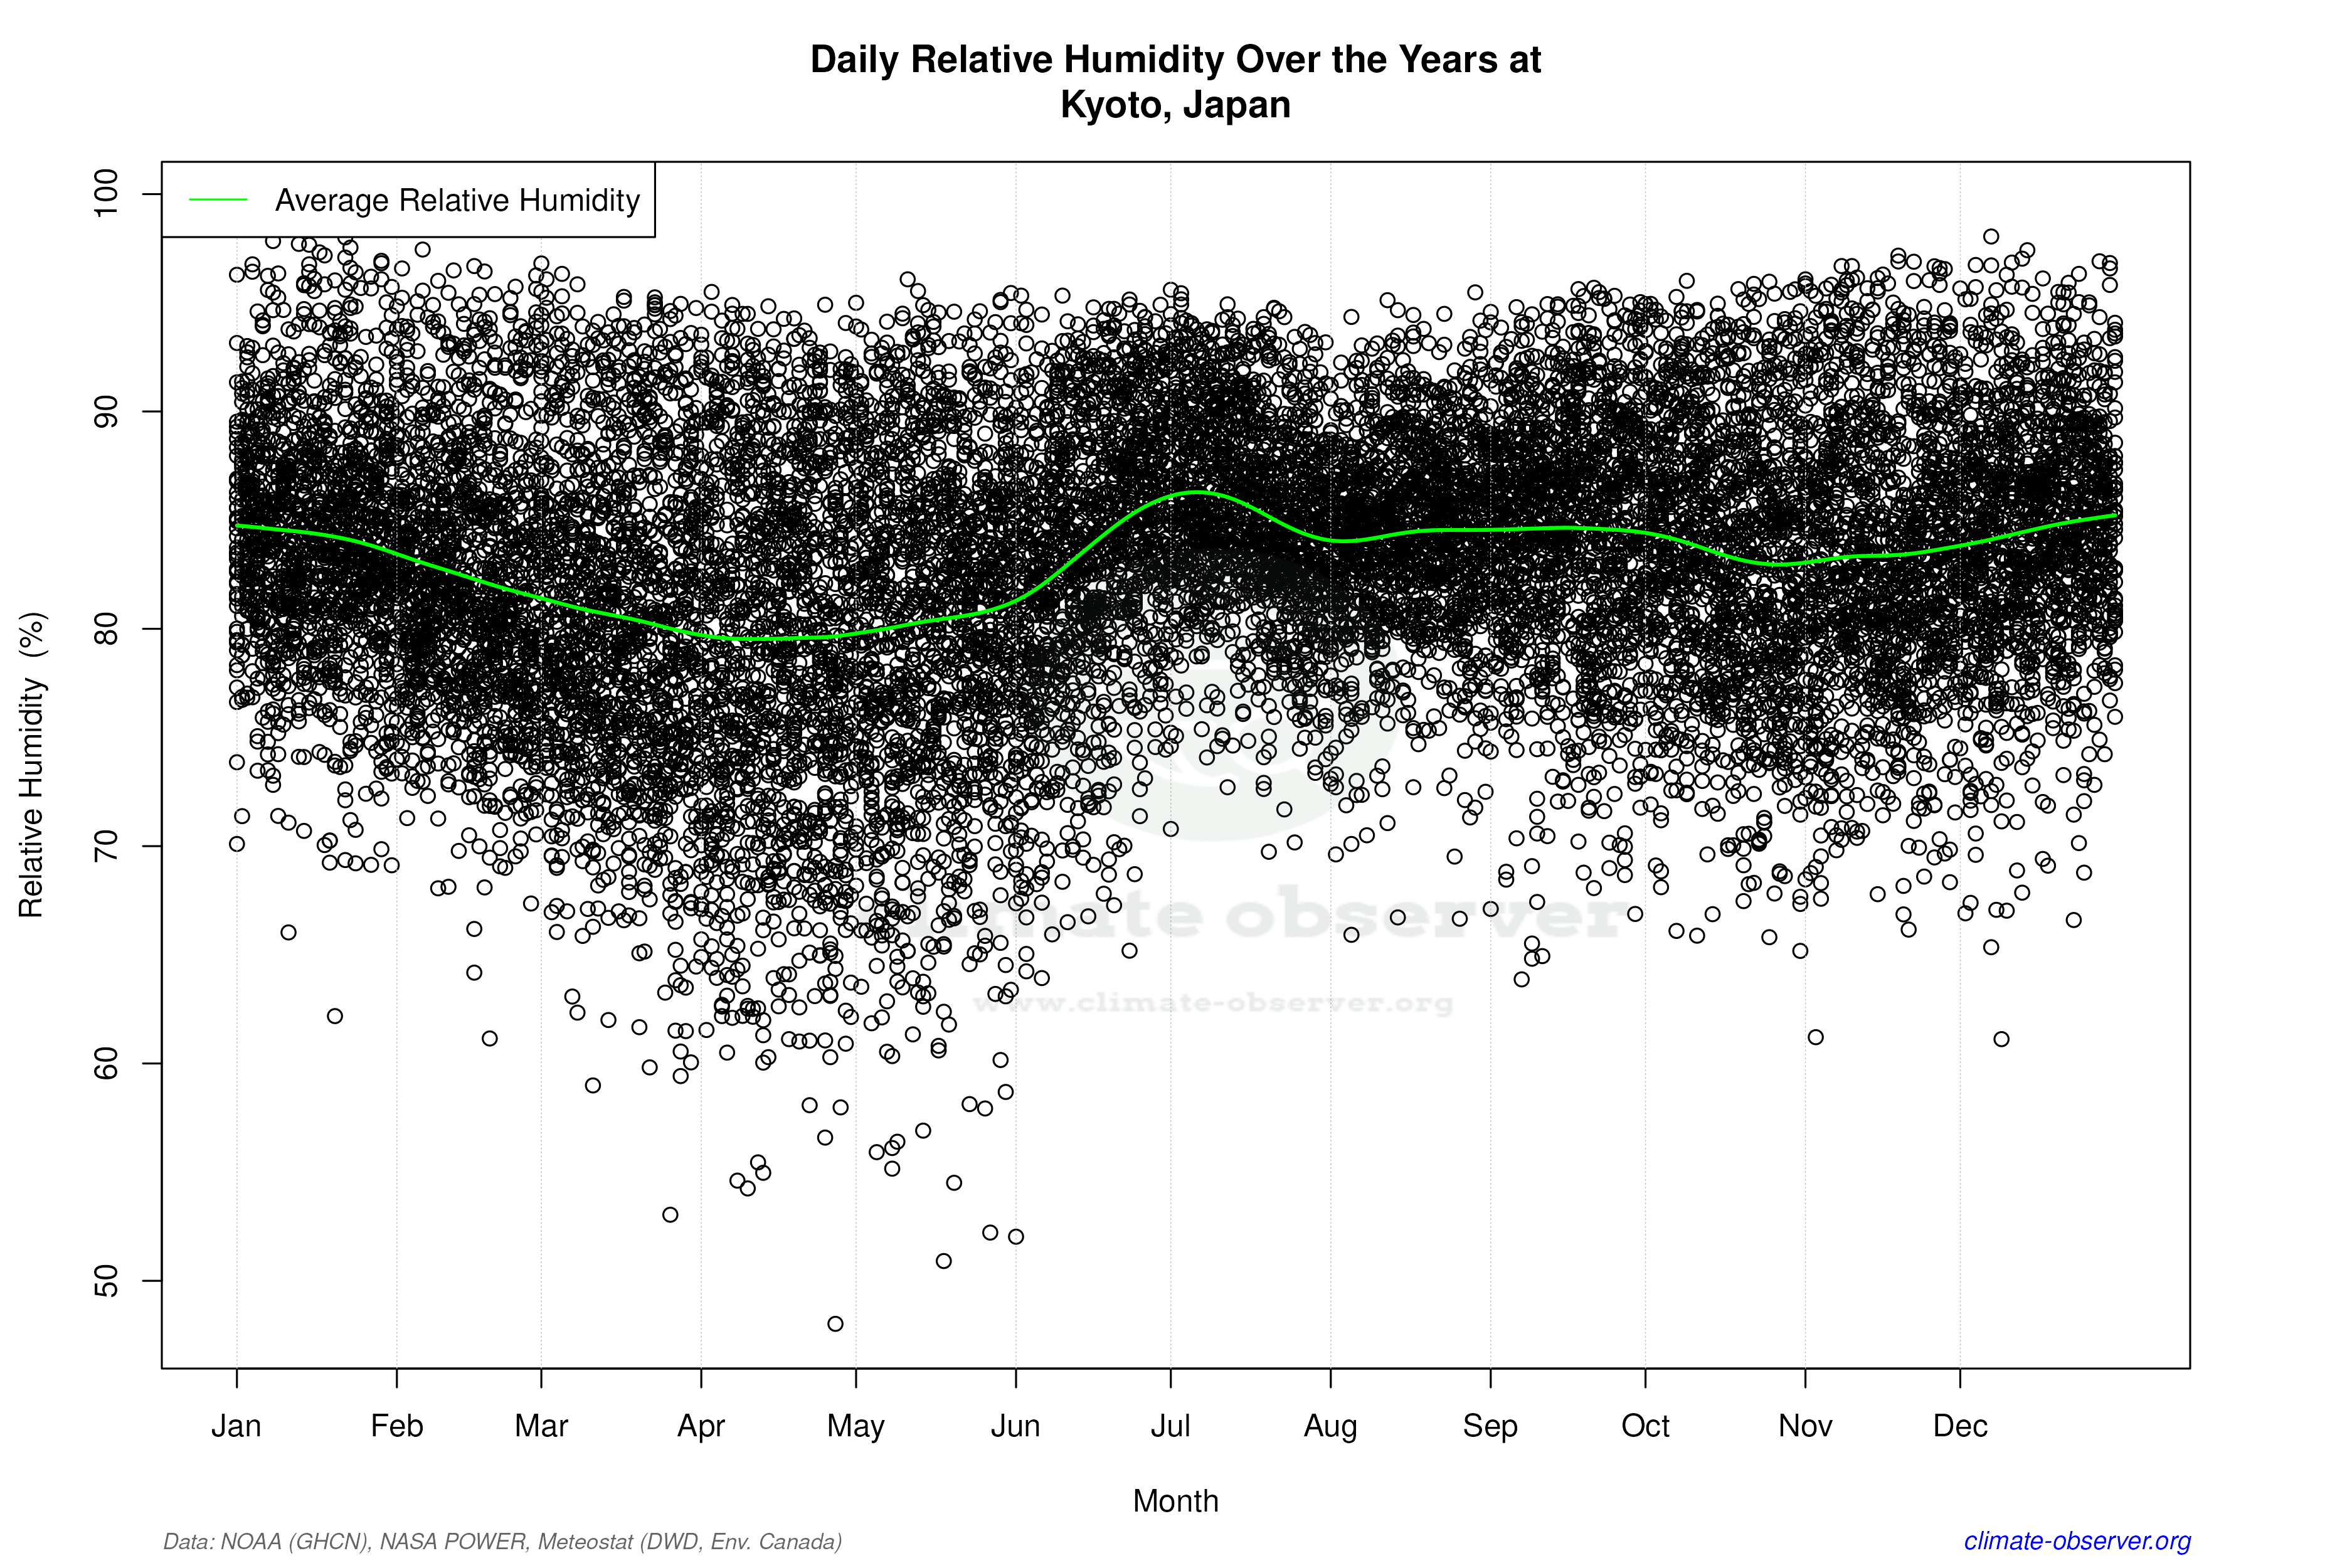

Average Max Temperature Throughout Year | 1 of 5
