Climate for Station: Naze, Kagoshima, Japan
Loading live weather...
Climate Analysis & Overview
Naze, located in the subtropical Amami Islands of Japan, is experiencing a complex climate narrative. While long-term data suggests a mild cooling trend in high temperatures, recent years show a sharper decline. Meanwhile, precipitation has become more evenly distributed, suggesting changes in rainfall patterns.
Subtropical Climate Dynamics
Naze, situated at 28.383°N, 129.5°E in the Amami Islands, falls under the Köppen climate classification of Cfa, indicating a humid subtropical climate. This region is characterised by hot, humid summers and mild winters, influenced by its proximity to the sea. The area's geography, with its coastal location, plays a significant role in moderating temperatures and influencing precipitation patterns. Despite its subtropical nature, the all-time temperature trends reveal a subtle cooling. Highs have decreased by 0.07°C (0.13°F), while lows have risen by 0.33°C (0.59°F), indicating a complex interplay between atmospheric and oceanic factors.
Recent Cooling Trends
Over the past decade, Naze has experienced a more pronounced cooling in temperature extremes. Highs have fallen by 1.69°C (3.03°F), and lows by 0.82°C (1.48°F). This recent cooling trend contrasts with the all-time data, suggesting that short-term climatic influences, possibly including regional ocean currents or atmospheric circulation changes, are impacting the area more significantly than long-term trends would suggest. Such shifts might also be influenced by broader climate variability patterns affecting Japan.
Precipitation Patterns and PCI
The Precipitation Concentration Index (PCI) is a measure of how rainfall is distributed over a period. A decrease in PCI from a baseline of 12.08 to a current value of 10.09 indicates that precipitation in Naze is becoming more evenly distributed throughout the year. This suggests a shift away from intense, concentrated rainfall events to a more consistent pattern, which can have significant implications for water management and agriculture in the region. Given that a PCI under 10 is considered very even, Naze is approaching this threshold, reflecting a noteworthy change in its precipitation dynamics.
Temperature Extremes
Naze's recorded temperature extremes highlight the variability inherent in its climate. The maximum recorded temperature is 37.3°C (99.1°F), while the minimum is 4.4°C (39.9°F). These figures underscore the region's capacity for both heat and cooler conditions, typical of a subtropical climate but also indicative of the broader climatic shifts at play.
Implications for Climate Goals
Japan has set ambitious climate goals, focusing on reducing greenhouse gas emissions and enhancing resilience to climate impacts. The trends observed in Naze, particularly the recent cooling and more even precipitation distribution, could inform regional climate adaptation strategies. Understanding these localised patterns is crucial for aligning with national objectives and ensuring sustainable development in the face of changing climatic conditions.
Station Statistics
10-Year Trend
High: -1.75 °F/decade
Low: -0.11 °F/decade
Rain: -0.046 in/decade
25-Year Trend
High: -0.99 °F/decade
Low: -0.17 °F/decade
Rain: -0.014 in/decade
50-Year Trend
High: -0.13 °F/decade
Low: +0.58 °F/decade
Rain: -0.006 in/decade
All-Time Trend
High: -0.07 °F/decade
Low: +0.60 °F/decade
Rain: -0.006 in/decade
Percentage Above-Average Days
Last 12 Months: 48.5%
This Year: 35.2%
Precipitation Concentration Index (PCI) ℹ️
Last 12 Months: 11.1
Historical Average: 11.1
Percentile Rank of Last 12 Months ℹ️
High: 63rd percentile
Low: 93rd percentile
Rain: 5th percentile
Change in Variance ℹ️
High: -11.2%
Low: -6.3%
Intraday: -20.7%
Data Coverage
95.5%
First Year of Data
1951
Station Location
Historical Weather Records
| Max High | Avg High | Min High | Max Avg | Avg Avg | Min Avg | Max Low | Avg Low | Min Low | Max Precipitation | Avg Precipitation | Max Snow | Avg Snow | |
|---|---|---|---|---|---|---|---|---|---|---|---|---|---|
| Record | 99.14 °F | — | 47.84 °F | 88.52 °F | — | 43.88 °F | 85.64 °F | — | 39.92 °F | 21.20 in | — | — | — |
| January | 82.58 °F | 63.18 °F | 47.84 °F | 72.32 °F | 58.45 °F | 43.88 °F | 69.78 °F | 53.97 °F | 40.46 °F | 6.16 in | 0.22 in | — | — |
| February | 82.76 °F | 64.14 °F | 49.28 °F | 74.84 °F | 59.36 °F | 45.68 °F | 70.02 °F | 54.63 °F | 39.92 °F | 4.11 in | 0.22 in | — | — |
| March | 86.72 °F | 68.05 °F | 51.44 °F | 78.62 °F | 62.94 °F | 46.22 °F | 72.32 °F | 57.62 °F | 41.18 °F | 6.09 in | 0.26 in | — | — |
| April | 89.24 °F | 73.62 °F | 54.50 °F | 80.42 °F | 68.14 °F | 54.50 °F | 75.74 °F | 62.91 °F | 45.50 °F | 5.55 in | 0.30 in | — | — |
| May | 91.40 °F | 78.59 °F | 64.40 °F | 84.02 °F | 73.08 °F | 61.34 °F | 79.34 °F | 68.02 °F | 53.60 °F | 7.48 in | 0.39 in | — | — |
| June | 97.34 °F | 84.19 °F | 67.82 °F | 87.80 °F | 78.93 °F | 63.86 °F | 83.48 °F | 74.06 °F | 59.90 °F | 11.06 in | 0.56 in | — | — |
| July | 99.14 °F | 89.65 °F | 76.64 °F | 88.52 °F | 83.56 °F | 73.22 °F | 85.53 °F | 78.67 °F | 67.82 °F | 15.47 in | 0.27 in | — | — |
| August | 98.42 °F | 89.01 °F | 78.62 °F | 88.34 °F | 83.05 °F | 74.84 °F | 85.64 °F | 78.60 °F | 69.80 °F | 12.85 in | 0.36 in | — | — |
| September | 94.82 °F | 86.40 °F | 74.66 °F | 86.54 °F | 80.45 °F | 70.16 °F | 85.15 °F | 76.08 °F | 60.62 °F | 21.20 in | 0.41 in | — | — |
| October | 91.40 °F | 80.20 °F | 68.18 °F | 85.28 °F | 74.82 °F | 64.22 °F | 82.94 °F | 70.20 °F | 53.42 °F | 9.27 in | 0.29 in | — | — |
| November | 87.80 °F | 73.75 °F | 59.18 °F | 83.66 °F | 68.39 °F | 56.12 °F | 80.06 °F | 63.96 °F | 49.82 °F | 15.69 in | 0.25 in | — | — |
| December | 83.48 °F | 66.89 °F | 50.18 °F | 75.92 °F | 61.73 °F | 49.28 °F | 73.51 °F | 57.24 °F | 43.16 °F | 9.94 in | 0.20 in | — | — |
Data Visualisations
Remove WatermarksCurrent Year Climate Trends vs Historical


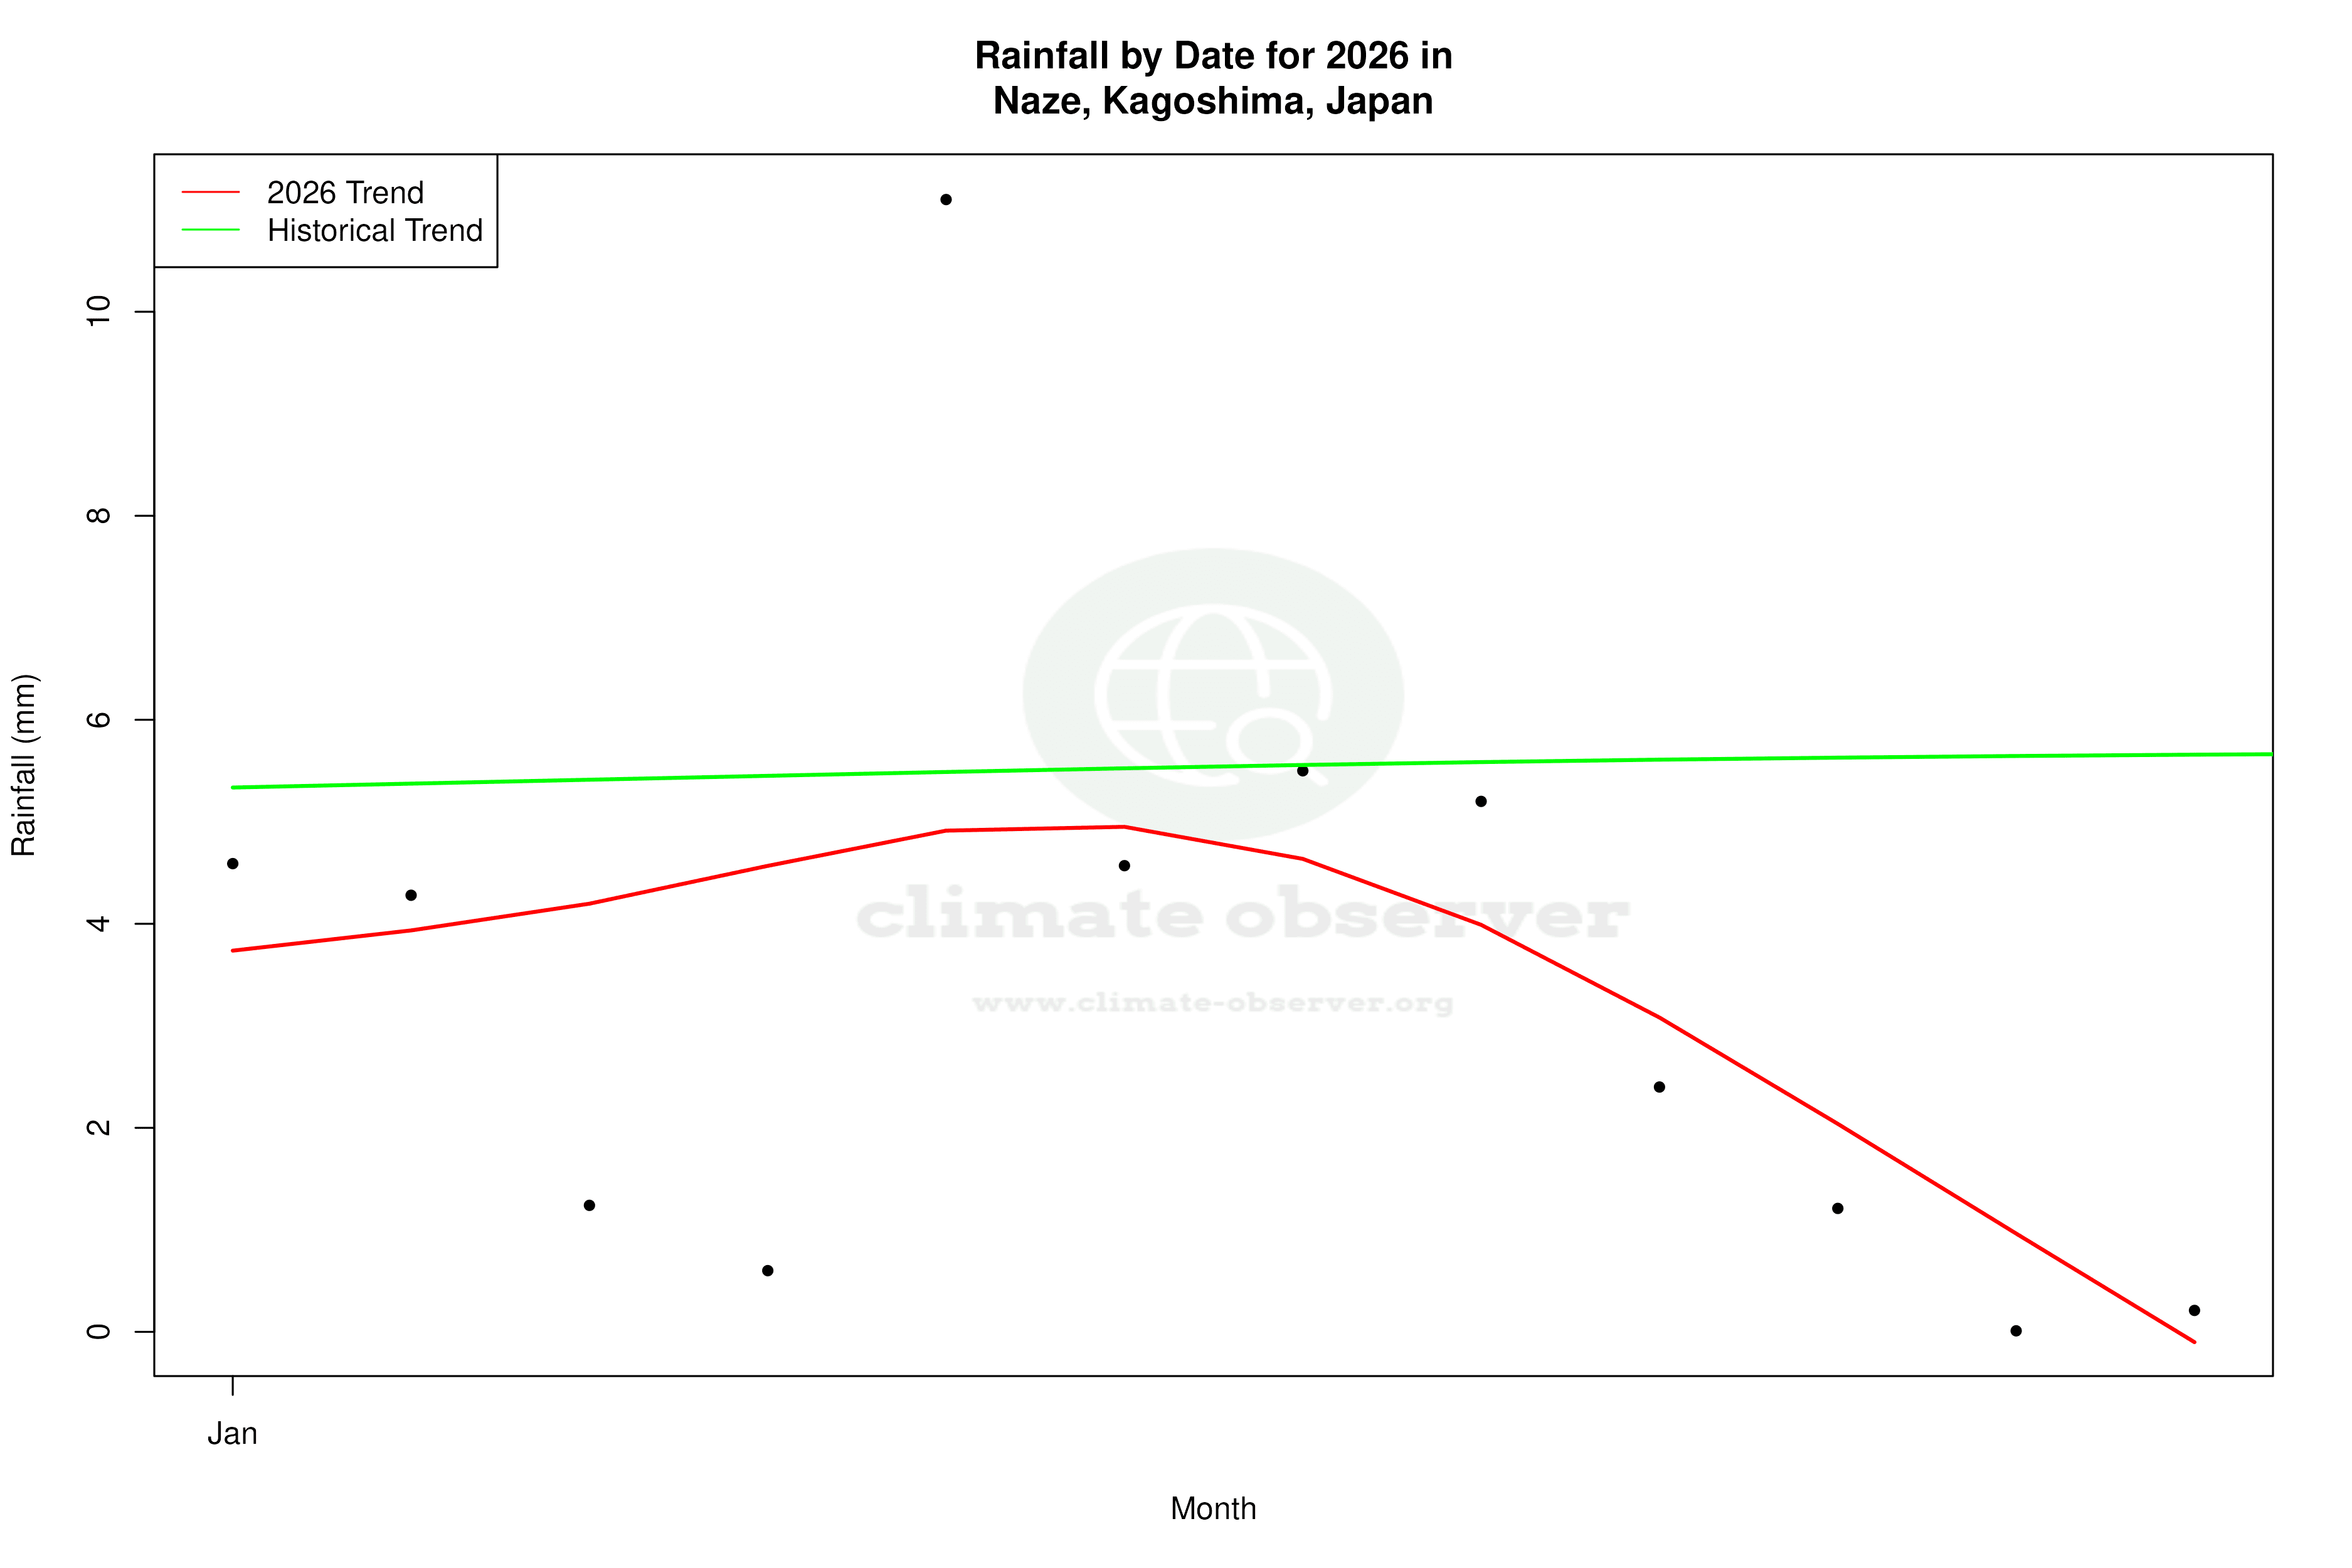


Max Temperature this Year | 1 of 6
Climate 12-Month Moving Averages


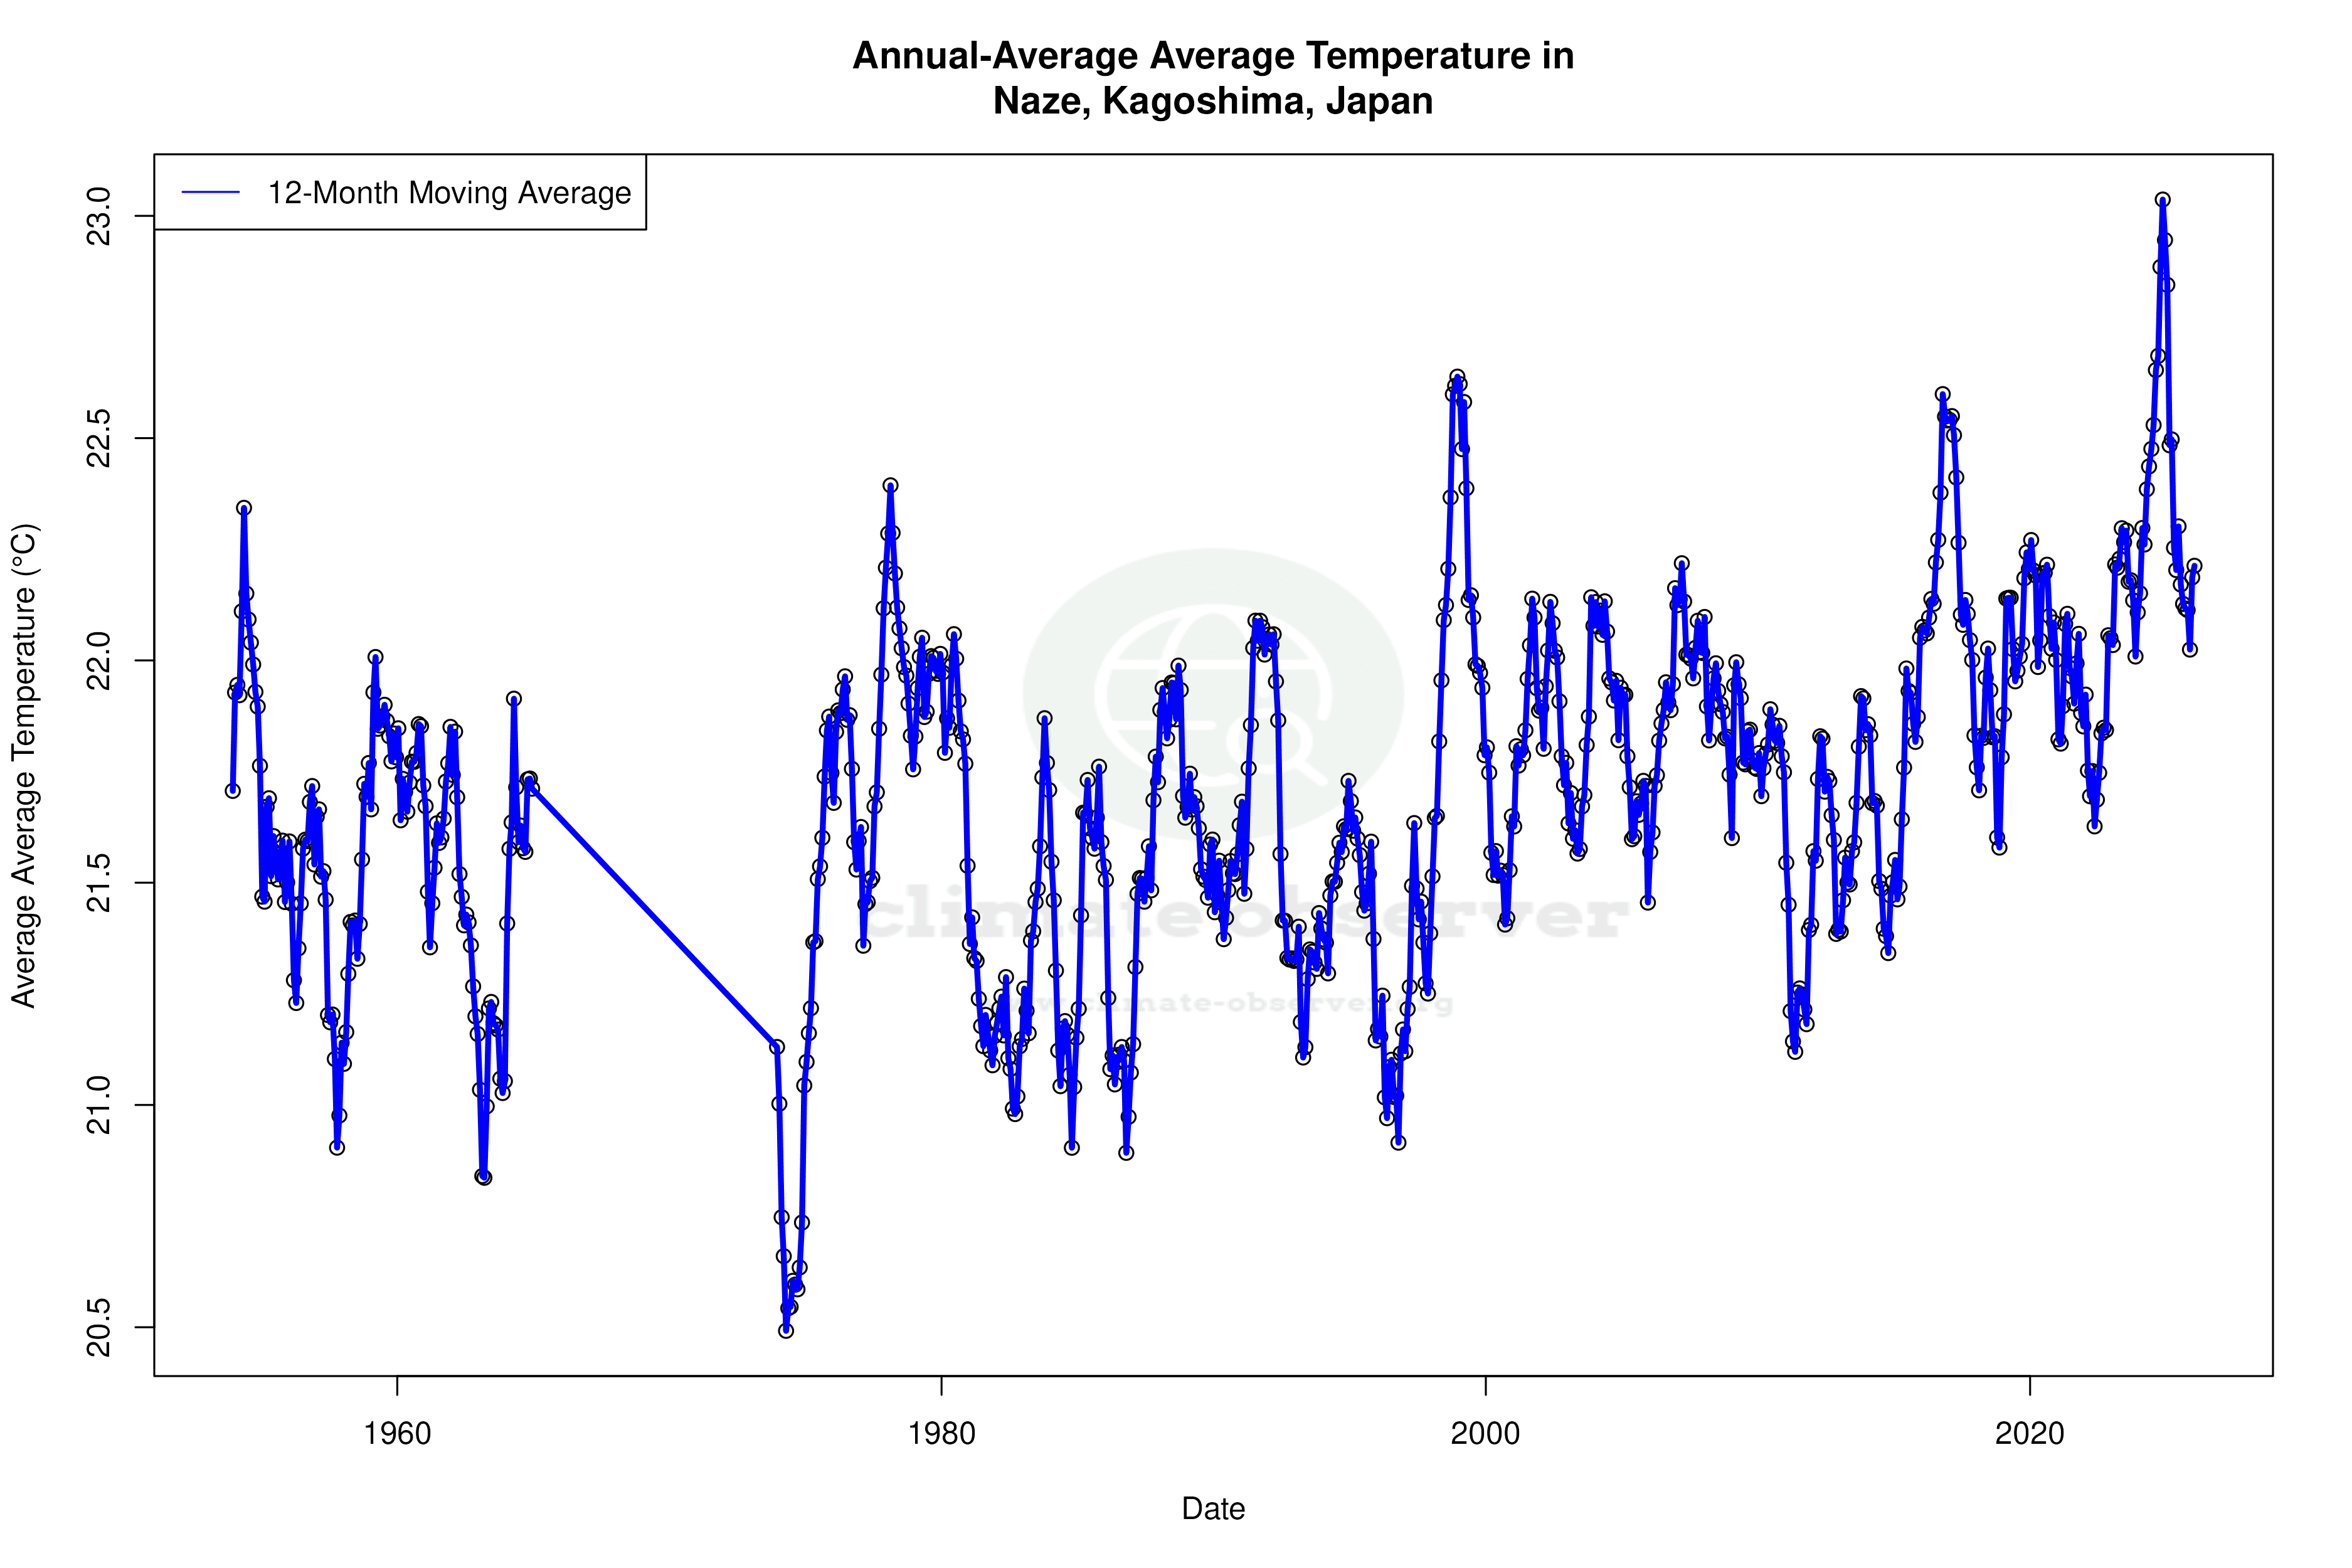


Max Temperature 12-Month MA | 1 of 6
Daily Data Points and Averages Throughout the Year


Average Max Temperature Throughout Year | 1 of 5
