Climate for Station: Montego Bay/Sangste, St. James Parish, Jamaica
Loading live weather...
Climate Analysis & Overview
Montego Bay is experiencing a warming trend in both high and low temperatures, with a slight increase in precipitation concentration. This suggests a shift towards more intense rainfall events, aligning with Jamaica's climate goals to adapt to changing weather patterns.
Tropical Maritime Influence
Montego Bay, located at 18.5°N, -77.917°W, enjoys a tropical climate, classified under the Köppen system as a tropical monsoon climate (Am). The proximity to the Caribbean Sea moderates temperatures, but recent data indicates a warming trend. Over the past decade, high temperatures have increased by 0.50°C (0.90°F), while lows have risen more sharply by 0.73°C (1.32°F). This trend is consistent with the all-time data, where highs have risen by 0.50°C (0.90°F) and lows by 0.42°C (0.76°F). The warming of low temperatures may suggest warmer nights, a common characteristic of urban heat islands and changing global climate patterns.
Temperature Extremes and Records
The region has recorded a maximum temperature of 38.8°C (101.8°F) and a minimum of 16.0°C (60.8°F). These extremes highlight the variability within the tropical climate, influenced by both local geography and broader climatic shifts. The coastal location helps moderate extremes, but the warming trend could push these boundaries further, potentially impacting local ecosystems and tourism.
Precipitation Patterns and Changes
The Precipitation Concentration Index (PCI) for Montego Bay has shown a slight increase from a baseline of 13.78 to a current value of 14.02. The PCI measures how rainfall is distributed over time; a higher value indicates that precipitation is becoming more concentrated in fewer, more intense events. This change suggests that while overall rainfall may not have increased significantly, the intensity and potential for flooding during rain events might be rising. This aligns with Jamaica's broader climate adaptation goals, which focus on managing more extreme weather patterns.
Regional Climate Goals and Adaptation
Jamaica's climate strategy aims to enhance resilience against increasing temperatures and changing precipitation patterns. The observed warming trends in Montego Bay, especially the sharper rise in low temperatures, underscore the importance of these goals. As the region continues to experience more concentrated rainfall events, infrastructure and community planning must adapt to mitigate potential impacts such as flooding and water scarcity.
Implications for Local Environment
The warming trends and changing precipitation patterns have significant implications for Montego Bay's environment and economy. Warmer temperatures can affect marine life, particularly coral reefs, which are sensitive to temperature changes. Additionally, more intense rainfall events could impact agriculture and infrastructure. These changes necessitate adaptive strategies to ensure the sustainability of local resources and the well-being of the community.
Station Statistics
10-Year Trend
High: +0.11 °F/decade
Low: +1.72 °F/decade
Rain: +0.004 in/decade
25-Year Trend
High: +1.01 °F/decade
Low: +0.67 °F/decade
Rain: -0.020 in/decade
50-Year Trend
High: +0.88 °F/decade
Low: +0.75 °F/decade
Rain: -0.002 in/decade
All-Time Trend
High: +0.88 °F/decade
Low: +0.77 °F/decade
Rain: -0.002 in/decade
Percentage Above-Average Days
Last 12 Months: 37.8%
This Year: 10.8%
Precipitation Concentration Index (PCI) ℹ️
Last 12 Months: 14.0
Historical Average: 13.0
Percentile Rank of Last 12 Months ℹ️
High: 68th percentile
Low: 99th percentile
Rain: 14th percentile
Change in Variance ℹ️
High: -10.5%
Low: -28.6%
Intraday: -23.6%
Data Coverage
95.7%
First Year of Data
1973
Station Location
Historical Weather Records
| Max High | Avg High | Min High | Max Avg | Avg Avg | Min Avg | Max Low | Avg Low | Min Low | Max Precipitation | Avg Precipitation | Max Snow | Avg Snow | |
|---|---|---|---|---|---|---|---|---|---|---|---|---|---|
| Record | 101.84 °F | — | 70.66 °F | 91.94 °F | — | 68.18 °F | 83.16 °F | — | 60.80 °F | 19.06 in | — | — | — |
| January | 92.84 °F | 85.05 °F | 73.40 °F | 84.02 °F | 77.84 °F | 68.18 °F | 78.80 °F | 71.06 °F | 60.80 °F | 19.06 in | 0.08 in | — | — |
| February | 93.56 °F | 85.46 °F | 70.66 °F | 83.30 °F | 77.84 °F | 68.72 °F | 77.56 °F | 70.61 °F | 60.80 °F | 1.64 in | 0.06 in | — | — |
| March | 95.00 °F | 86.41 °F | 73.40 °F | 85.46 °F | 78.64 °F | 71.42 °F | 79.70 °F | 71.43 °F | 62.60 °F | 11.69 in | 0.07 in | — | — |
| April | 96.08 °F | 87.71 °F | 78.80 °F | 84.74 °F | 80.03 °F | 73.58 °F | 79.84 °F | 73.13 °F | 65.30 °F | 13.11 in | 0.09 in | — | — |
| May | 98.06 °F | 89.09 °F | 80.60 °F | 87.44 °F | 81.35 °F | 75.02 °F | 81.55 °F | 74.46 °F | 64.40 °F | 4.12 in | 0.17 in | — | — |
| June | 97.52 °F | 90.43 °F | 80.20 °F | 89.96 °F | 82.67 °F | 72.86 °F | 81.90 °F | 75.43 °F | 68.72 °F | 7.52 in | 0.15 in | — | — |
| July | 101.84 °F | 91.12 °F | 82.40 °F | 89.42 °F | 83.17 °F | 75.02 °F | 82.36 °F | 75.83 °F | 65.48 °F | 2.17 in | 0.11 in | — | — |
| August | 99.32 °F | 91.22 °F | 82.40 °F | 91.94 °F | 83.13 °F | 75.56 °F | 82.40 °F | 76.08 °F | 66.92 °F | 6.43 in | 0.16 in | — | — |
| September | 97.52 °F | 90.36 °F | 80.89 °F | 89.24 °F | 82.58 °F | 73.40 °F | 83.16 °F | 75.86 °F | 67.46 °F | 11.93 in | 0.22 in | — | — |
| October | 98.60 °F | 89.30 °F | 80.60 °F | 87.26 °F | 81.70 °F | 73.22 °F | 82.22 °F | 75.25 °F | 64.76 °F | 11.50 in | 0.21 in | — | — |
| November | 94.28 °F | 87.48 °F | 77.18 °F | 87.26 °F | 80.61 °F | 73.22 °F | 80.67 °F | 74.39 °F | 66.20 °F | 19.06 in | 0.17 in | — | — |
| December | 93.20 °F | 85.91 °F | 71.60 °F | 84.56 °F | 79.04 °F | 69.51 °F | 79.70 °F | 72.56 °F | 62.60 °F | 11.61 in | 0.10 in | — | — |
Data Visualisations
Remove WatermarksCurrent Year Climate Trends vs Historical


Max Temperature this Year | 1 of 6
Climate 12-Month Moving Averages


Max Temperature 12-Month MA | 1 of 6
Daily Data Points and Averages Throughout the Year


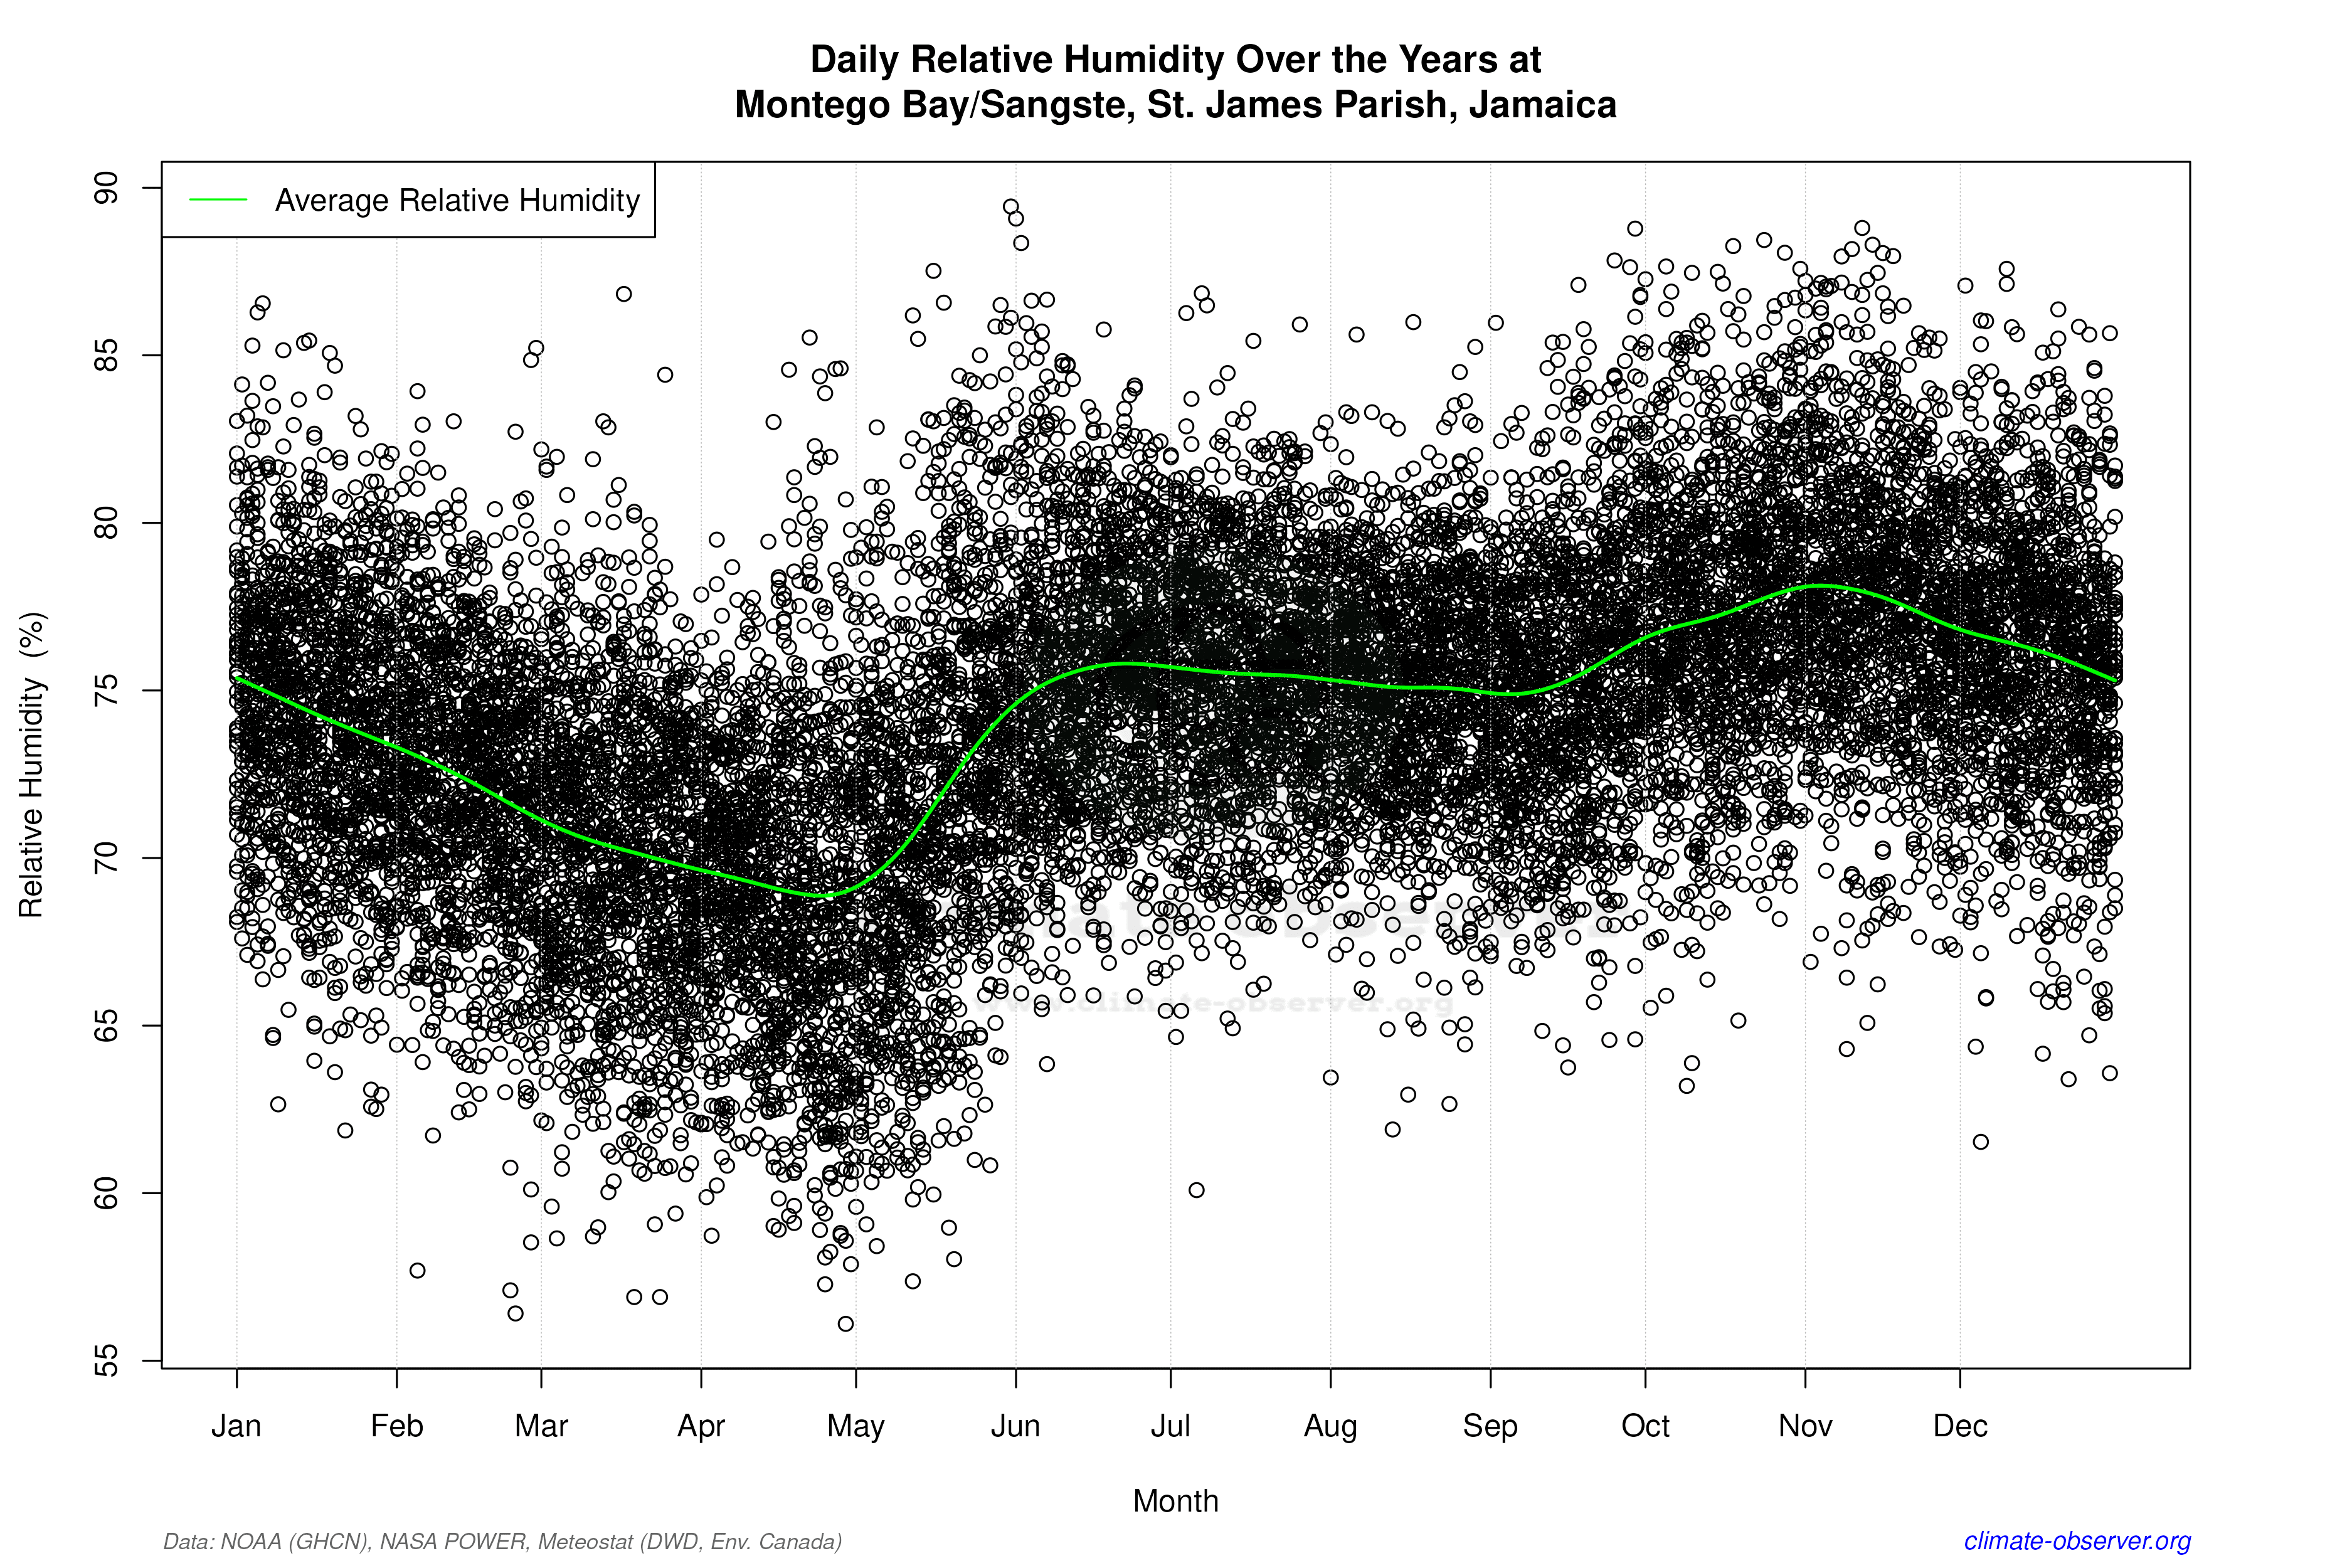

Average Max Temperature Throughout Year | 1 of 5
